

Dear Compounders,
Some of my most thorough research never earned me a cent.
A while ago, I spent hours and hours working through DigitalOcean’s filings, and most of that time went into one narrow question: how management had structured its debt and how it restructured it later.
I read the convertible note terms, mapped the maturity schedule, and went through every financing-related footnote and 8-K I could find.
I doubt many investors who own the stock today have done the same. At the end of it all, I couldn’t get comfortable with the balance sheet risk. So I sold the position I had built a few months earlier.
The stock then went on a spectacular run without me.
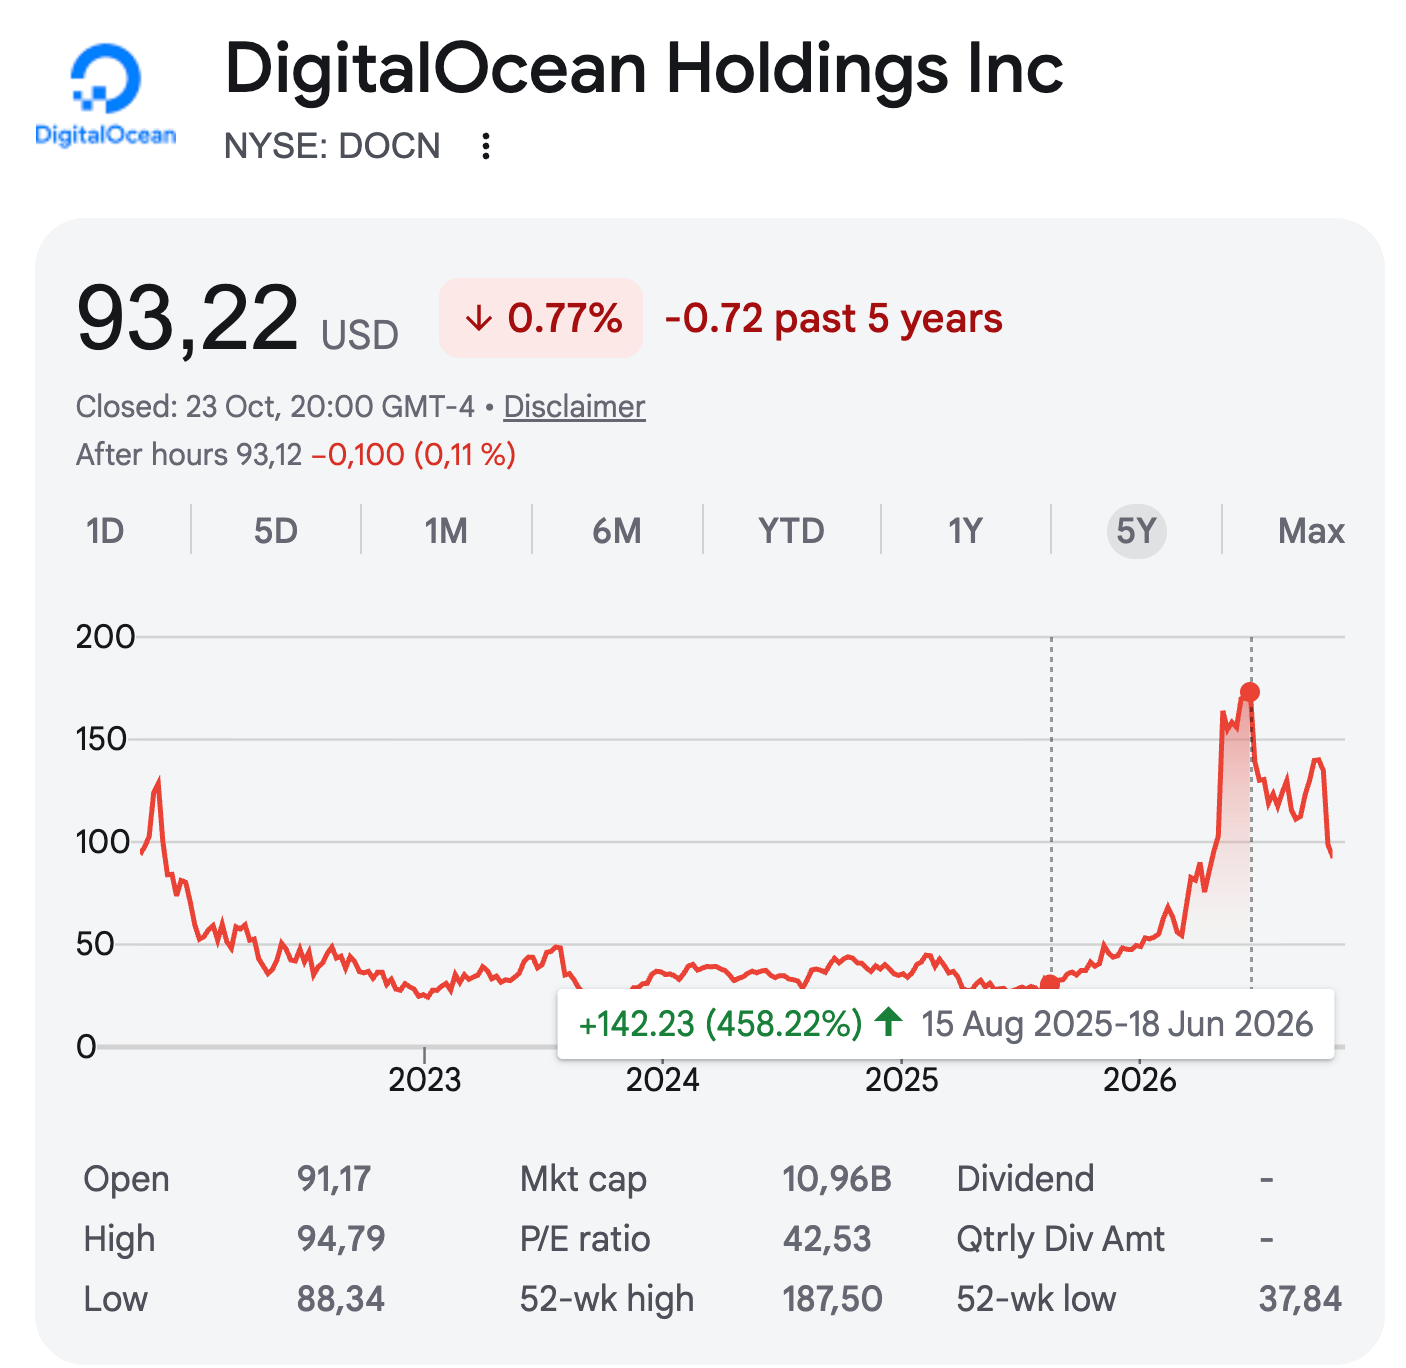
Ouch! That one stings a little.
I refuse to look up the stock chart of DOCN regularly to avoid the pain it will create in my stomach. After all, I realize investing is a game of constant regret. It’s part of the game. Still, if I held it up to the $150/share point (it peaked above $170), it would probably represent close to 50% of my portfolio today (it was a 10%-ish position back then). Now that I had to pull it up for today’s post, I’m somewhat pleased the share price has come down a little 😉
Read my DigitalOcean deep dive here:
Deep Dive: DigitalOcean ($DOCN) - Part 1

In a cloud market dominated by trillion-dollar behemoths, it might seem irrational to bet on a company like DigitalOcean. After all, how can a subscale cloud provider realistically compete with the likes of AWS, Azure, and Google Cloud?
But honestly, I’d still make the same decision today, I think, and regular readers know why. I care more about the quality of the process and the decision than about any single outcome, because outcomes in markets are heavily shaped by luck.
Tiho Brkan recently put this better than I could:
“The issue today, which wasn’t such a big deal during Buffett’s and Munger’s ‘prime time’ period, is the competition level amongst market participants. As everyone’s skill increases, it becomes harder to differentiate yourself (irrespective of competence), and thus, luck instead of skill governs more and more of the outcome.”
If luck explains a growing share of outcomes, the obvious question is what is left for skill. My answer has stayed the same for years. Skill shows up in how you gather information, how you rank it, and most importantly, how honestly and critically you judge what you find.
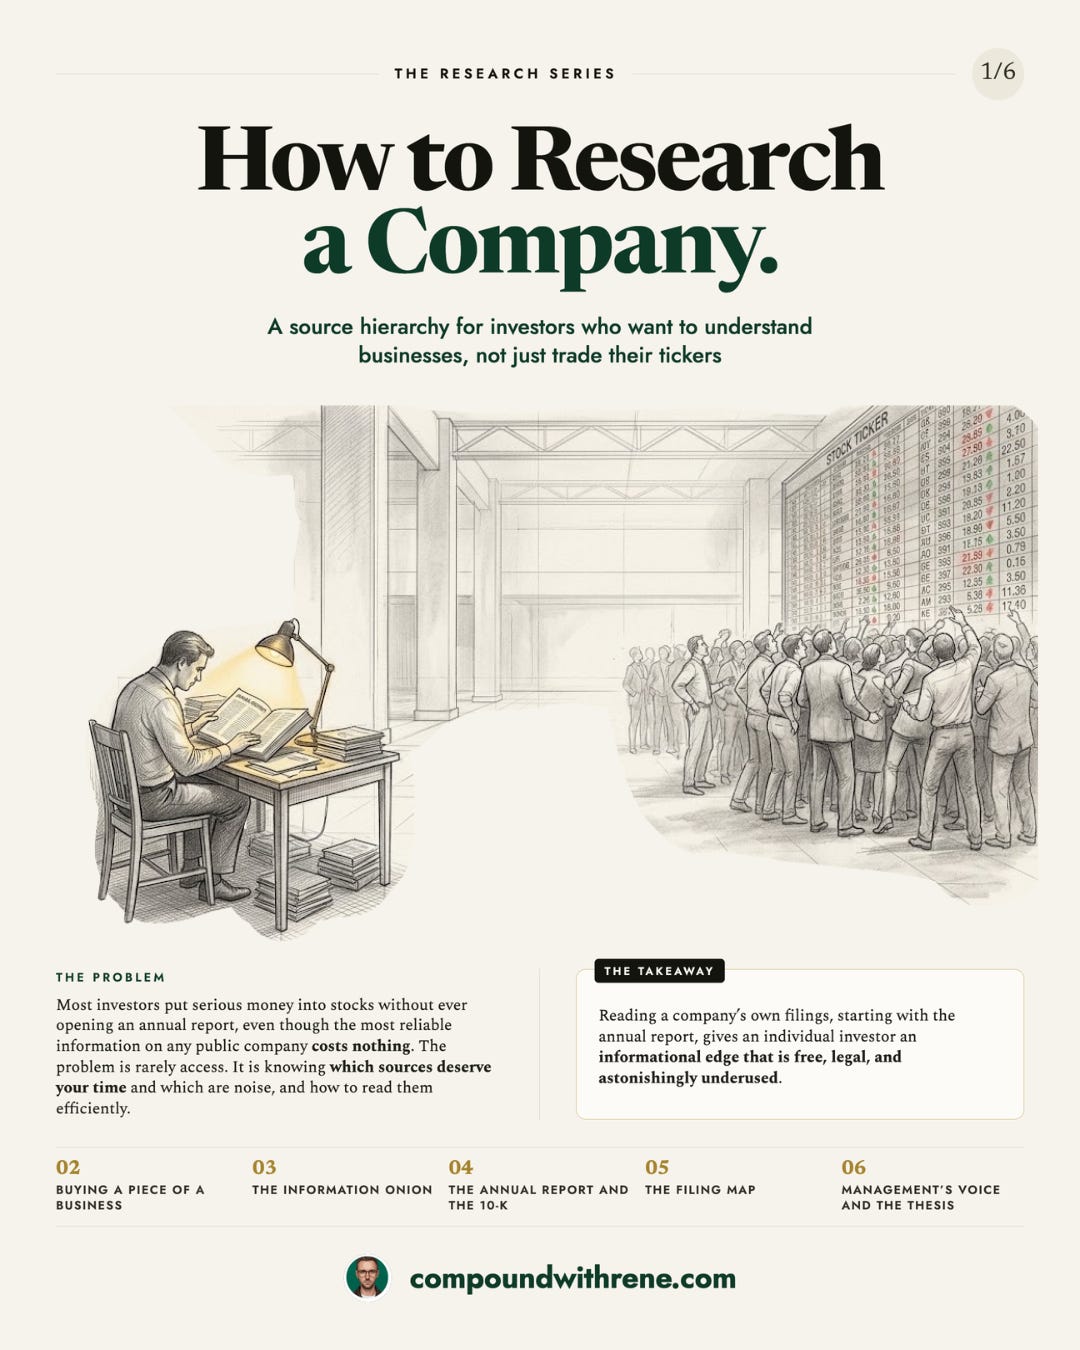
That is what today’s Blueprint is about.
The material comes from my own investing framework, a three-book series I wrote for myself between 2019 and roughly 2022. I’ve added and cut things along the way, but the core process has barely changed.
What has changed is the speed with which I can process information.
PS: If you want to dig deeper into this topic, I also recommend reading this “classic” I released last year:
Thinking in Bets: What Poker and Horse Racing Teach Us About Markets

Most people wouldn’t naturally group stock market investing, poker, and horse betting into the same category. One has billion-dollar companies and earnings calls, another is played in smoke-filled card rooms (or sleek online interfaces), and the third involves animals, turf, and betting slips.
Where does an edge come from?
Almost everything you need to analyze a public company costs nothing. Annual reports, quarterly filings, proxy statements, earnings call replays, and investor decks are all a few clicks away.
Compare that with the high-frequency trading world, where firms spend millions to place their servers as physically close to an exchange as possible because a microsecond can decide a trade. By most estimates, these firms account for a large share of U.S. equity volume. What they buy is speed, and that advantage lasts only as long as their infrastructure stays faster than the next firm’s.
That contrast is a good moment to be precise about a word investors use far too loosely. I flinch a little whenever someone says they “have an edge.” What you possess are skills. An edge is an external development, a situational setup, or a behavioral inefficiency that appears in the market for you to exploit. It is an event. And events end. Think of a broad market panic, when the wisdom of the crowd turns into the madness of the crowd and excellent businesses get sold alongside weak ones. That window can close within weeks. You can learn to recognize setups that favor you and lean into them when they appear, but no process lets you store them and pull them out on demand.
Reading primary sources falls on the skill side of that line. It is learnable, repeatable, and free.
If you carefully read one annual report, or better, the last two or three (or more!), you have probably done more homework than most people holding the stock.

It sounds too easy to be true. It isn’t. People compare refrigerators for weeks and then buy a stock on a tip.
That gap in diligence is what lets the prepared investor act when an edge finally appears. When a stock collapses on a headline that one footnote in the 10-K would have put into context, the investor who has read that footnote can move while everyone else is still guessing.
Joel Greenblatt described the alternative memorably:
“Choosing individual stocks without any idea of what you’re looking for is like running through a dynamite factory with a burning match. You may live, but you’re still an idiot.”

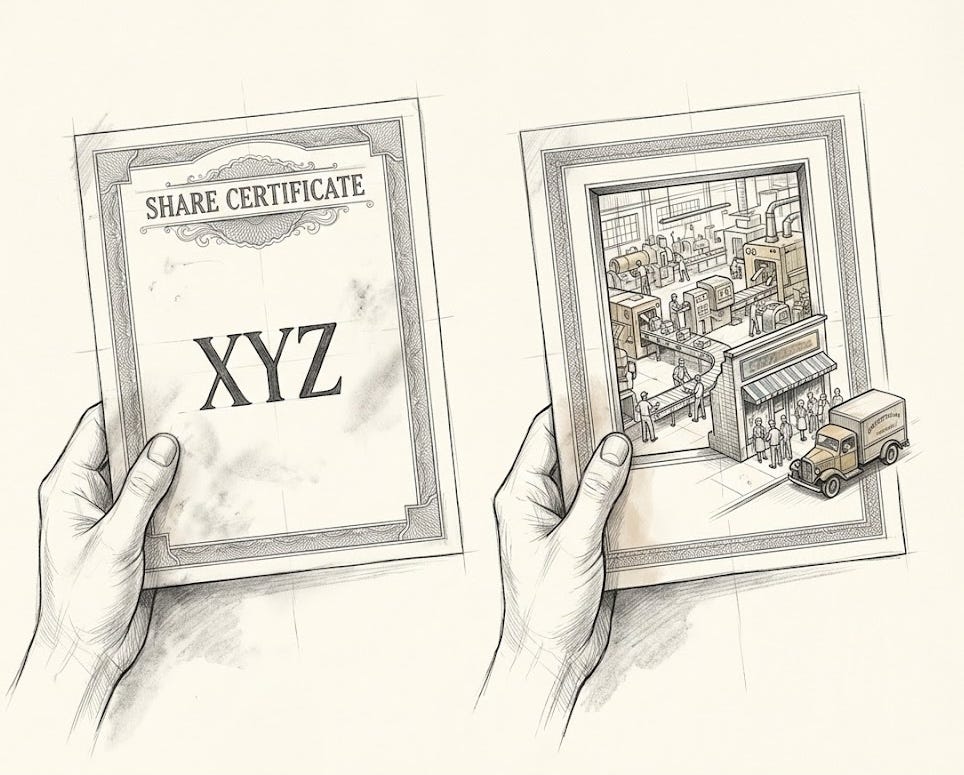
The opening slide of the Blueprint frames the mindset that makes the rest of the deck work. A share is a fractional claim on a living business, with customers, competitors, a management team, and a balance sheet.
Once you take that seriously, researching before you buy stops feeling optional.
What is new in 2026 is the friction around reading. Any chatbot can now produce a ten-line summary of a 10-K in seconds.
That is useful, sure. It also tempts investors to outsource the skill itself, and I think that’s a trap.
A summary is someone else’s view of what mattered in a filing, and in my DigitalOcean work the answer was buried in footnotes no summary would have highlighted.
The Analytical Edge Was Dead. AI Might Be Bringing It Back.

You can read this article entirely for free. If you find value in this research, consider becoming a Premium Member for less than $1/day to unlock our full archive and join our growing circle of investors (I highly recommend checking out “The Library” to see what’s inside; you can find it right on the homepage).
Skills you stop practicing tend to fade, and they tend to fade right before the market offers the setup that would have rewarded them.
Which layer of the onion are you reading?
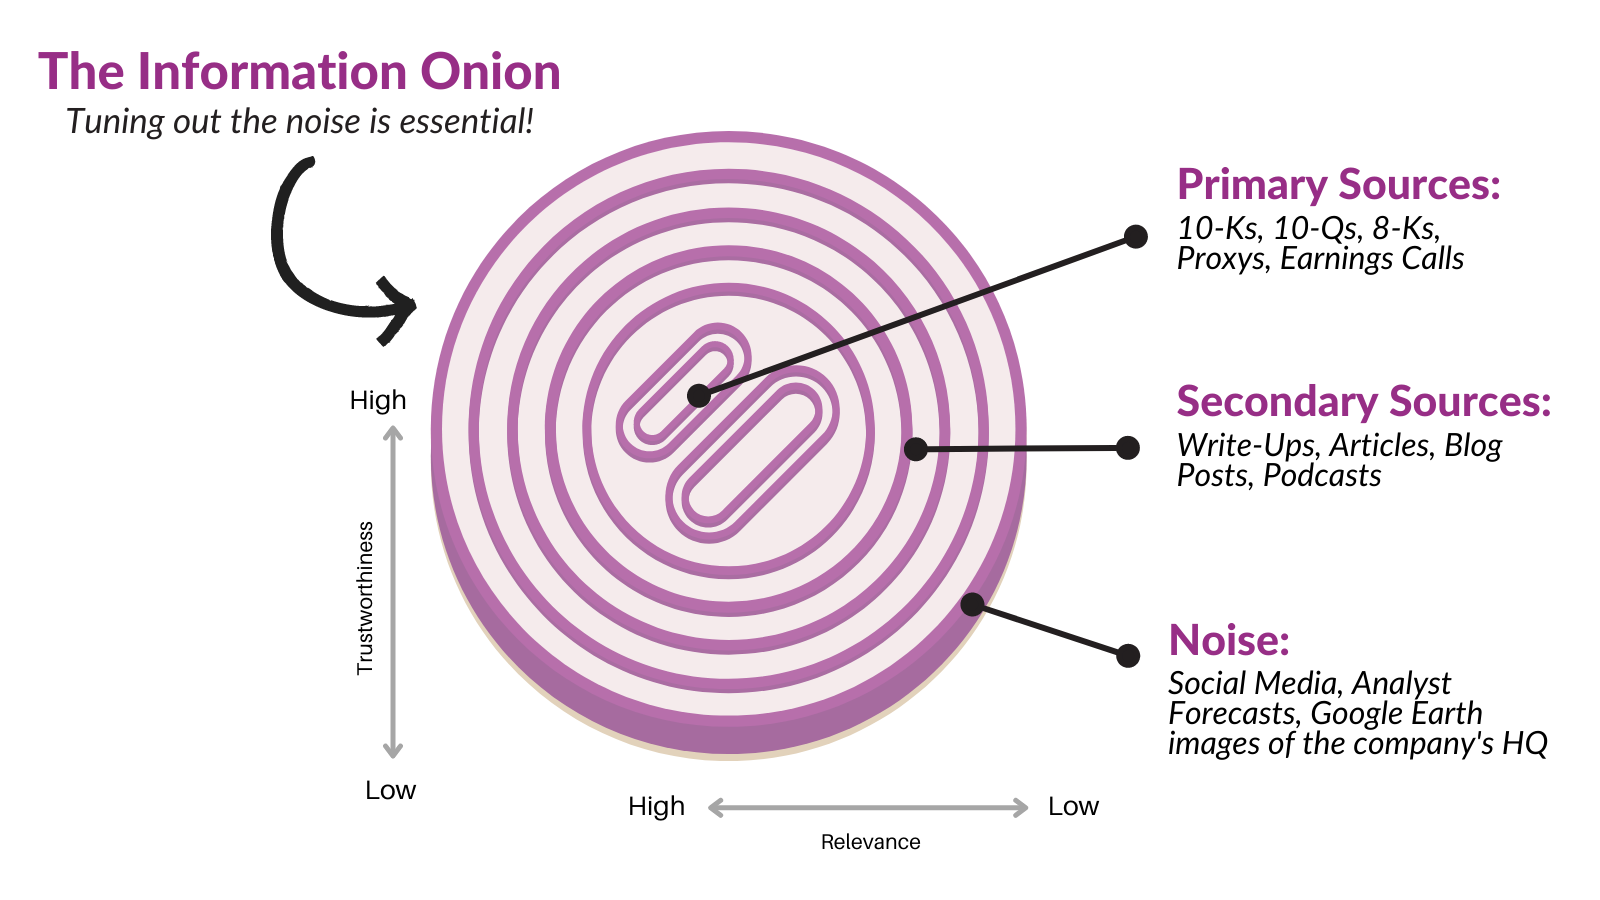
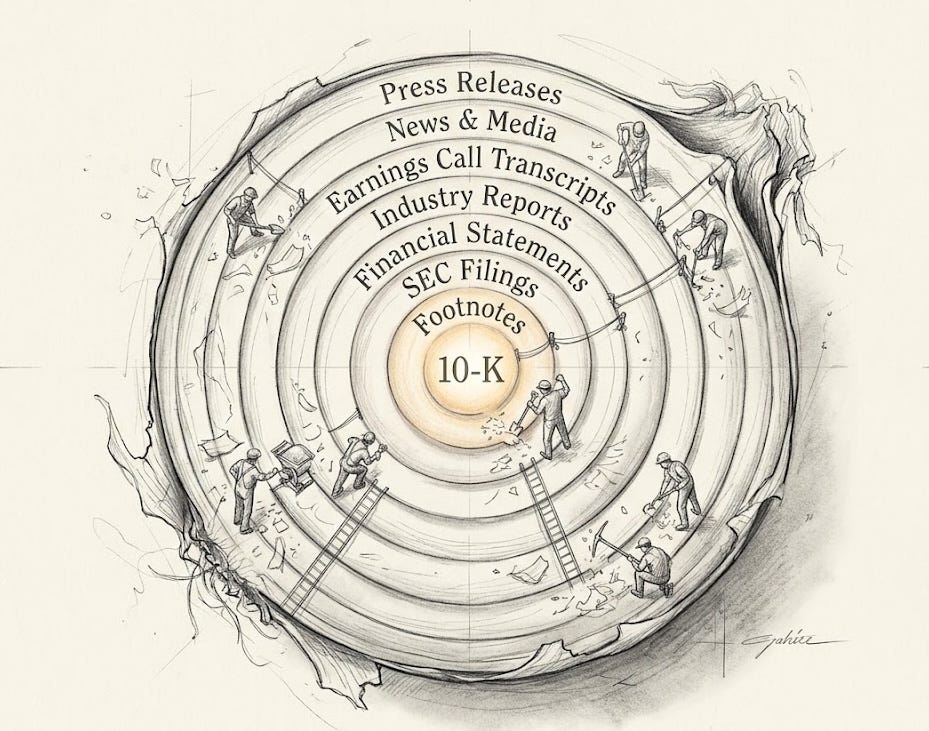
A mental model I use often is what I call the information onion.
It sorts sources along two dimensions, relevance and trustworthiness, and arranges them in layers.
At the core are 10-Ks, 10-Qs, 8-Ks, and proxy statements. These are documents where management is legally required to give its most complete assessment of the business, and it is accountable for what it writes.
The next layer holds press releases, investor decks, and earnings calls. They still come from the company, but they reflect what management wants to tell you. Further out sit write-ups, articles, blog posts and podcasts, which interpret the core material with varying skill and bias. The outer skin is noise: rumors, social media chatter, analyst price targets and satellite photos of a company’s headquarters.
The structure is easier to remember as a picture, so this is the slide I’d keep within reach whenever I open a new research folder.
The discipline is to work from the inside out. Most investors do the reverse. They start with a thread, a podcast clip or a price target, form an opinion, and then go looking for confirmation. Aswath Damodaran’s advice addresses exactly this habit:
“Confine your background research on the company to information sources rather than opinion sources; in other words, spend more time looking at a company’s financial statements than reading equity research reports about the company.”
When I first wrote this framework, the outer layers looked different. Investors searched for $FB on Twitter. Today Facebook is Meta, Twitter is X, and a new kind of source has entered the onion. An AI summary with no links back to its source documents belongs in the outer layers. It is an opinion about a filing, and it carries an extra risk: it may present invented facts with complete confidence.
This is why I’ve built my process around source-grounded tools. For my deep dives, I load primary documents into NotebookLM, which answers only from the files I give it and links each answer to the passage it came from. I wrote about that process here.
That keeps the AI working at the core of the onion rather than adding another layer of noise. It still makes mistakes, such as attaching a number to the wrong year, so I treat everything it produces as a first draft and check the key figures myself.
The result surprised me. AI has made my research faster per question, yet my total time per deep dive has gone up, often past 40 hours, because I can now go much deeper into the primary material. My latest deep dive shows what that looks like in practice.
Can you understand a business in under an hour?
The second mental model is triage. A full 10-K can run past 150 pages, and few people have time to read every filing of every company on their watchlist.
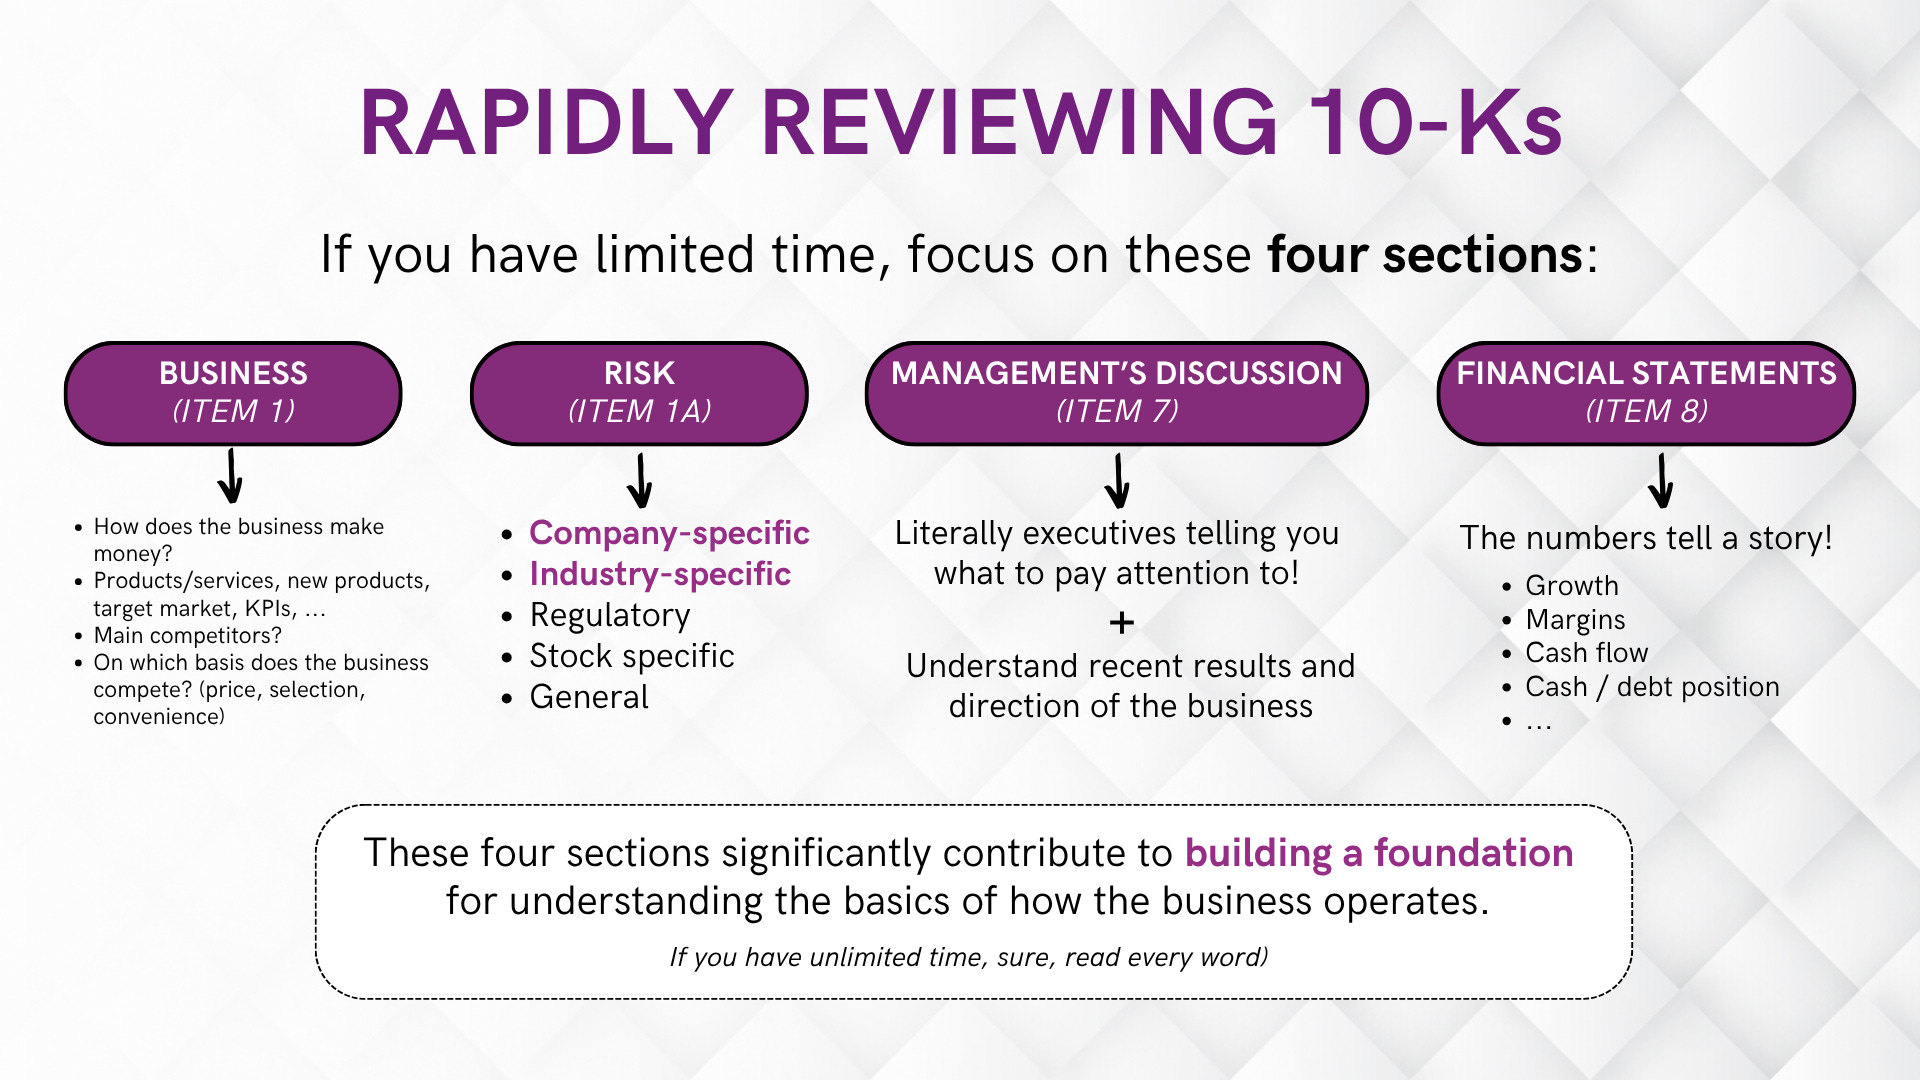
You don’t need to. Four sections do most of the work.
Item 1 explains how the business makes money, who it competes with, and whether it competes on price, selection or convenience.
Item 1A covers risks. Most of that section is legal boilerplate, so look specifically for the company- and industry-specific risks.
Item 7, management’s discussion and analysis, is where executives tell you what they think matters.
Item 8 holds the financial statements, where growth, margins, cash flow and debt reveal the underlying story.
If I’m short on time because I have a busy week or month, I give myself 45 to 60 minutes per reading session, and most of that time goes to the business section. Time pressure helps me focus. Highlighting helps me stay engaged. And if the business doesn’t interest me after Item 1, I stop.
That’s a fair outcome for the session.
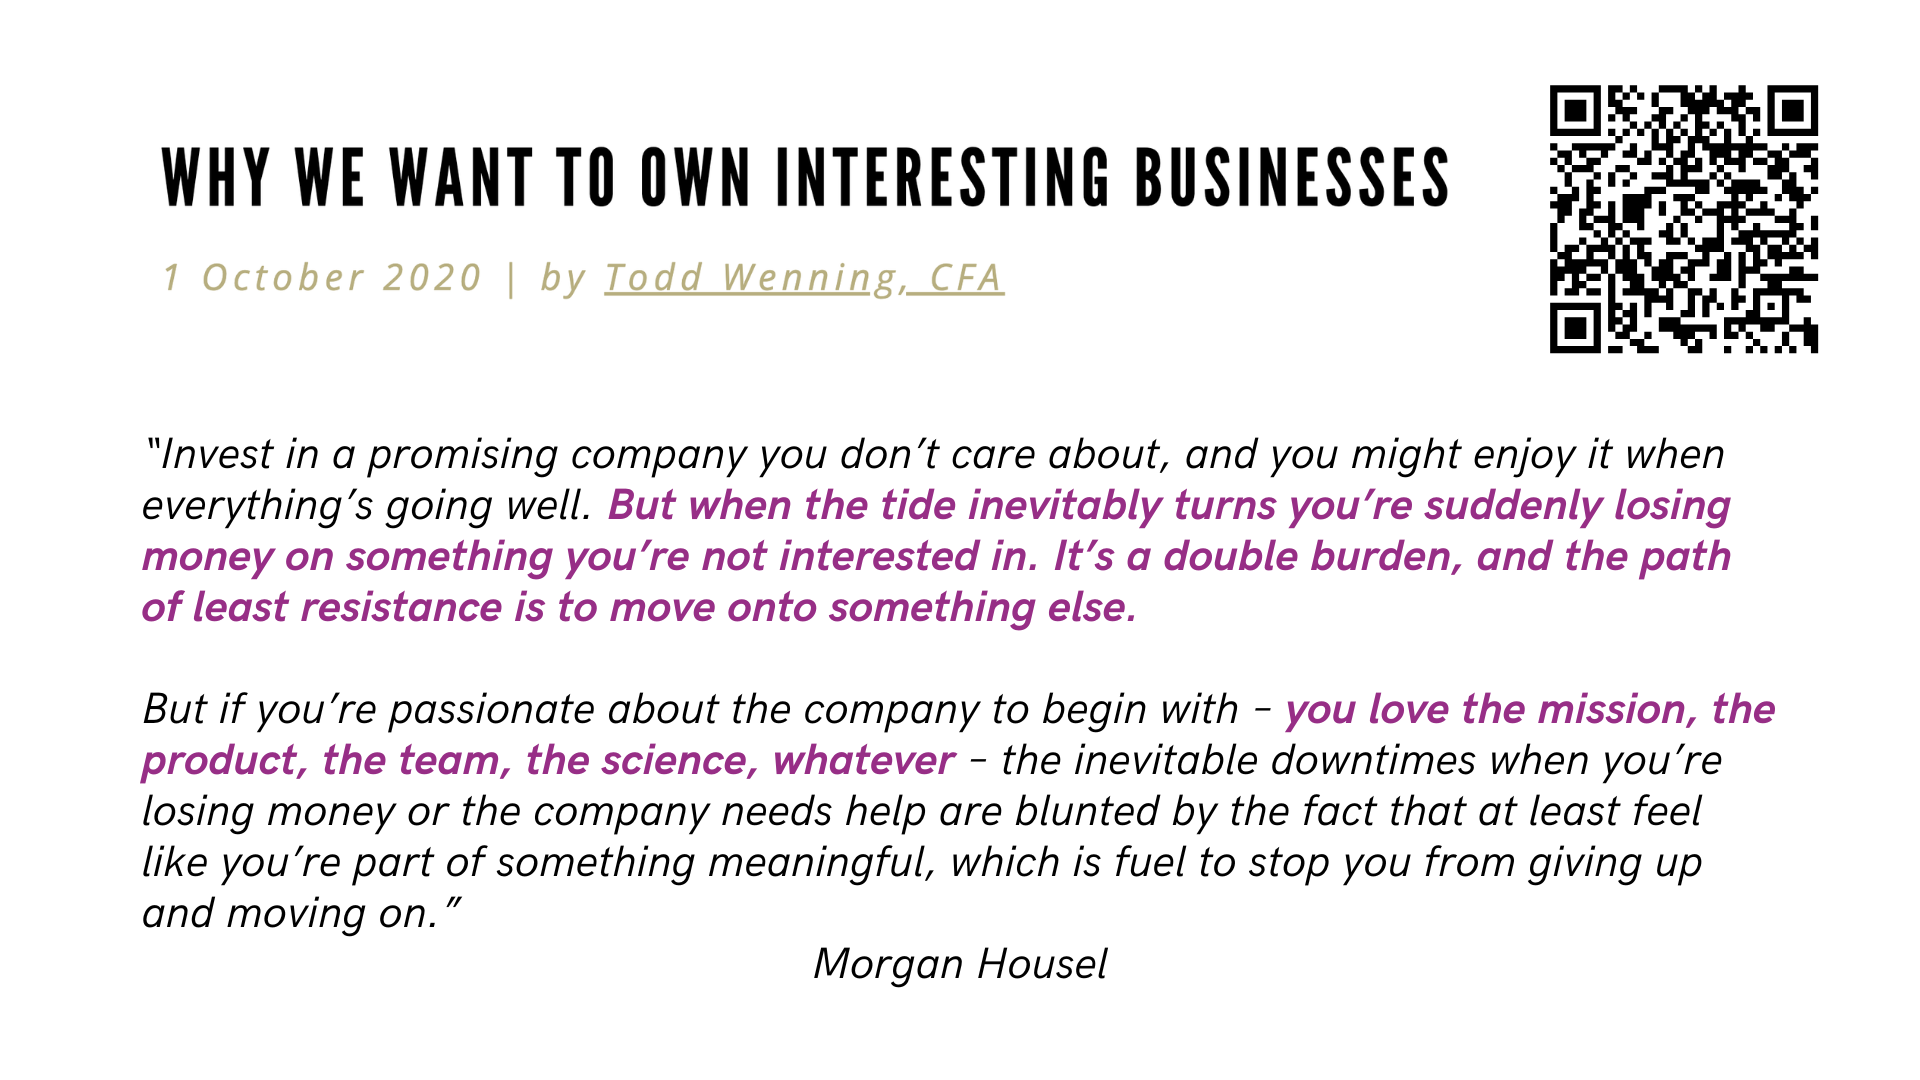
Furthermore, owning a company you don’t care about becomes a double burden the moment the stock falls, because you are losing money on something you never wanted to understand in the first place.
On this concept, I have this slide I created years ago stored on my computer:
The triage further above reveals something beyond the numbers. Every annual report tests how clearly management can explain its own business. Glossy versions designed for marketing tend to work against clarity, and my rule of thumb is that the more colorful the page, the less useful the information.
The plain-text 10-K is usually more informative.
But the deeper signal is whether you understand the business better after reading than before. If you don’t, the problem may lie with the authors.
Seth Klarman put it bluntly:
“If you don’t quickly comprehend what a company is doing, then management probably doesn’t either.”
AI has compressed this step for me as well. The hour that once went into finding the right passages now goes into questioning them. The principle hasn’t changed.
Triage tells you where to spend your attention, and it’s the first step of the analysis, never the last.

Disclaimer: The analysis presented in this blog may be flawed and/or critical information may have been overlooked. The content provided should be considered an educational resource and should not be construed as individualized investment advice, nor as a recommendation to buy or sell specific securities. I may own some of the securities discussed. The stocks, funds, and assets discussed are examples only and may not be appropriate for your individual circumstances. It is the responsibility of the reader to do their own due diligence before investing in any index fund, ETF, asset, or stock mentioned or before making any sell decisions. Also double-check if the comments made are accurate. You should always consult with a financial advisor before purchasing a specific stock and making decisions regarding your portfolio.
Who gets paid, and for what?
The third model is the one I’d most like more investors to adopt: read the proxy statement before you trust the people running the company.
Filed ahead of the annual meeting, the proxy shows how executives are paid, which targets their bonuses depend on, what the board earns, how the board has changed, and which relationships connect directors and management. It also includes career histories. I generally trust founder-owners and executives who rose through the company more than leaders brought in from an unrelated industry, and the proxy is where that distinction becomes visible.
Pay design is a revealing element too. Management can talk about long-term value creation, but if bonuses depend on short-term earnings per share, you know which goal will win in a difficult year.
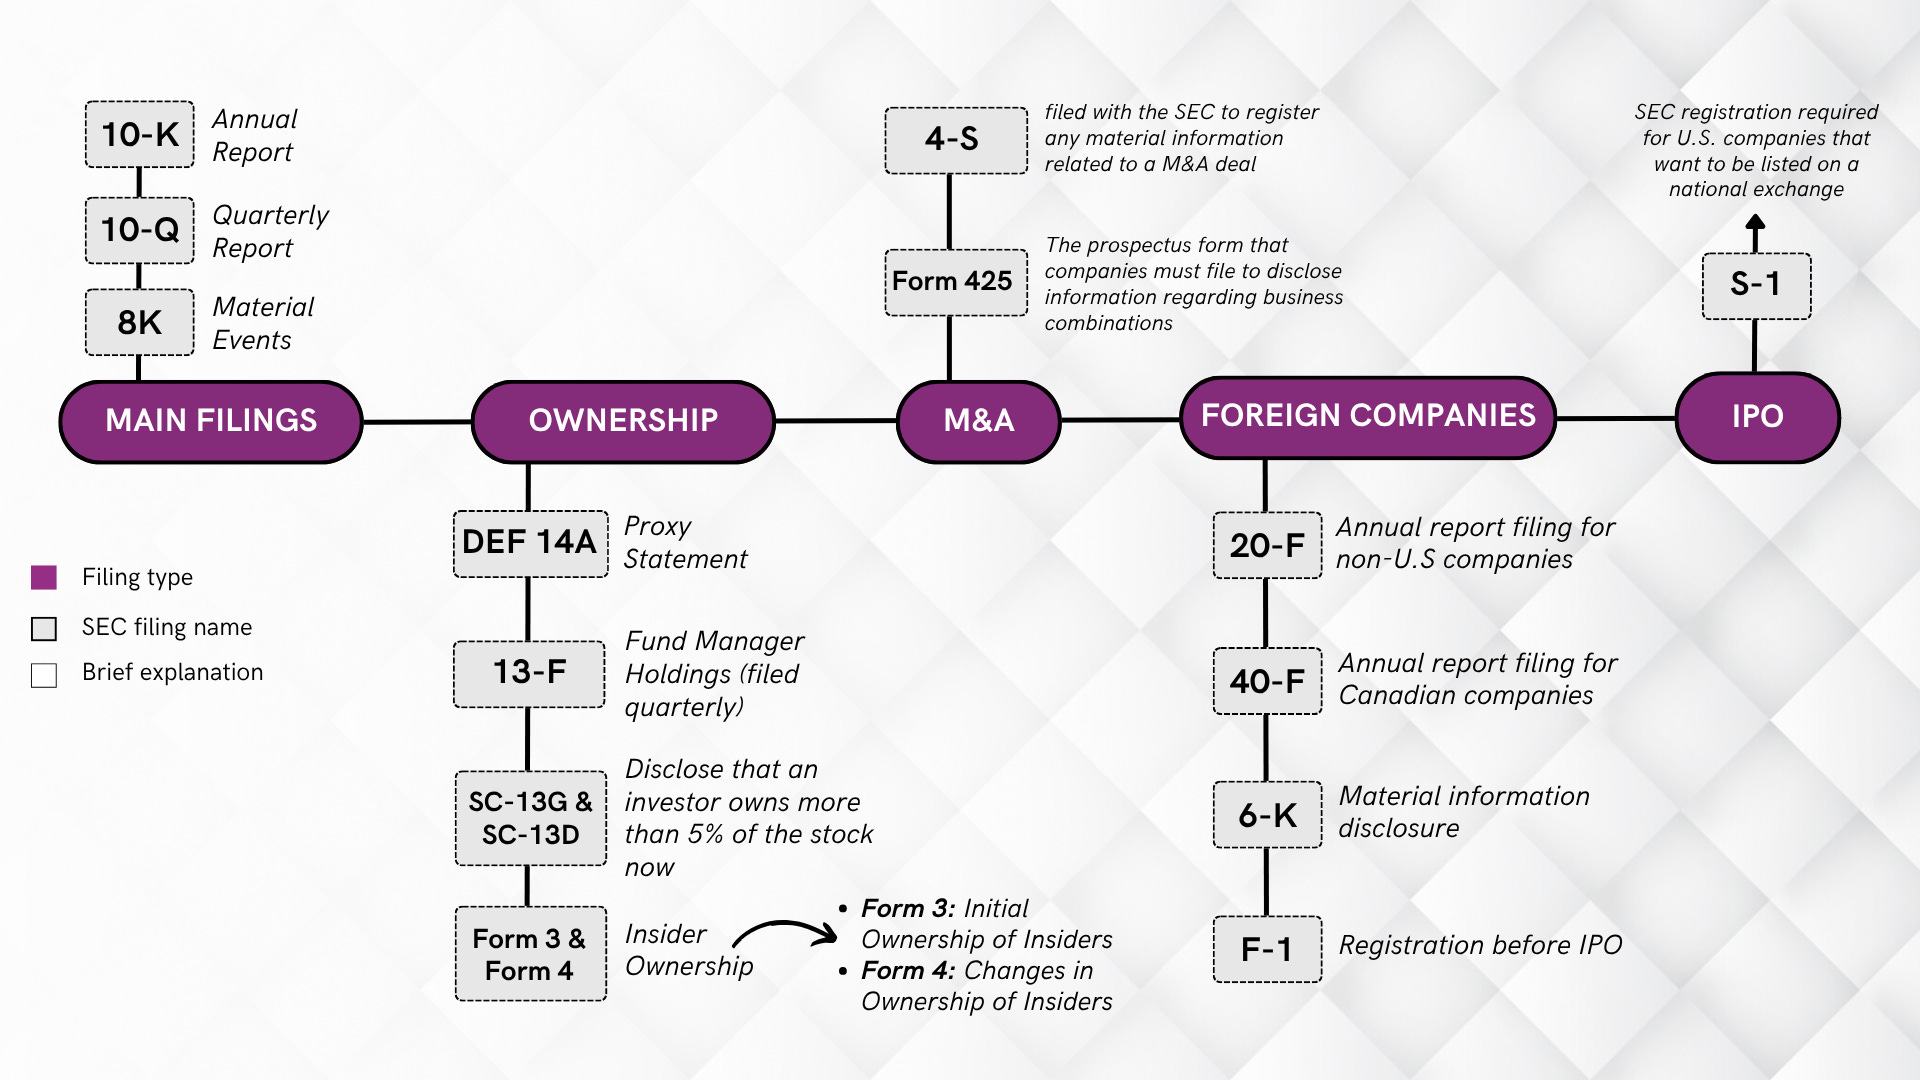
Ownership filings round out the picture. Form 4s show insider buying and selling, while Schedules 13D and 13G show who has crossed the 5% threshold. The SEC has since tightened several of these beneficial ownership deadlines, so that data now arrives faster than when I first wrote the framework.
The SEC’s filing system can feel like a maze of letters and numbers, which is why I organized it as a map. The slide below groups the filings by what they tell you: core reporting, ownership and incentives, deals, foreign issuers and IPOs. Once you know which form answers which question, the maze becomes a toolkit.
None of this is exciting reading. That’s exactly why it remains underused. Peter Lynch reminded investors that research is work:
“‘Play’ is the wrong verb for the stock market. This is work.”
Does a good process guarantee a good outcome?
No. DigitalOcean proves that. The research was careful, and the decision was consistent with my framework, and I still missed a big move.
A good process gives you something more durable than any single return: a decision you can explain, defend, and revisit.
That’s why every research process I run ends in writing. I record the date, a one- or two-sentence business description, a pass through my checklist, a concise thesis, and the few variables that drive long-term value creation. Then I review it regularly.
Over time, that record is the only honest way to separate the decisions I got right from the ones where luck carried me.
Before that thesis gets written, I look at the human layer: the unscripted Q&A on earnings calls, years of shareholder letters, critical write-ups, and conversations with people who use the product or work in the industry. A CEO who openly names past mistakes earns a lot of credit with me. A letter full of hype after a bad year earns the opposite.
As competition rises and luck explains more of each individual outcome, the controllable part of the job becomes more valuable. You control which layer of the onion you read. You control whether you check the proxy. You control whether your thesis is written down where you can’t revise it after the fact.
The Blueprint
I distilled the full lesson into a clean visual deck: the case for treating stocks as businesses, the information onion, the one-hour 10-K review, the SEC filing map with its incentive and ownership signals, and the human layer of earnings calls, shareholder letters and conversations with customers, ending with the written thesis.
You’ve seen the cover slide above. I’ll insert the second slide below.
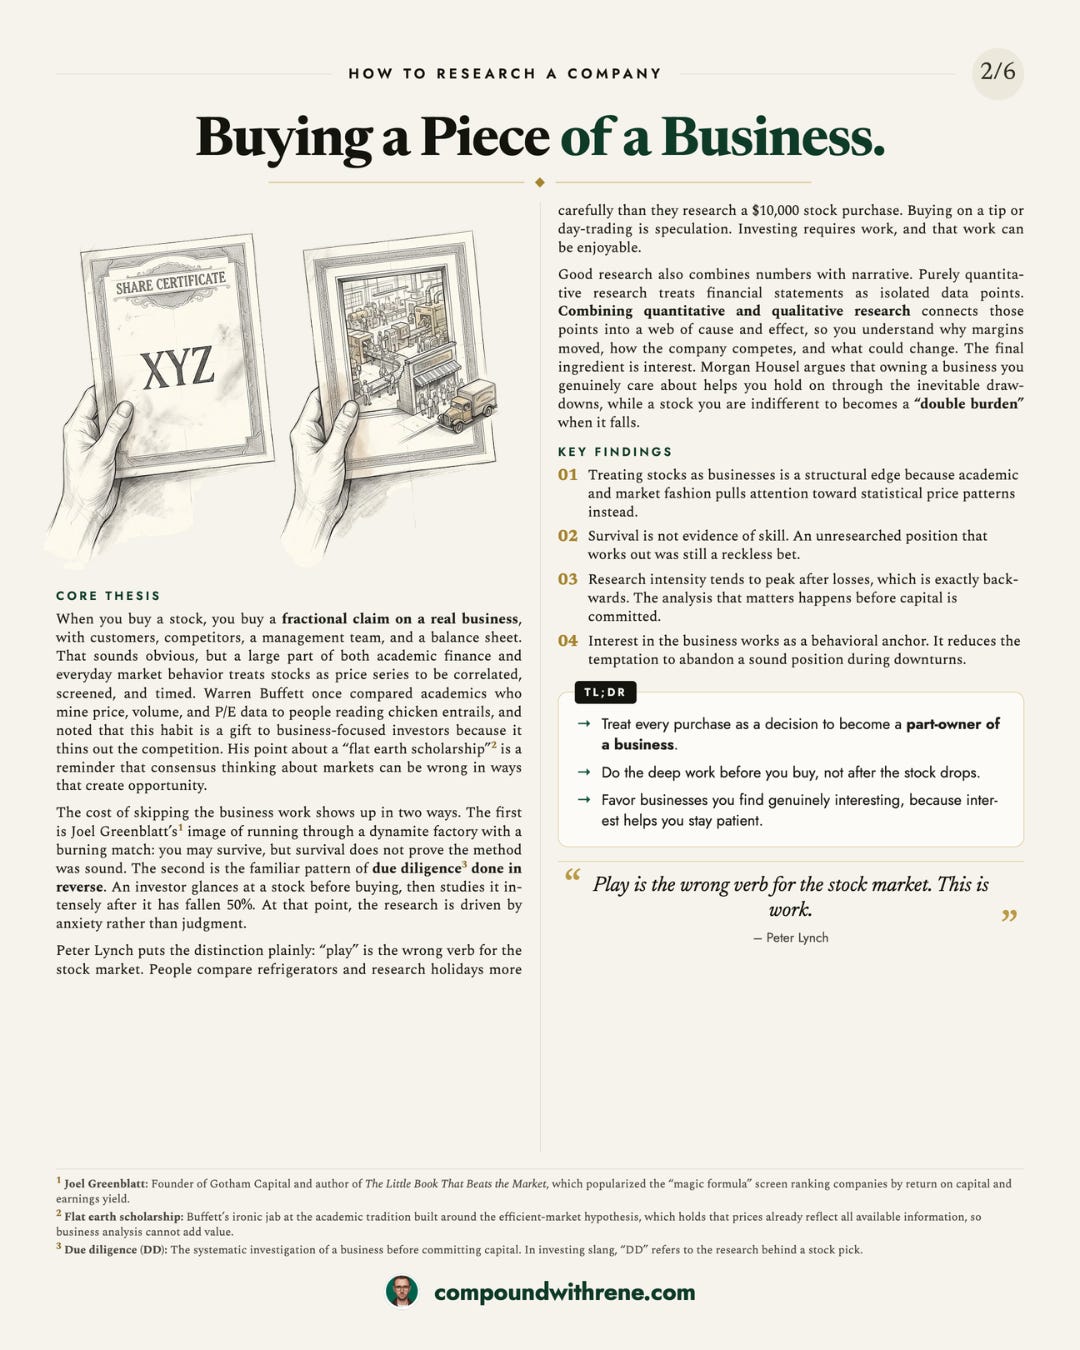
The full series is meant to be the kind of reference you keep open next to a filing.
Downloadable PDF
The complete image series is free to review for everyone who is subscribed to the blog. Simply subscribe below (if you haven’t already), and you can then access and download the Blueprint as a PDF so you can store it – and all old and future Blueprints – nicely on your computer.
Until next time, keep compounding.
To download the PDF, I only ask that you subscribe, which costs nothing and can be undone with a single click whenever you like.