Today, I am going to write about the concept of “half a lost decade”-stocks as an adjustment to the “lost decade”-stocks mental model, because the original version doesn’t fit my investing style or the kind of business I want to be a part-owner in.
The adjustment itself is small. What it does to the list of names that end up on my watchlist is not.
A friend told me Mercado Libre might be the next cycle’s loser
I started thinking about all of this while discussing my bet on Mercado Libre with a friend of mine.
His argument is a rule of thumb rather than a company view, and he’d be the first to say so. He avoids overcrowded trades and long-running popularity contests on the grounds that this cycle’s biggest winner tends to become the next cycle’s biggest loser, and Meli fits that description almost too neatly.
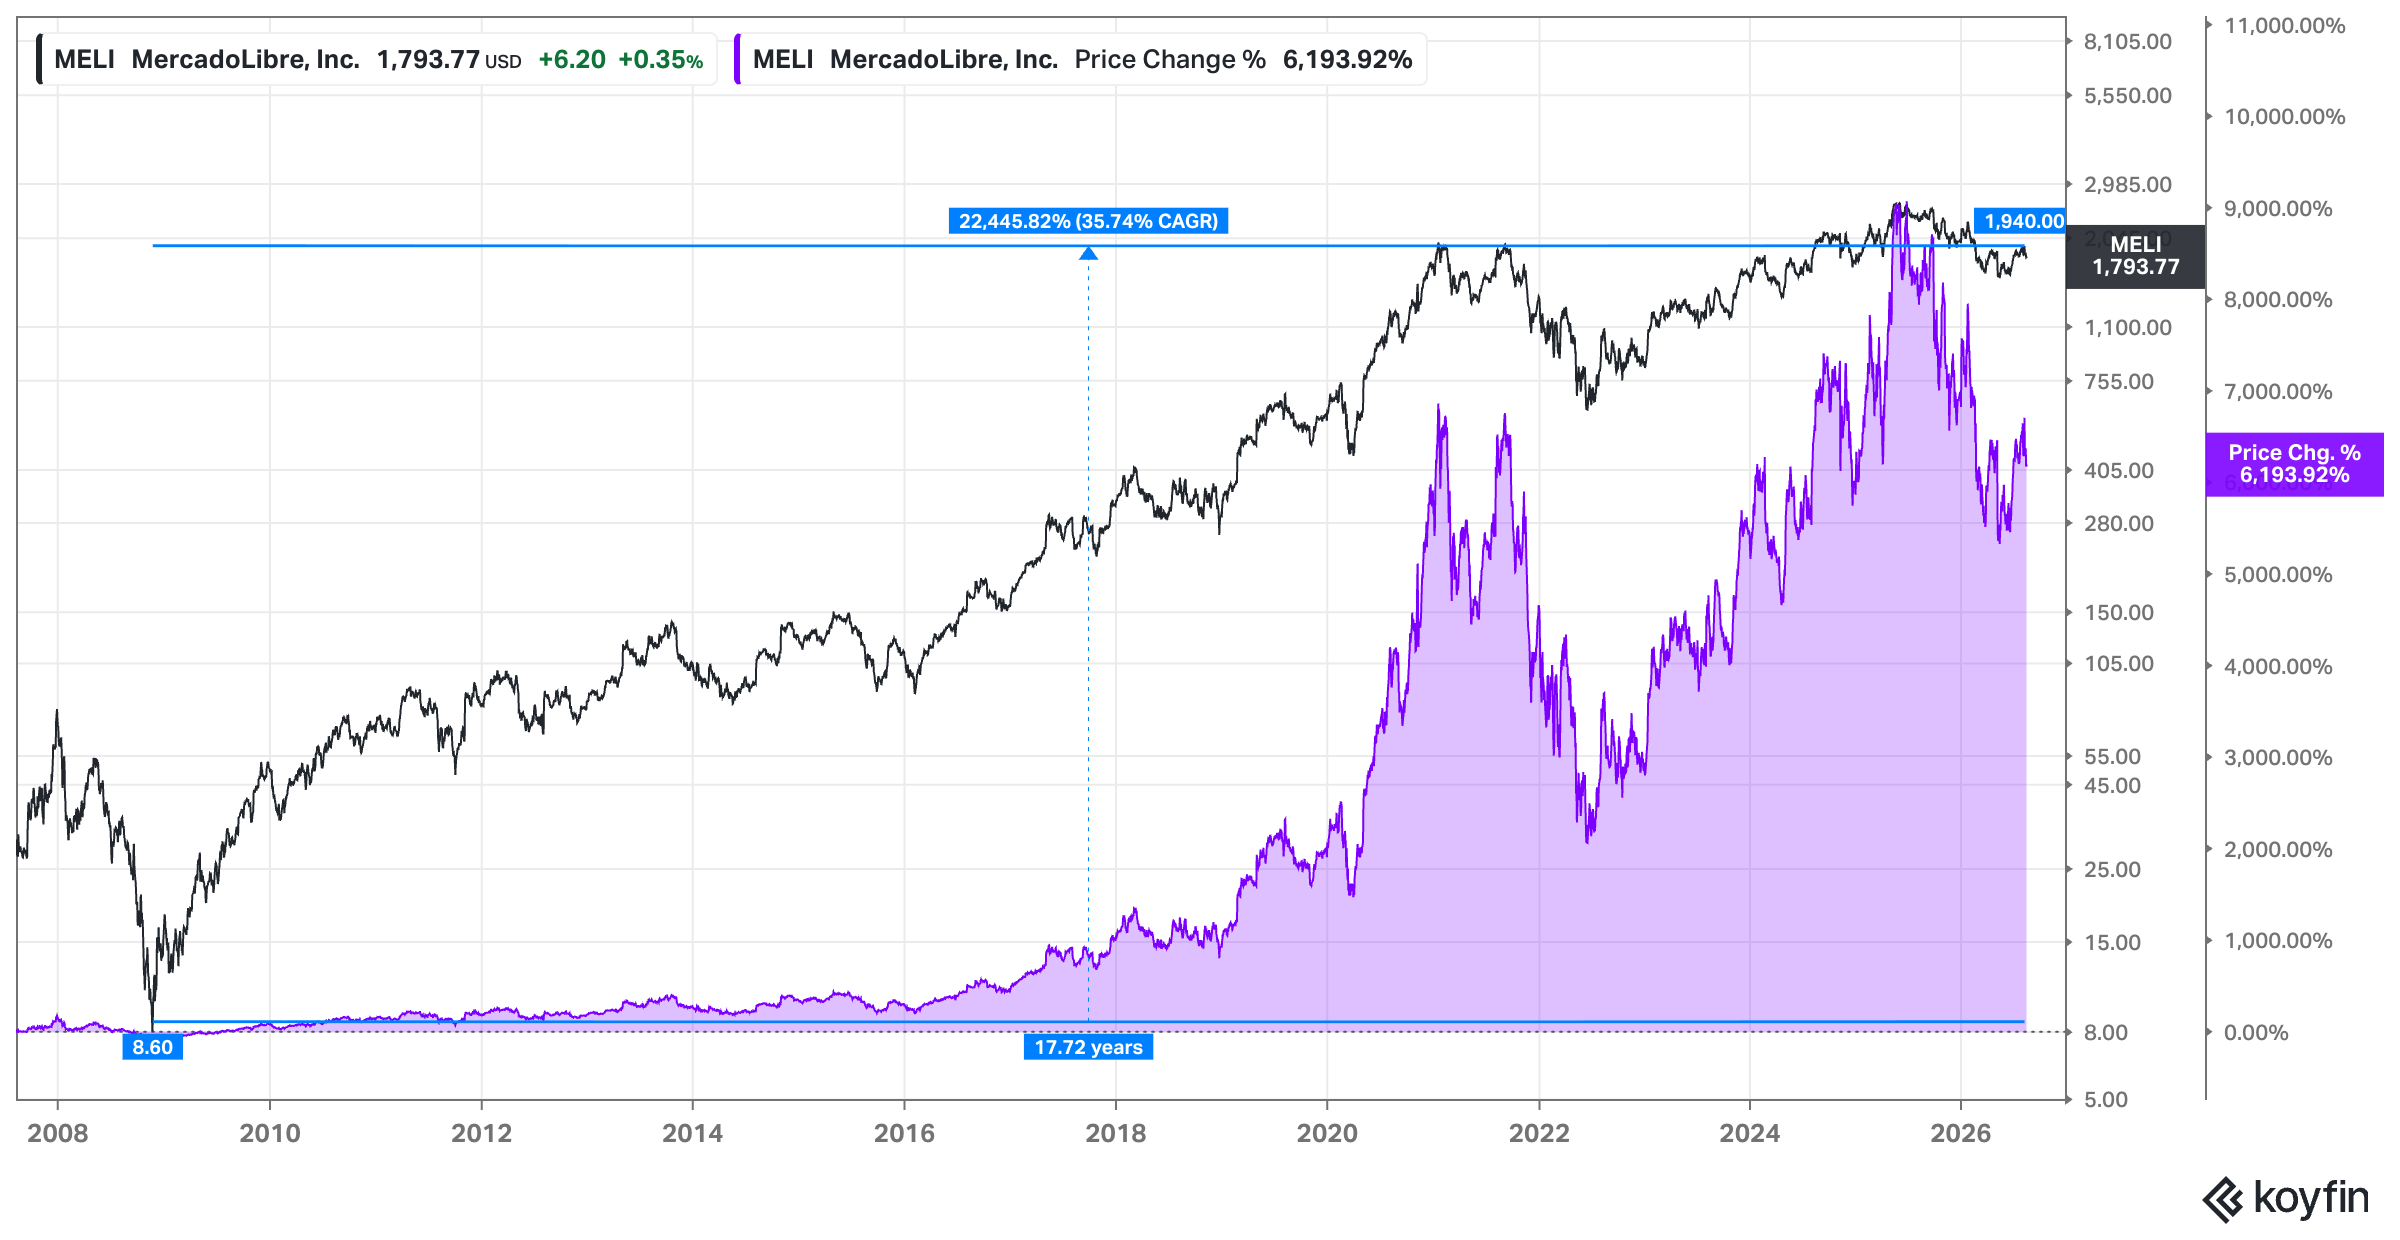
Compounding at roughly 35% a year for 17 years – taking the GFC bottom as the starting point – is the sort of number that makes him nervous rather than excited, because nothing compounds like that forever and the market has to mean revert eventually.
I agree.
Trees don’t grow to the sky. His concern is that Mercado Libre may now experience something like a lost decade, and that the starting point may have been in 2021.
He even made the point that will leave many investors – and MELI owners specifically, I guess – genuinely confused (or even make them angry – I should place a trigger warning here):
Meli could sit completely dead for fifteen years from the 2021 peak, and the stock would still have compounded at 20% a year since the 2009 lows.
That is how much return has already been “pulled forward.”
To be fair, I see his point, and I’m not in strong disagreement with the general point he is making. High growth for a long period of time coupled with absolutely marvellous stock performance, and on top of this, being the darling of the investing community … that’s the kind of setup I tend to avoid too.
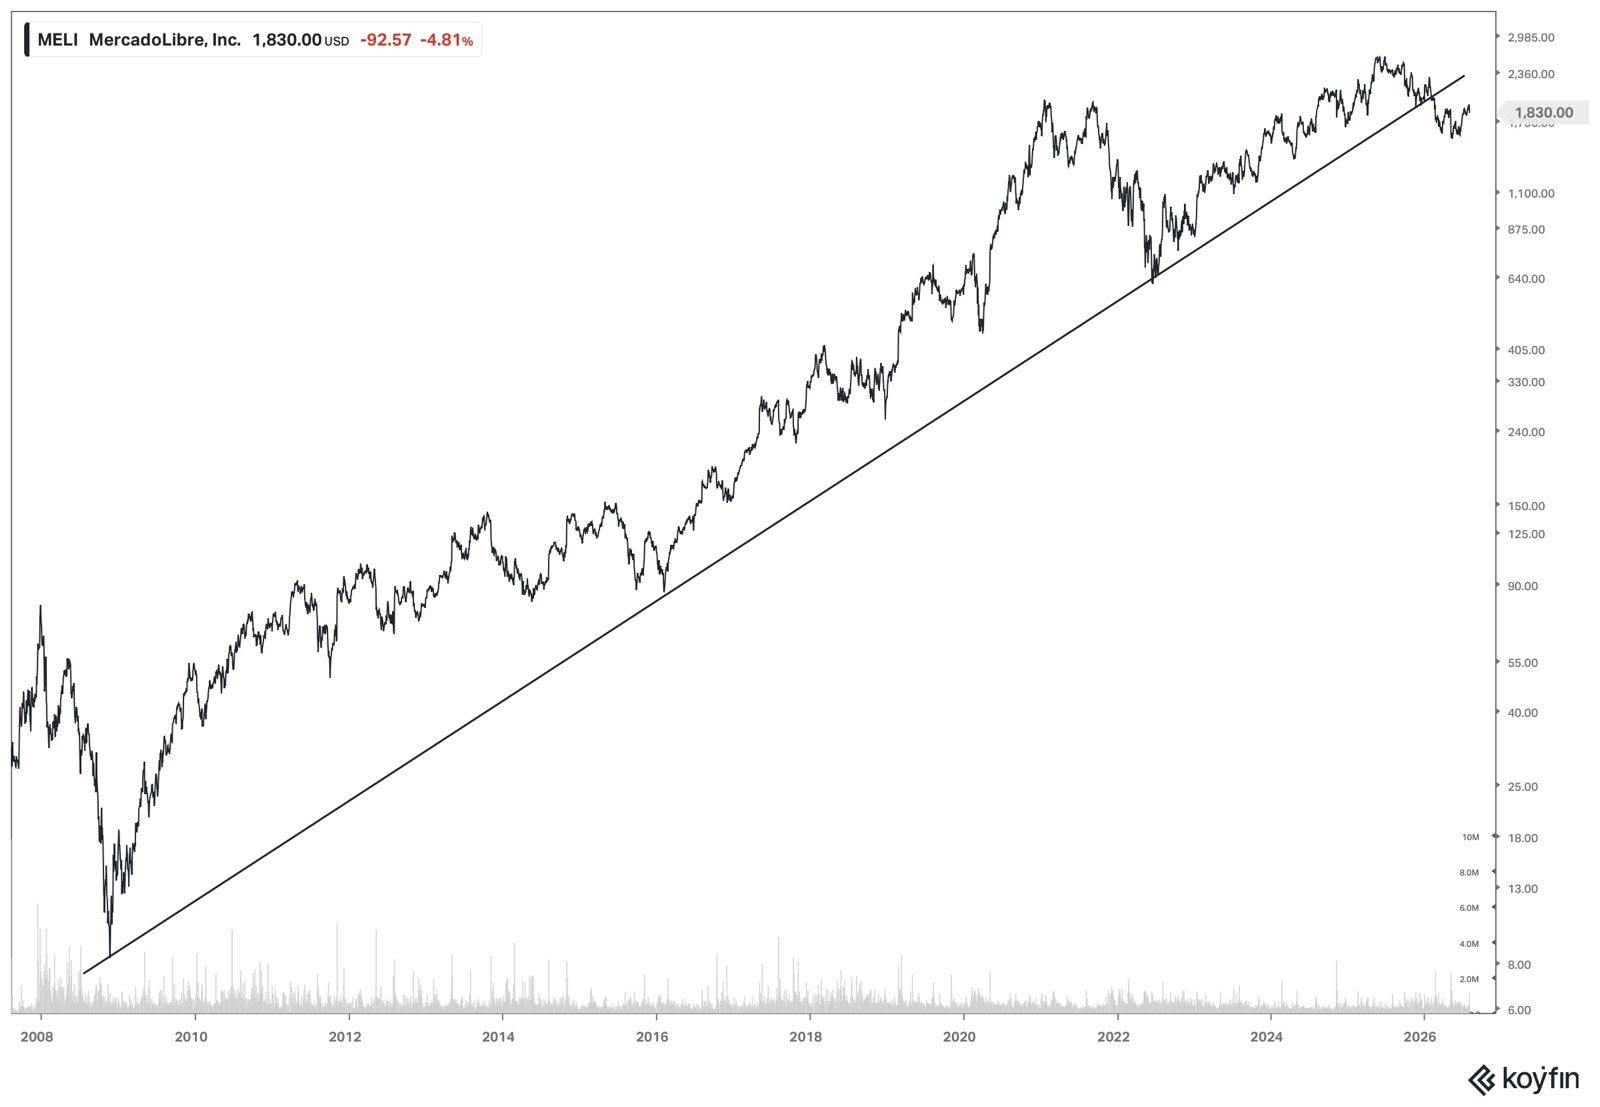
Also, I’ve become more open to the idea that a stock’s price can move in a very different direction from the business for quite a period of time, for all sorts of reasons, and that tracking it matters. Seeing signals in price – like in Meli’s stock (to be discussed below) – can be incredibly powerful too. And I’ve learned the following: a trend in price that has held for several years carries far more information than one that formed a few weeks ago.
You might want to bookmark my perception change framework to read next:
If you had asked me a few years ago whether technical analysis had a place in a fundamentally driven investment process, my answer would have been polite but skeptical.
This ties back to how markets move. Downtrends tend to be faster and more compressed. They often reflect fear, forced selling, or rapid reassessment, and they resolve quickly, because panic has a short half-life.
Uptrends, by contrast, can persist for very long periods. Five, ten, even fifteen years is not unusual for strong businesses. That’s why breaks in long-term uptrends deserve attention. They don’t happen often, and when they do, they usually signal a meaningful change in perception, and they often “break hard.”
As a rule of thumb:
The longer and steeper the uptrend, the more violent the reversion when it finally breaks.
And that’s a pattern you can spot with Meli’s stock too.
At the same time, price is one of many things to look at, and it’s the only input on the list that describes the crowd rather than the company.
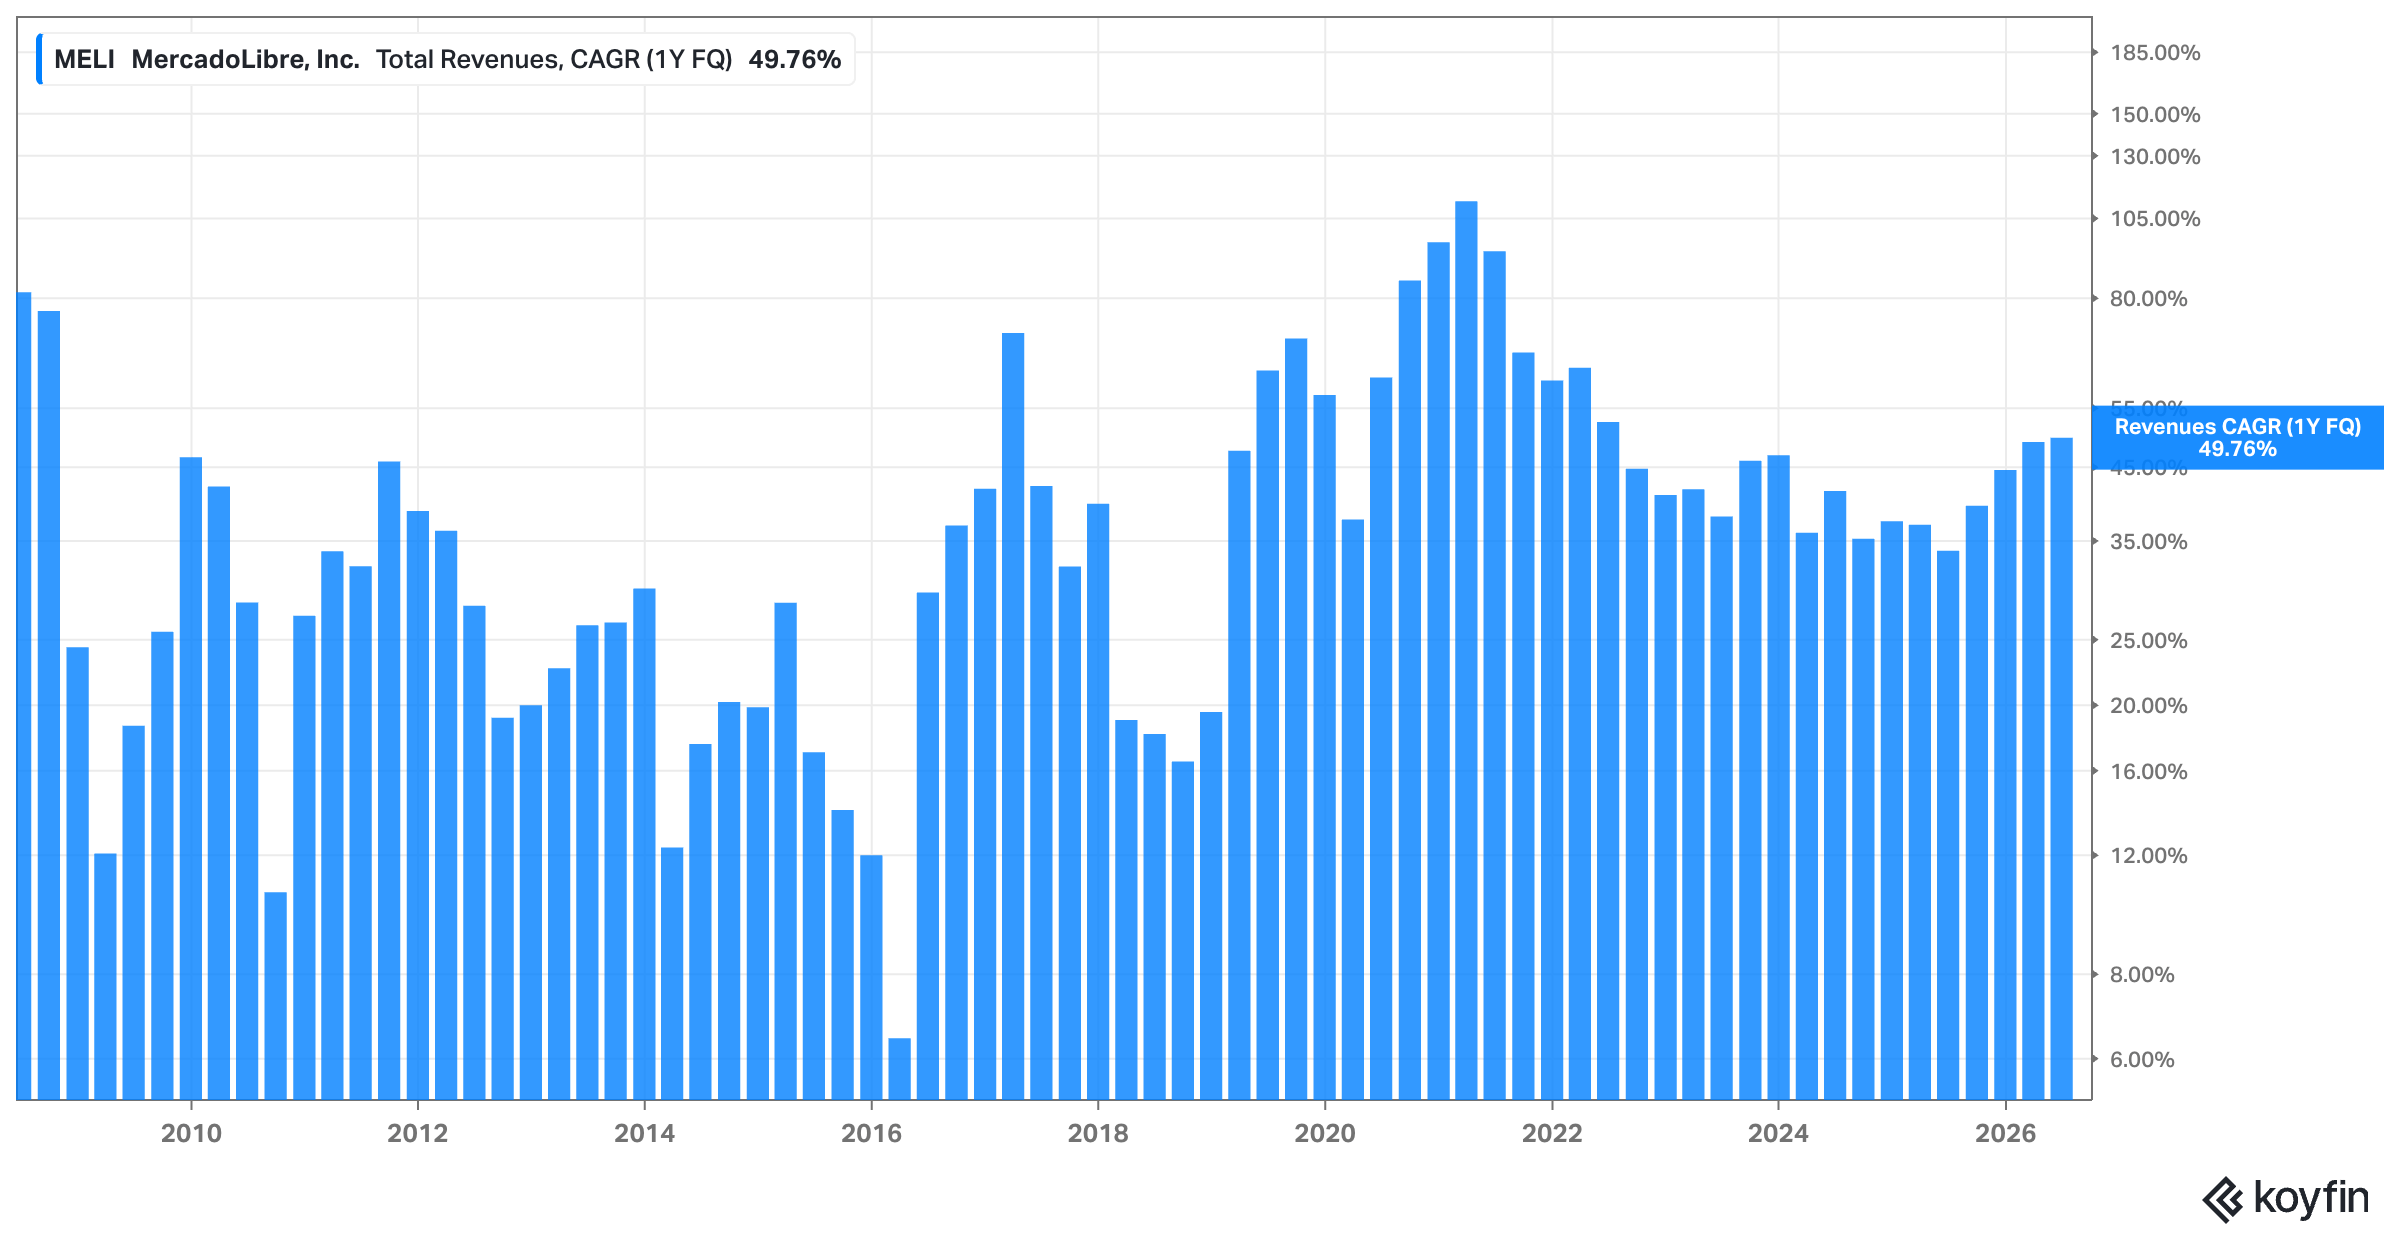
Importantly, Meli has now grown revenue more than 30% for 30 straight quarters (LTM YoY figures).
Thirty!
Look at this chart of beauty – UNFATHOMABLE!
That is an incredible rate of growth, and most people are unable to truly grasp what it means. So take a moment for a thought experiment. Compounding at 30% for 7.5 years, what is $1 of earnings power turned into if you compound at that rate for such a short period of time? The answer is $7.15.
So it’s not like Mercado Libre’s stock just went bananas for no reason. The stock crushed the market because the business crushed the averages and what base rates would suggest.
And the second quarter of 2026 was the fastest quarter in four years. Net revenue and financial income of $10.2 billion, up 50% year over year and 43% FX-neutral.
Let me repeat: 50%!
At an annualized revenue base north of $40 billion. The credit book grew 75% to $16.4 billion, advertising grew more than 70%, and cross-border GMV rose about 60%. Operating margin came in at 6.7%, down 550 basis points from a year ago, and that’s the line most people point at when they call the quarter “soft.”
When I bought Meli earlier this year, it traded at a market cap of about $80 billion. If you believe the company is intentionally under-earning by reinvesting back into the business and earns a 10% margin at steady state, you are paying a lower 20s multiple for a business still growing incredibly fast. In my deep dive, I wrote:
“Looking five to ten years out, operating margins could be materially higher than the depressed levels of 7–10% observed more recently. I would estimate that their current reinvestment posture is intentionally ‘under-earning’ by roughly 4–6 percentage points.”
So if you believe in higher steady-state margins, the starting multiple drops into the teens.
When I think about e-commerce and fintech in Latin America, one name keeps surfacing: Mercado Libre. Founded in 1999, it’s far more than just an online marketplace. Over the last two and a half decades, it has evolved into a fully integrated, infrastructure-heavy commerce ecosystem around logistics, fulfillment, payments, etc. – an indispensable hub where consumers and merchants converge.
Just Don’t Try to Be Brilliant! Hunting for Lost Decades?
But Mercado Libre should really not be the centerpiece of this post!
Rather, it is a perfect example to illustrate the broader concept I want to write about in today’s write-up.
So my friend, he’s hunting for stocks that have just experienced a lost decade. A few months ago I wrongly attributed this quote to Charlie Munger, which is in the same spirit:
“If all you ever did was buy high-quality stocks on the 200-week moving average, you would beat the S&P 500 by a large margin over time.”
After doing some more research, I couldn’t confirm Munger actually said that, but I think he’d underwrite the general spirit of it: Be crazy patient and bet in size when no-brainers present themselves.
So my friend, he tries to play games where the stock has done nothing for 10 to 15 years but has the potential to turn around and do well for the next 5 to 10.
It is not perfect by any means, but history shows those occurrences are much more common.
Charlie Munger said it best. Most people try to do amazingly brilliant things; Berkshire just avoids stupidity and does simple common-sense things, which essentially is buying very cheap (relative to intrinsic value) businesses.
Essentially, all of this is important because stocks are not businesses; they are only a proxy for a business. And stocks go through cycles, and their returns ebb and flow.
And the “ebbs” are far more common than most people assume. J.P. Morgan’s “The Agony and the Ecstasy” looked at every company that was ever a member of the Russell 3000 since 1980, roughly 13,000 names, and found that about 40% of them suffered what the authors call a catastrophic loss: a decline of 70% or more from the peak with no meaningful recovery afterward.
Two-thirds underperformed the index outright. For technology specifically, the catastrophic loss rate was closer to 60%.
So a decade of going nowhere isn’t an exotic tail event that happens to other people’s stocks.
Now clearly, you don’t want to hunt for stocks that never recover. So here’s an important distinction: A lost decade is first and foremost a symptom, and symptoms have different causes. It’s worth separating them, because only some of them are worth buying into.
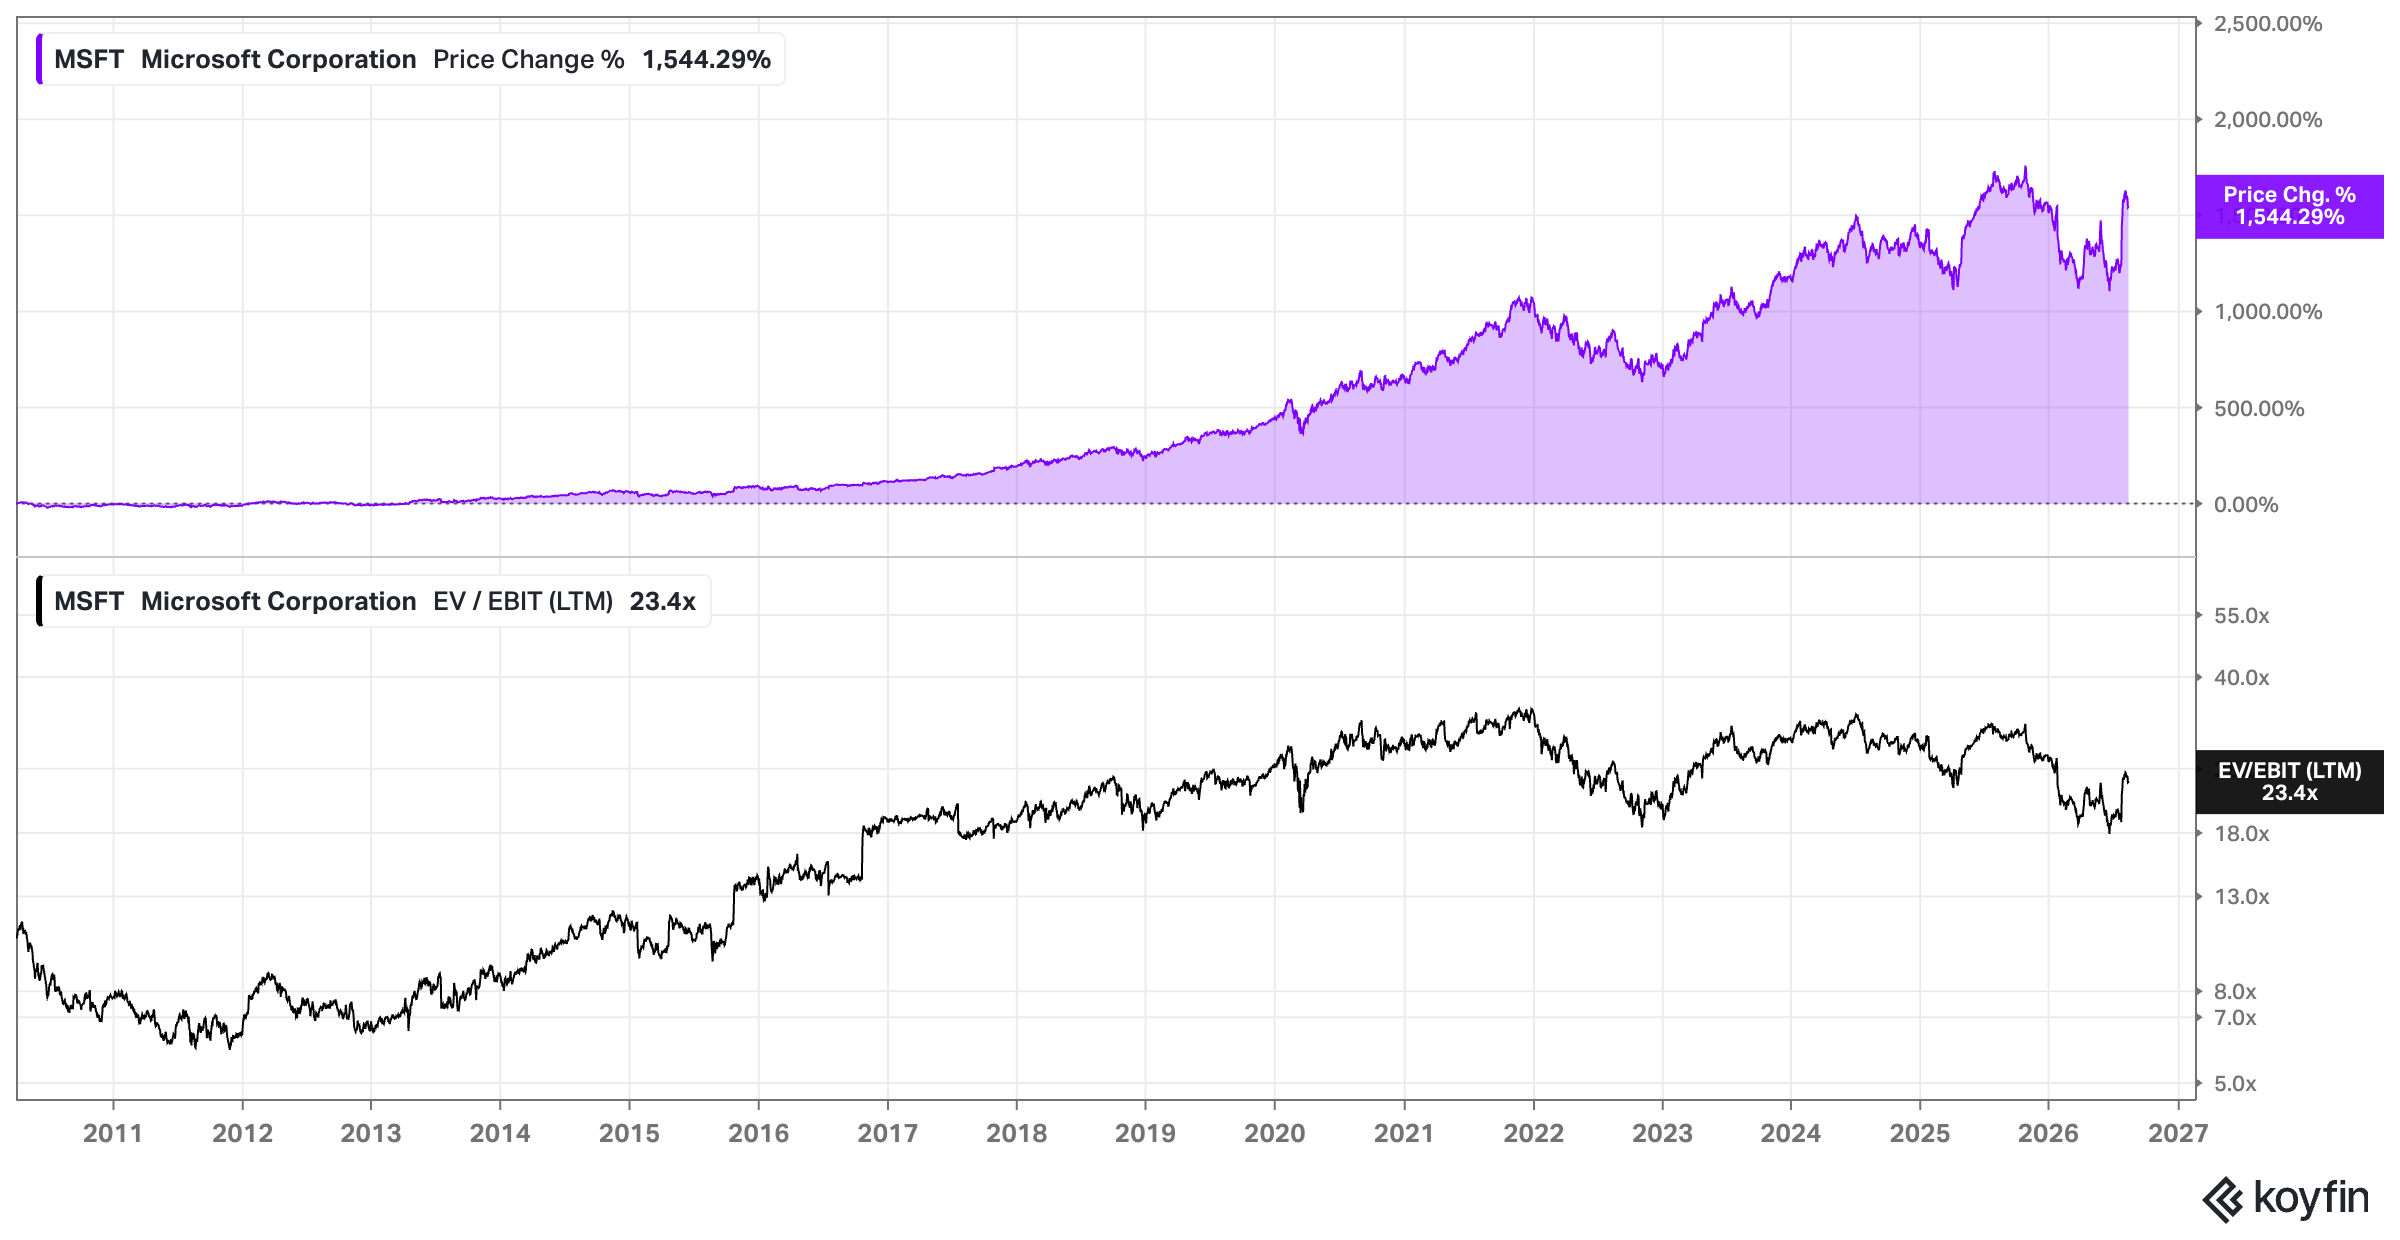
The first cause is that the starting multiple was absurd and the business was basically fine. Microsoft is maybe the most prominent example in the entire market. From 2000 to 2010 it grew earnings per share at 11.7% a year, roughly double the rate of the S&P 500, and the stock still went nowhere until 2013. Nothing broke. But the company started at close to 60 times earnings and then spent thirteen years growing into that number. Whoever bought in 2011 or 2012 at around 10 times earnings collected the entire re-rating on top of the growth in the subsequent years.
This is the version you want.
The second is that the underlying business gets genuinely damaged. Technological disruption, a moat that turns out to have depended on one particular distribution regime, commoditization of the product, or a management team that misallocates its way out of a strong position (Nike, wink wink).
The third is capital allocation at the corporate level, which almost nobody talks about in this context. A company can perform perfectly well at the operating line and still hand you a lost decade by buying back stock at peak multiples, overpaying for acquisitions with its own inflated paper, or running enough leverage that it is forced to issue equity at the bottom.
And running underneath all of them is sentiment, which is perfectly capable of being its own cause. Rate regimes reprice long-duration cash flows without asking anyone’s permission. Country and currency discounts get applied and removed for reasons that have nothing to do with the specific company you own. Regulatory overhangs sit on a multiple for years, and can disappear just as quickly as investors slowly forget about them.
Of course it can be a combination of several of these. But ideally, you want to look for stocks where the problem is temporary and solvable, or where uncertainty is elevated but bounded, and the sentiment has just turned completely sour.
Put differently, the multiple will get completely crushed, which in turn may enable you to earn an outsized return when the sentiment flips to the positive again. The software selloff in late 2025 and early 2026 might be a good recent sector example for this, and of course things like that happen in individual stocks all the time too (Adobe, Paycom, Novo Nordisk, Nike to name just a few off the top of my head).
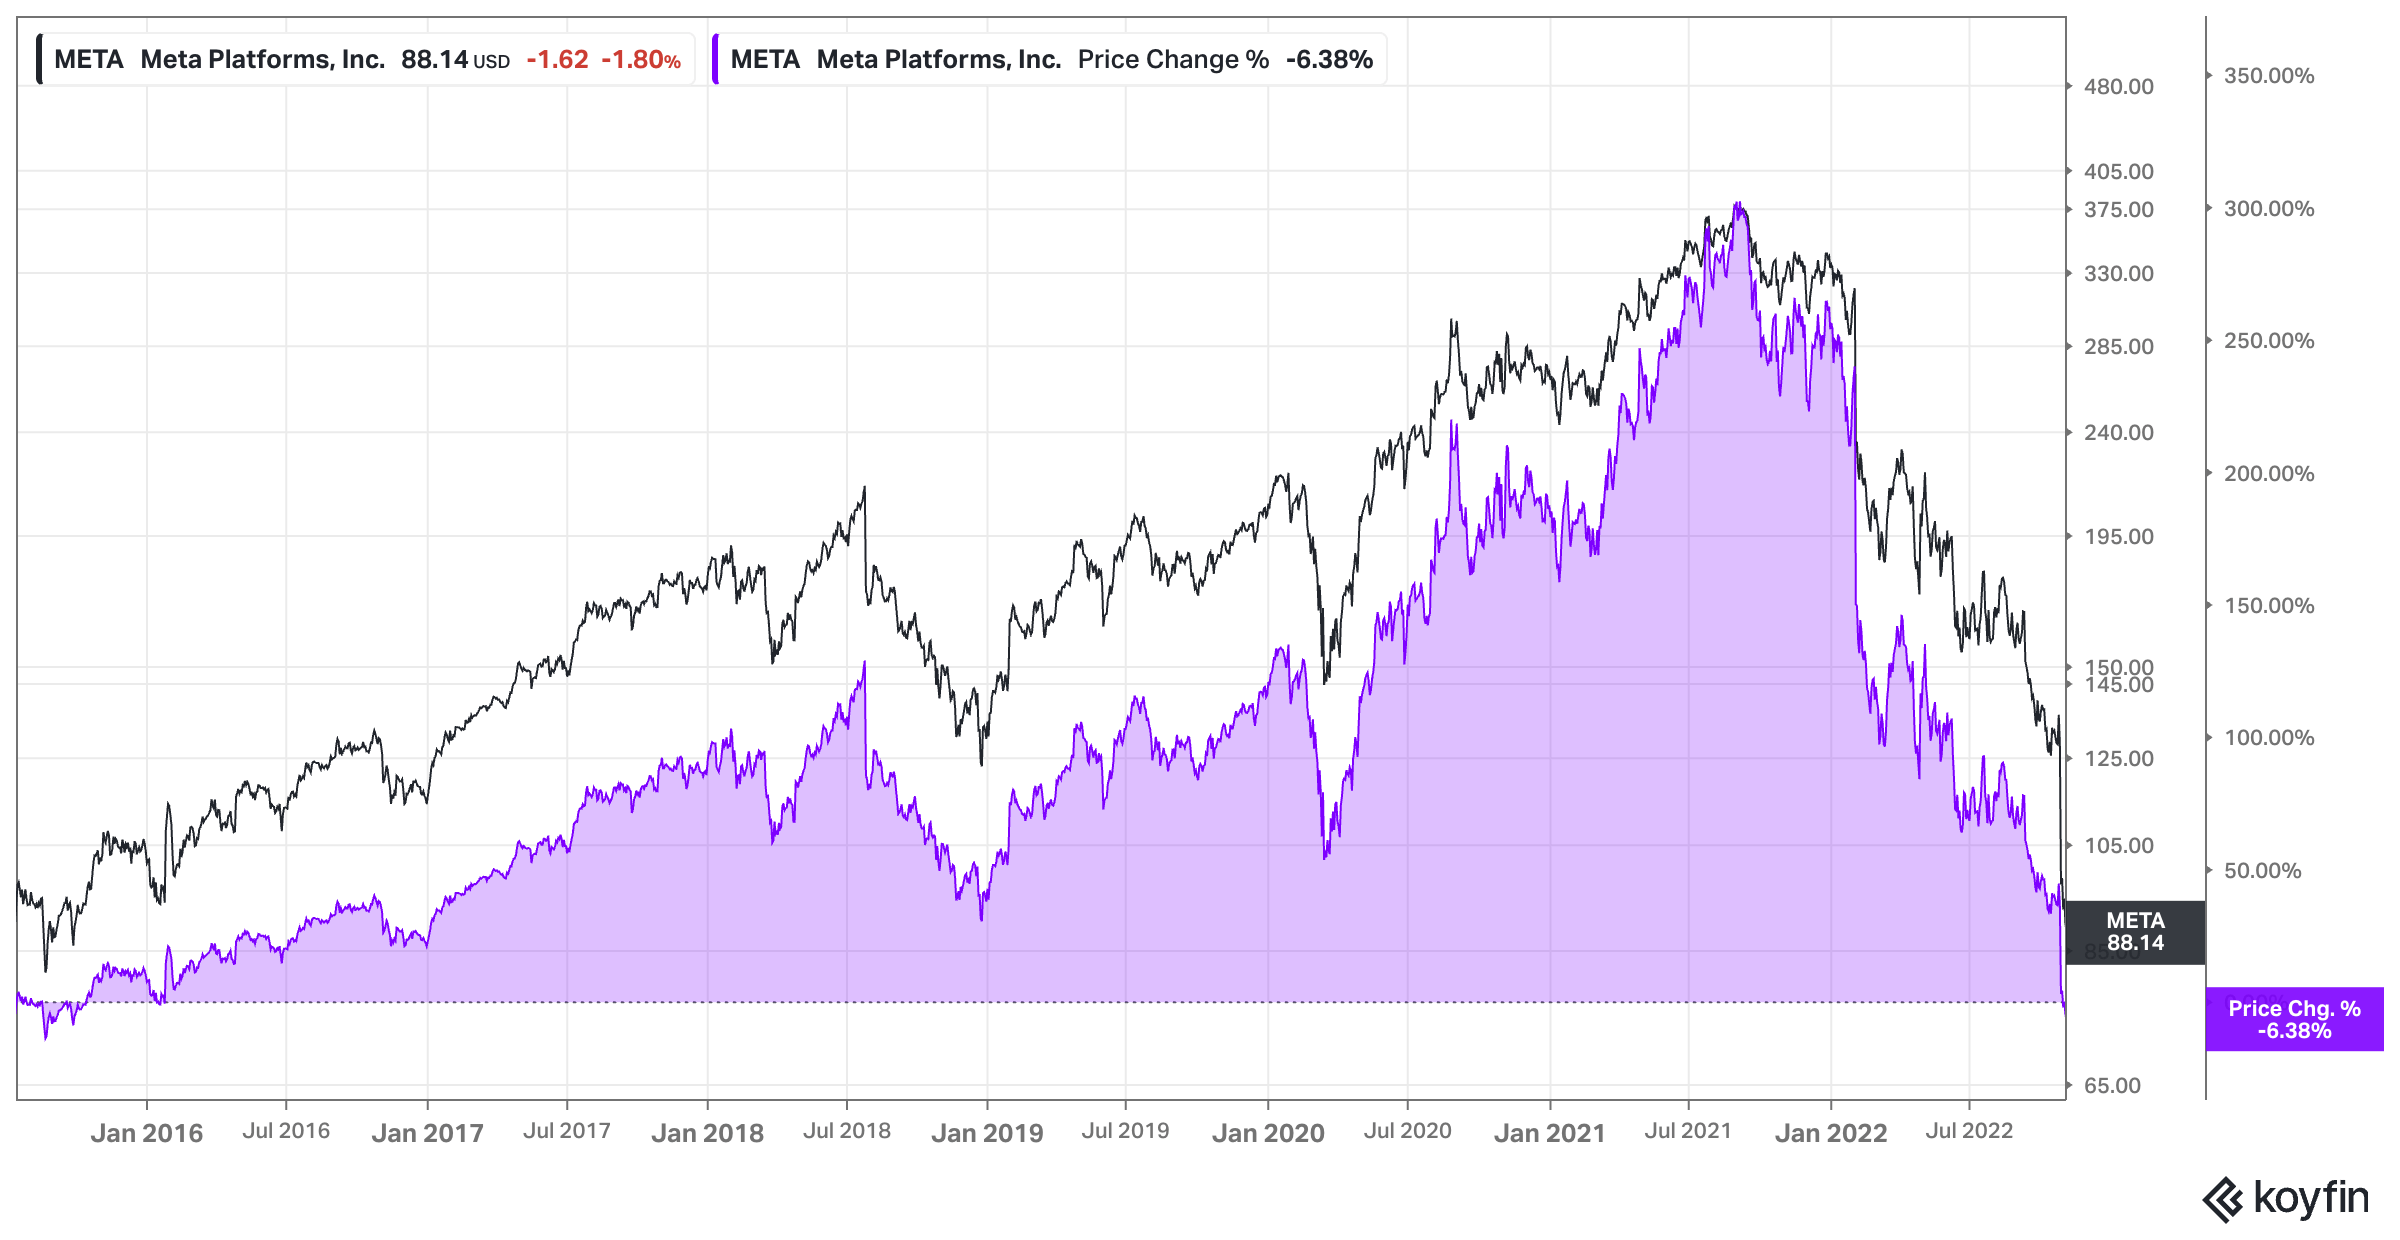
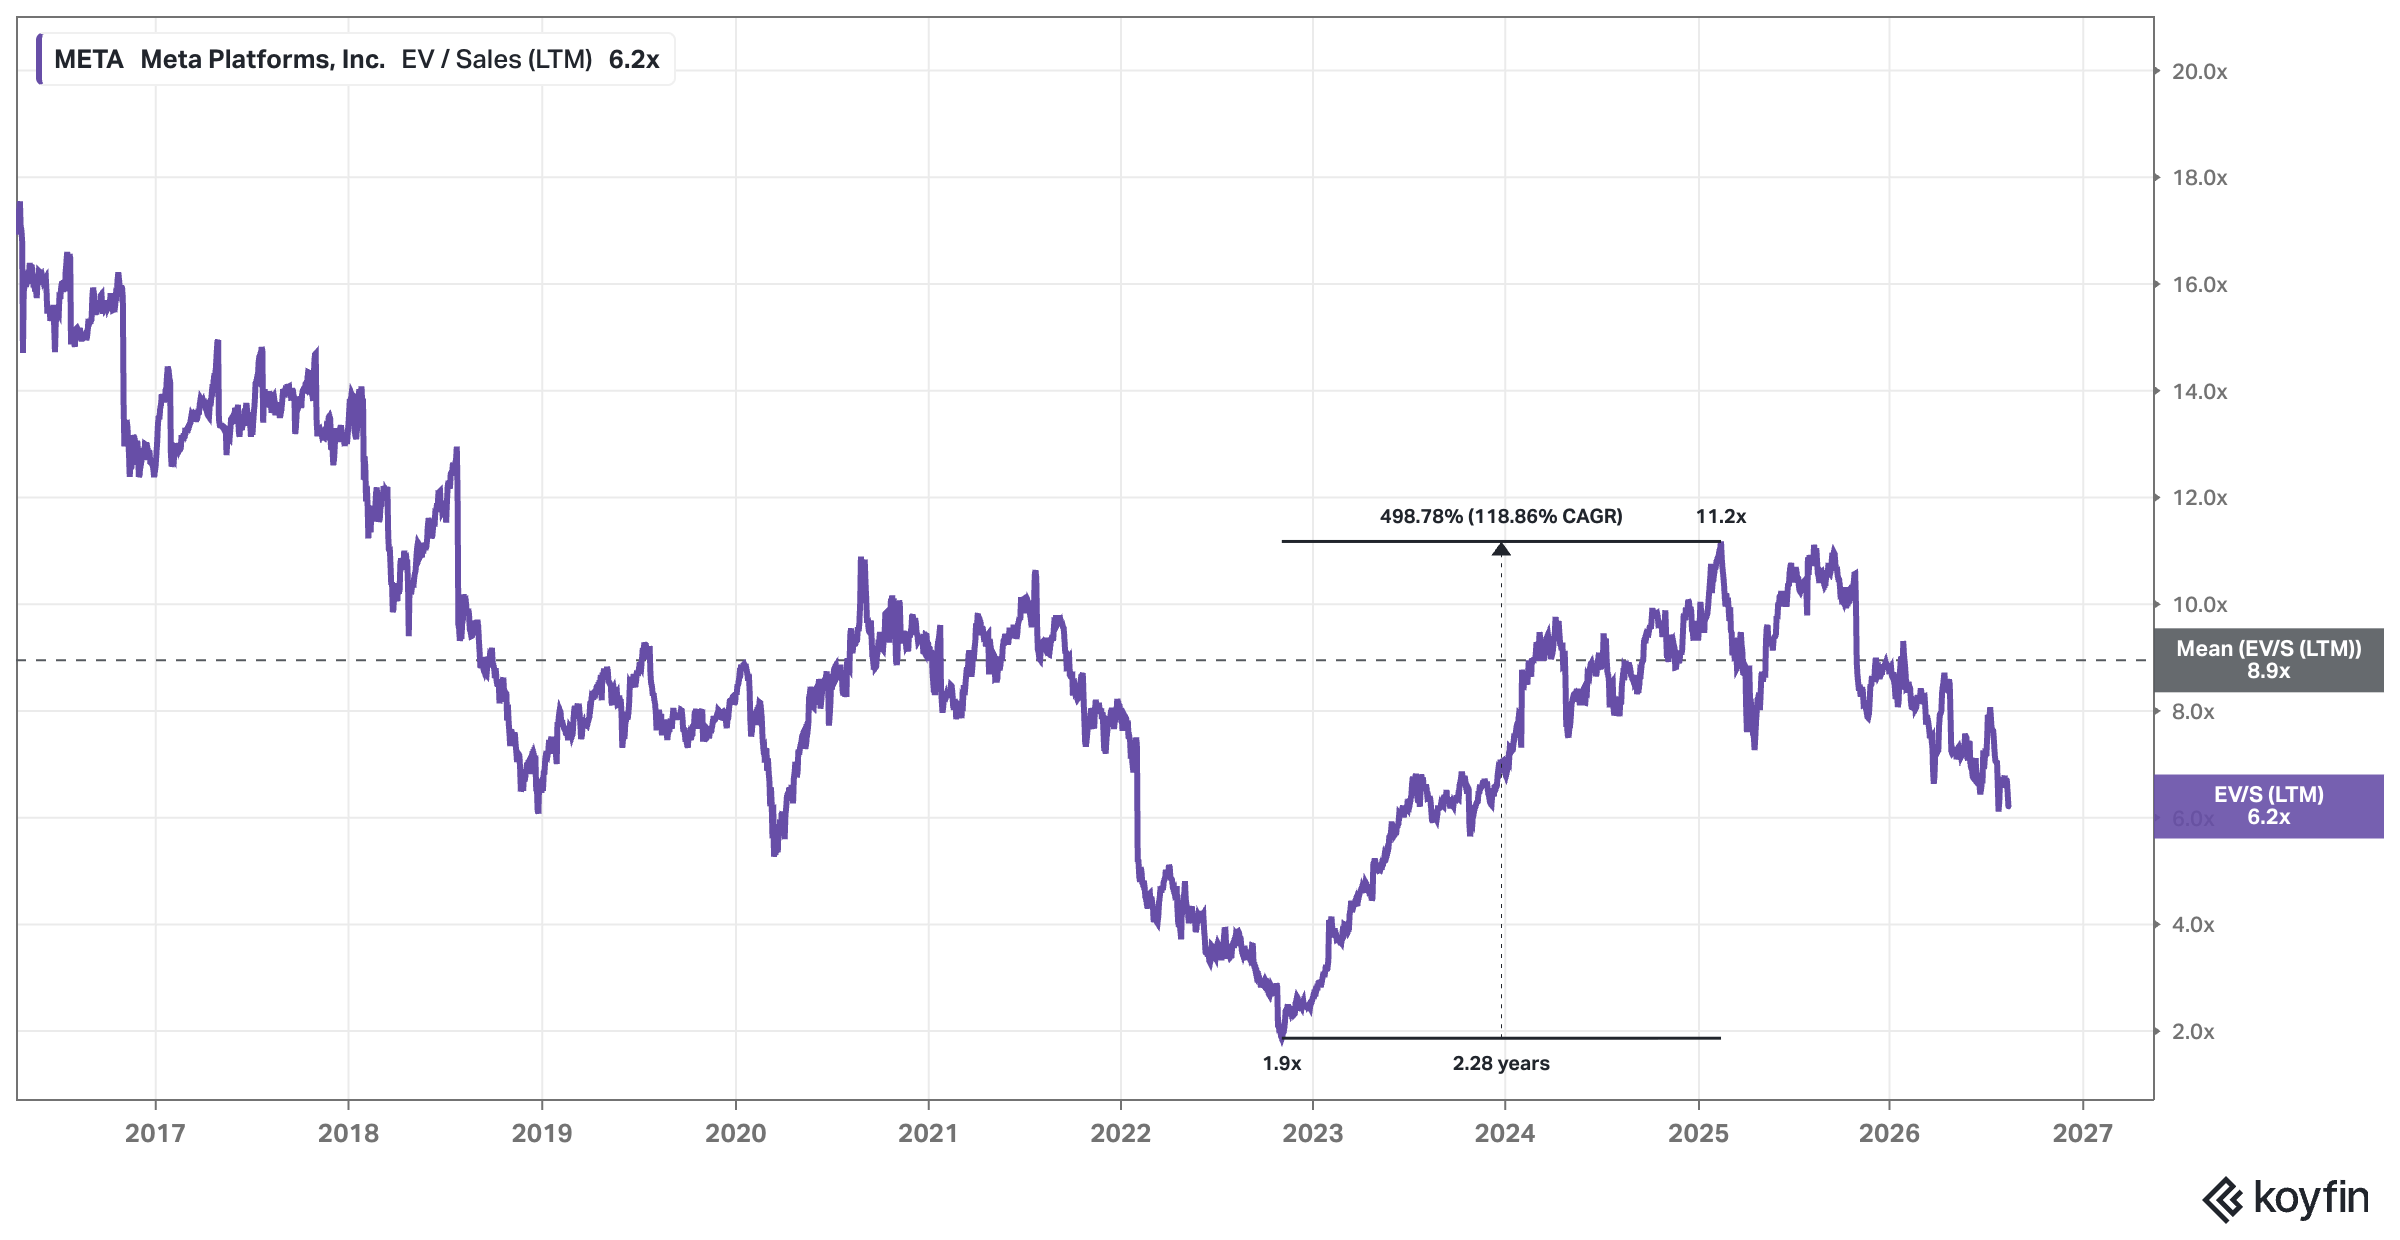
My best investment ever in absolute terms was my bet on Meta. Guess what … At the bottom, the stock had gone nowhere – zero price return – for more than 7 years. What a dud! ;-)
What followed was the sales multiple expanding from 1.9x at the bottom in late 2022 to more than 11x in 2025. Almost a 6x expansion over a little over two years, translating into close to a 120% CAGR.
That’s how you crush the market!
Before we move on:
You can read this article entirely for free. If you find value in this research, consider becoming a Premium Member for less than €1/day to support my work and unlock our full archive and join our growing circle of investors (I highly recommend checking out “The Library” to see what’s inside; you can find it right on the homepage).
Why join the community, you may ask? Our library is fast approaching 70 comprehensive deep dives, providing institutional-level research on some of the world’s most fascinating businesses. Most recently, we’ve dissected companies like Mercado Libre ($MELI),Grab Holdings ($GRAB), Fair Isaac ($FICO), and Topicus.com ($TOI).
As a member, you get:
Complete Access: Every deep dive in our library (65+ and counting). The most thorough analyses you will be able to get your hands on (including downloadable models).
Access to my 150+ Global Watchlist: And How To Use It to Outperform the Market!
Slide Decks: Every deep dive now comes with a companion slide deck. It’s the whole argument in compressed form – the hypothesis, the business, the competitive position, the valuation, and the case against – for the days when you don’t have an hour to spare but still want the shape of the thing. Paid subscribers get both, the long piece and the deck.
More Content: Company updates; AI tools I built (like my AI superforecaster); powerful valuation spreadsheets, frameworks, and processes; regular portfolio updates (insights into my investing decisions); market commentary; etc.
The WhatsApp Community: Real-time discussion and networking with like-minded investors.
Digital Investing Conferences: About three times a year, we also hold digital conferences where members present and share stock ideas, and discuss broader themes, and we’d love for you to join in!
Incredible Value: Full access to all of this for less than 1€/day.
Still not convinced? I received this lovely feedback just yesterday:
Why the Concept of “Lost Decade Stocks” Should Be Internalized
Look, I’m the biggest proponent of placing a lot of emphasis on business quality. It’s top of mind for me all the time. And when I appeared on the podcast of The Dutch Investors – (listen to it here) –, I was asked what quality actually means to me?
I could write multiple books on this, but at a very high level, what I said is
“predictable and durable above-average intrinsic value growth.”
And in the quality investing bubble specifically, people point out that changes in multiples don’t matter over the long term. One quote you frequently encounter then is again from Munger, who rightly and famously stated:
“If the business earns 6% on capital over 40 years and you hold it for that 40 years, you’re not going to make much different than a 6% return – even if you originally buy it at a huge discount.”
Yes, he is right. BUT (!) 40 years is a looong time. Almost nobody actually invests over 40 years. We invest over the 15 or 20 years in which we have capital to deploy, a career to fund the fun, and the stomach to hold.
And what you may overlook is how big of an impact multiples do have for a loooong period of time! (20 years plus) Let me just illustrate it for you:
If the multiple you buy the stock at expands by 50%,
... over five years, the CAGR contribution is 8.45%
... over ten years, the CAGR contribution is 4.14%
... over twenty years, the CAGR contribution is STILL more than 2%
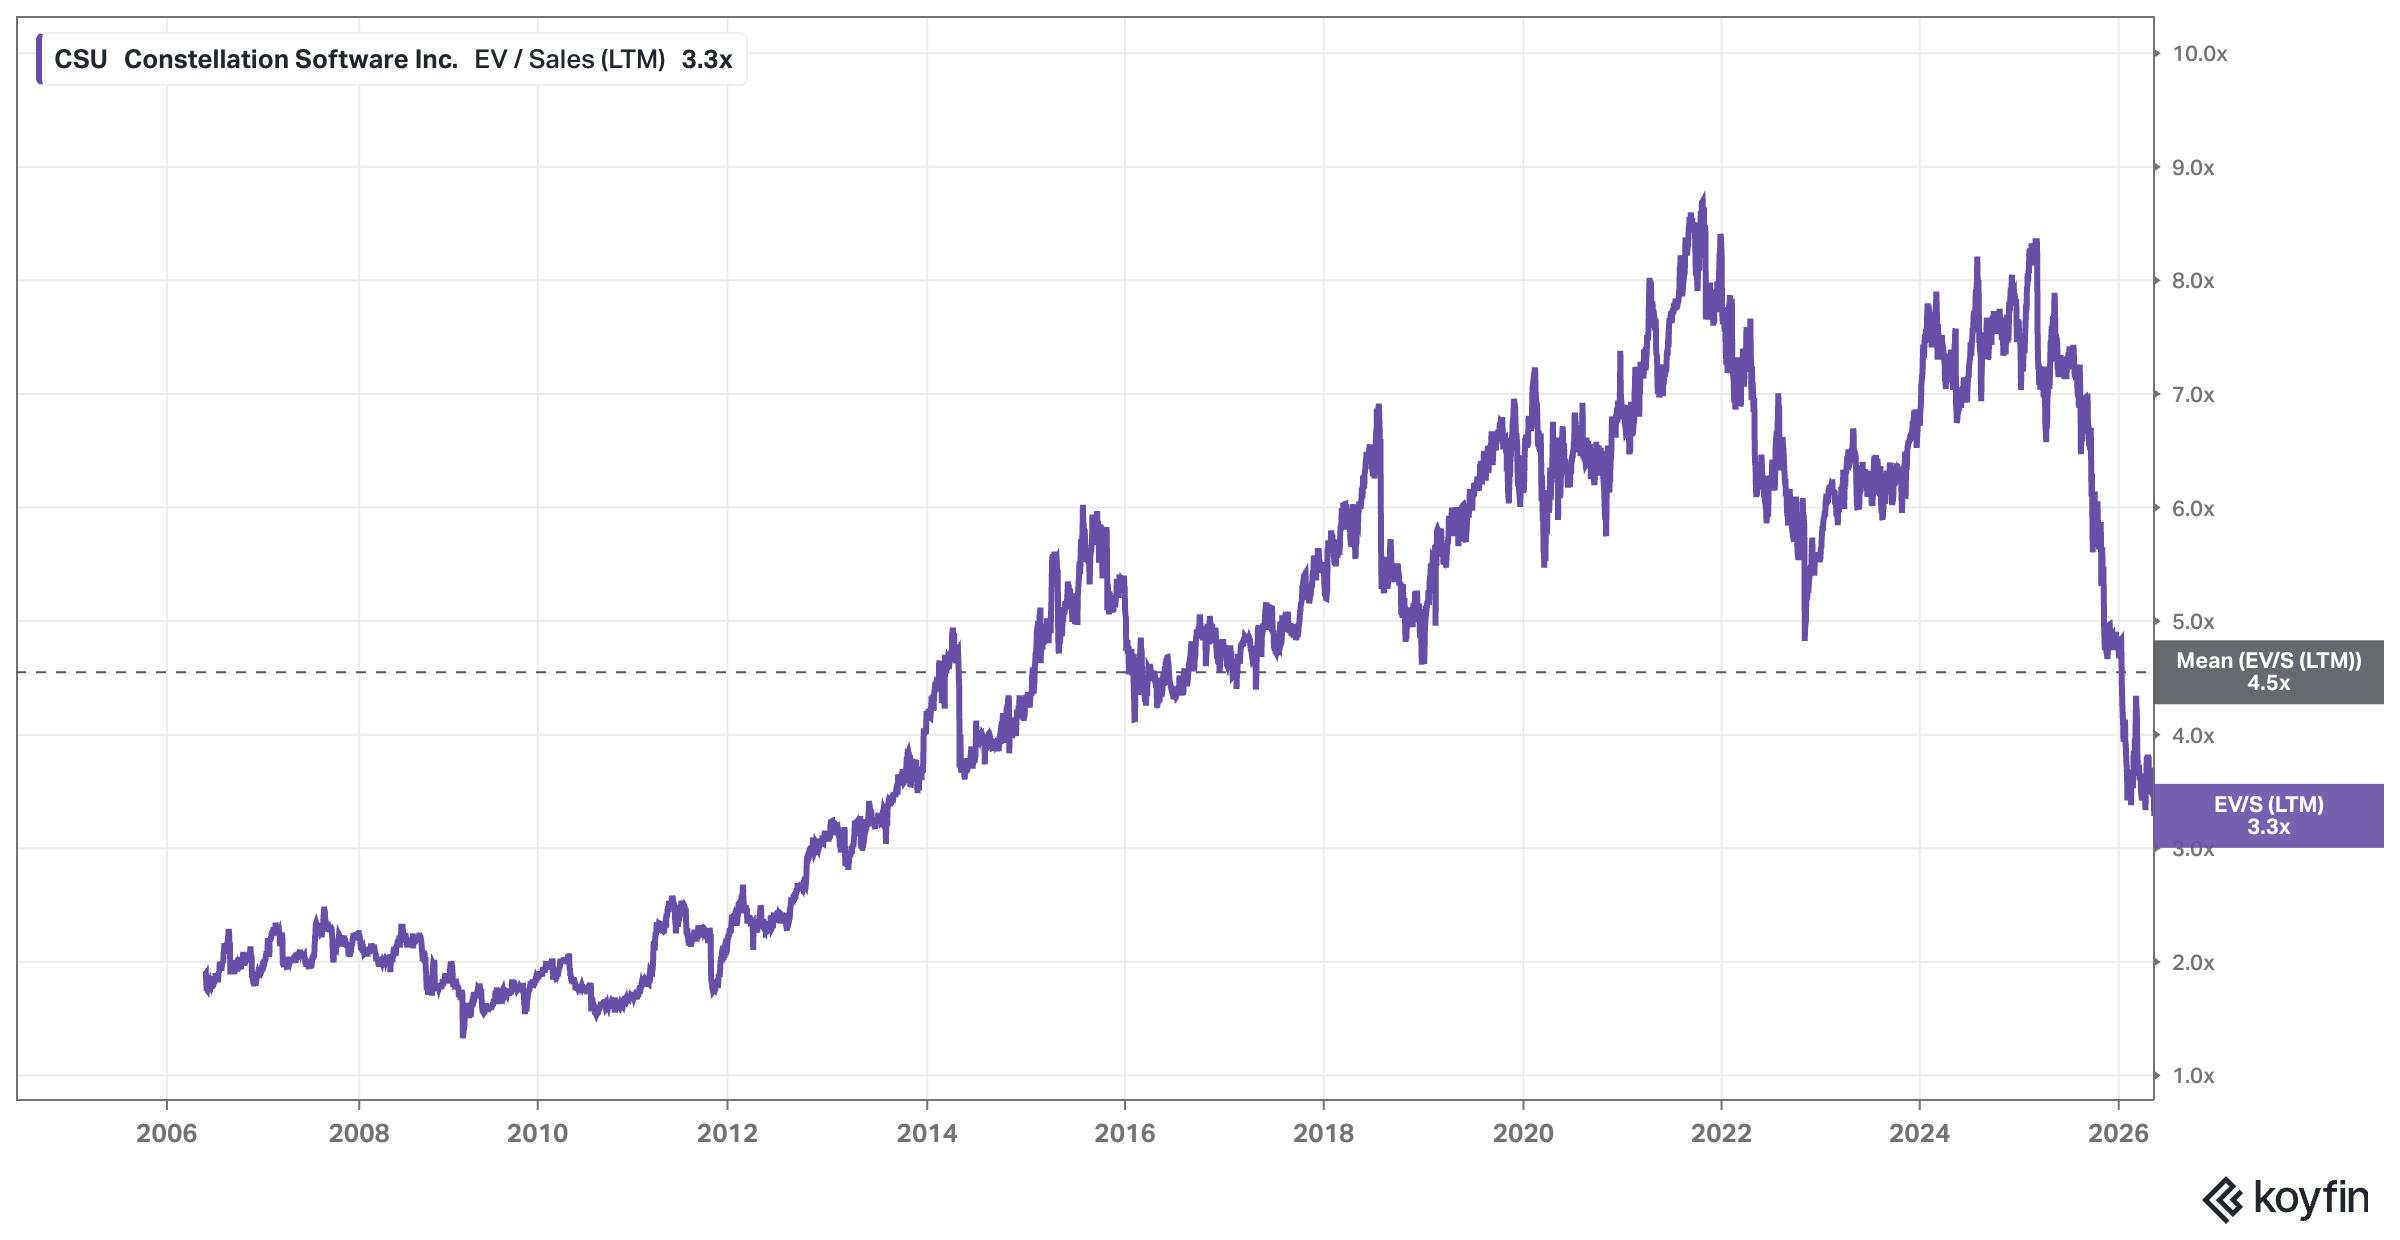
Let’s say you can find a stock where the multiple expands by threefold. If you buy cheap enough, that happens more than you think! It’s effectively a 5x earnings multiple stock expanding to a below-average multiple of 15x, or a 9x earnings multiple stock going to 27x. Constellation Software’s sales multiple went from below 2x (1.6x) to almost 9x (more than a 5x!).
If the multiple you buy the stock at expands by 200%,
... over five years, the CAGR contribution is 24.6% (!!!)
... over ten years, the CAGR contribution is 11.6% (that alone is a market-beating performance btw!)
... over twenty years, the CAGR contribution is STILL more than 5.65%
Two things are worth pulling out of those numbers before we move on.
Patience is required to get the re-rating, and patience is also what taxes it. The same 200% expansion is worth 24.6% a year over five years and 11.6% over ten, so half the annualized benefit evaporates simply by taking twice as long to arrive.
The second is that these are contributions, not returns. They stack on top of whatever the business itself does. A threefold re-rating over five years alongside a perfectly ordinary 15% earnings growth rate is a 43% CAGR.
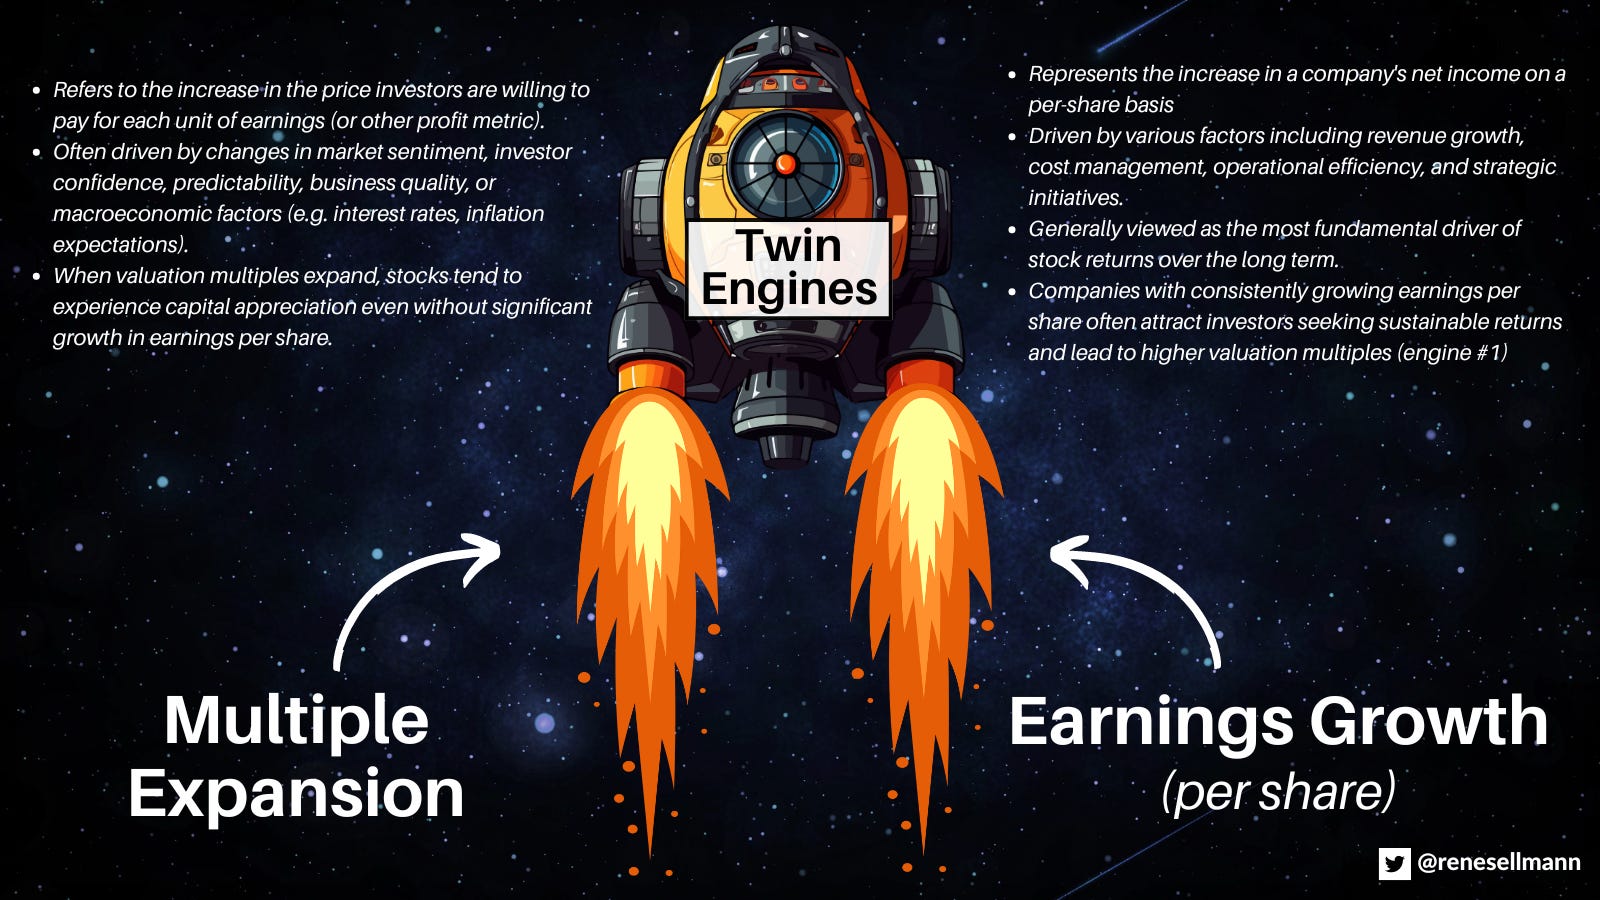
That’s what happens when the two engines – Chris Mayer’s concept of the twin engines – fire at once, and it’s the entire reason I care about entry multiples despite spending most of my time thinking about underlying business quality.
So if you want to consistently beat the market and not wait until you’re 90 to get rich, you really have to buy reasonably cheap (or even better: dirt cheap!) or earnings have to grow damn fast for a sustainable period of time (like Meli did, but that’s less reliable to get right than just buying a pretty damn cheap stock).
And importantly, all of this works in the opposite direction too! So if you pay too high a price, the business can grow and grow and grow, compound at 15% for a decade, but if the multiple gets cut in half, you still end up underperforming the market.
Also, while all of this sounds so easy in theory, chances are you will not perfectly time the bottom (and you might have to sit through a further 20-30% drawdown, or more), and/or it takes two years for the momentum to swing. Thus, in practice, this can be really hard.
In theory, theory and practice are the same. In practice, they are not.
Why I’m Adjusting the “Lost Decade” Concept Regardless …
Here’s the problem, and the required adjustment I have to make based on my investing style.
Earlier I said quality can be defined as predictable and durable above-average intrinsic value growth. I have a very strong preference for companies growing intrinsic value at very high rates (ideally somewhere in the range of 15-25%).
That’s by the way why I concluded the following in my Amadeus IT Group deep dive, for instance:
“There’s one more reason, and it’s a matter of personal preference rather than a knock on the company. My bias runs strongly toward high-growth businesses with high returns on incremental capital paired with high reinvestment rates, the compounders that plow earnings back into the machine and grow intrinsic value at a brisk clip. Amadeus doesn’t quite fit that mold. It distributes a large share of its earnings through dividends and buybacks, which is entirely rational for a business at its stage, and the flip side of that generosity is that it reinvests less and therefore compounds intrinsic value more slowly than the profile I gravitate toward. That’s not a flaw in Amadeus. It’s a mismatch with my particular appetite, and I’d rather be clear about which is which.”
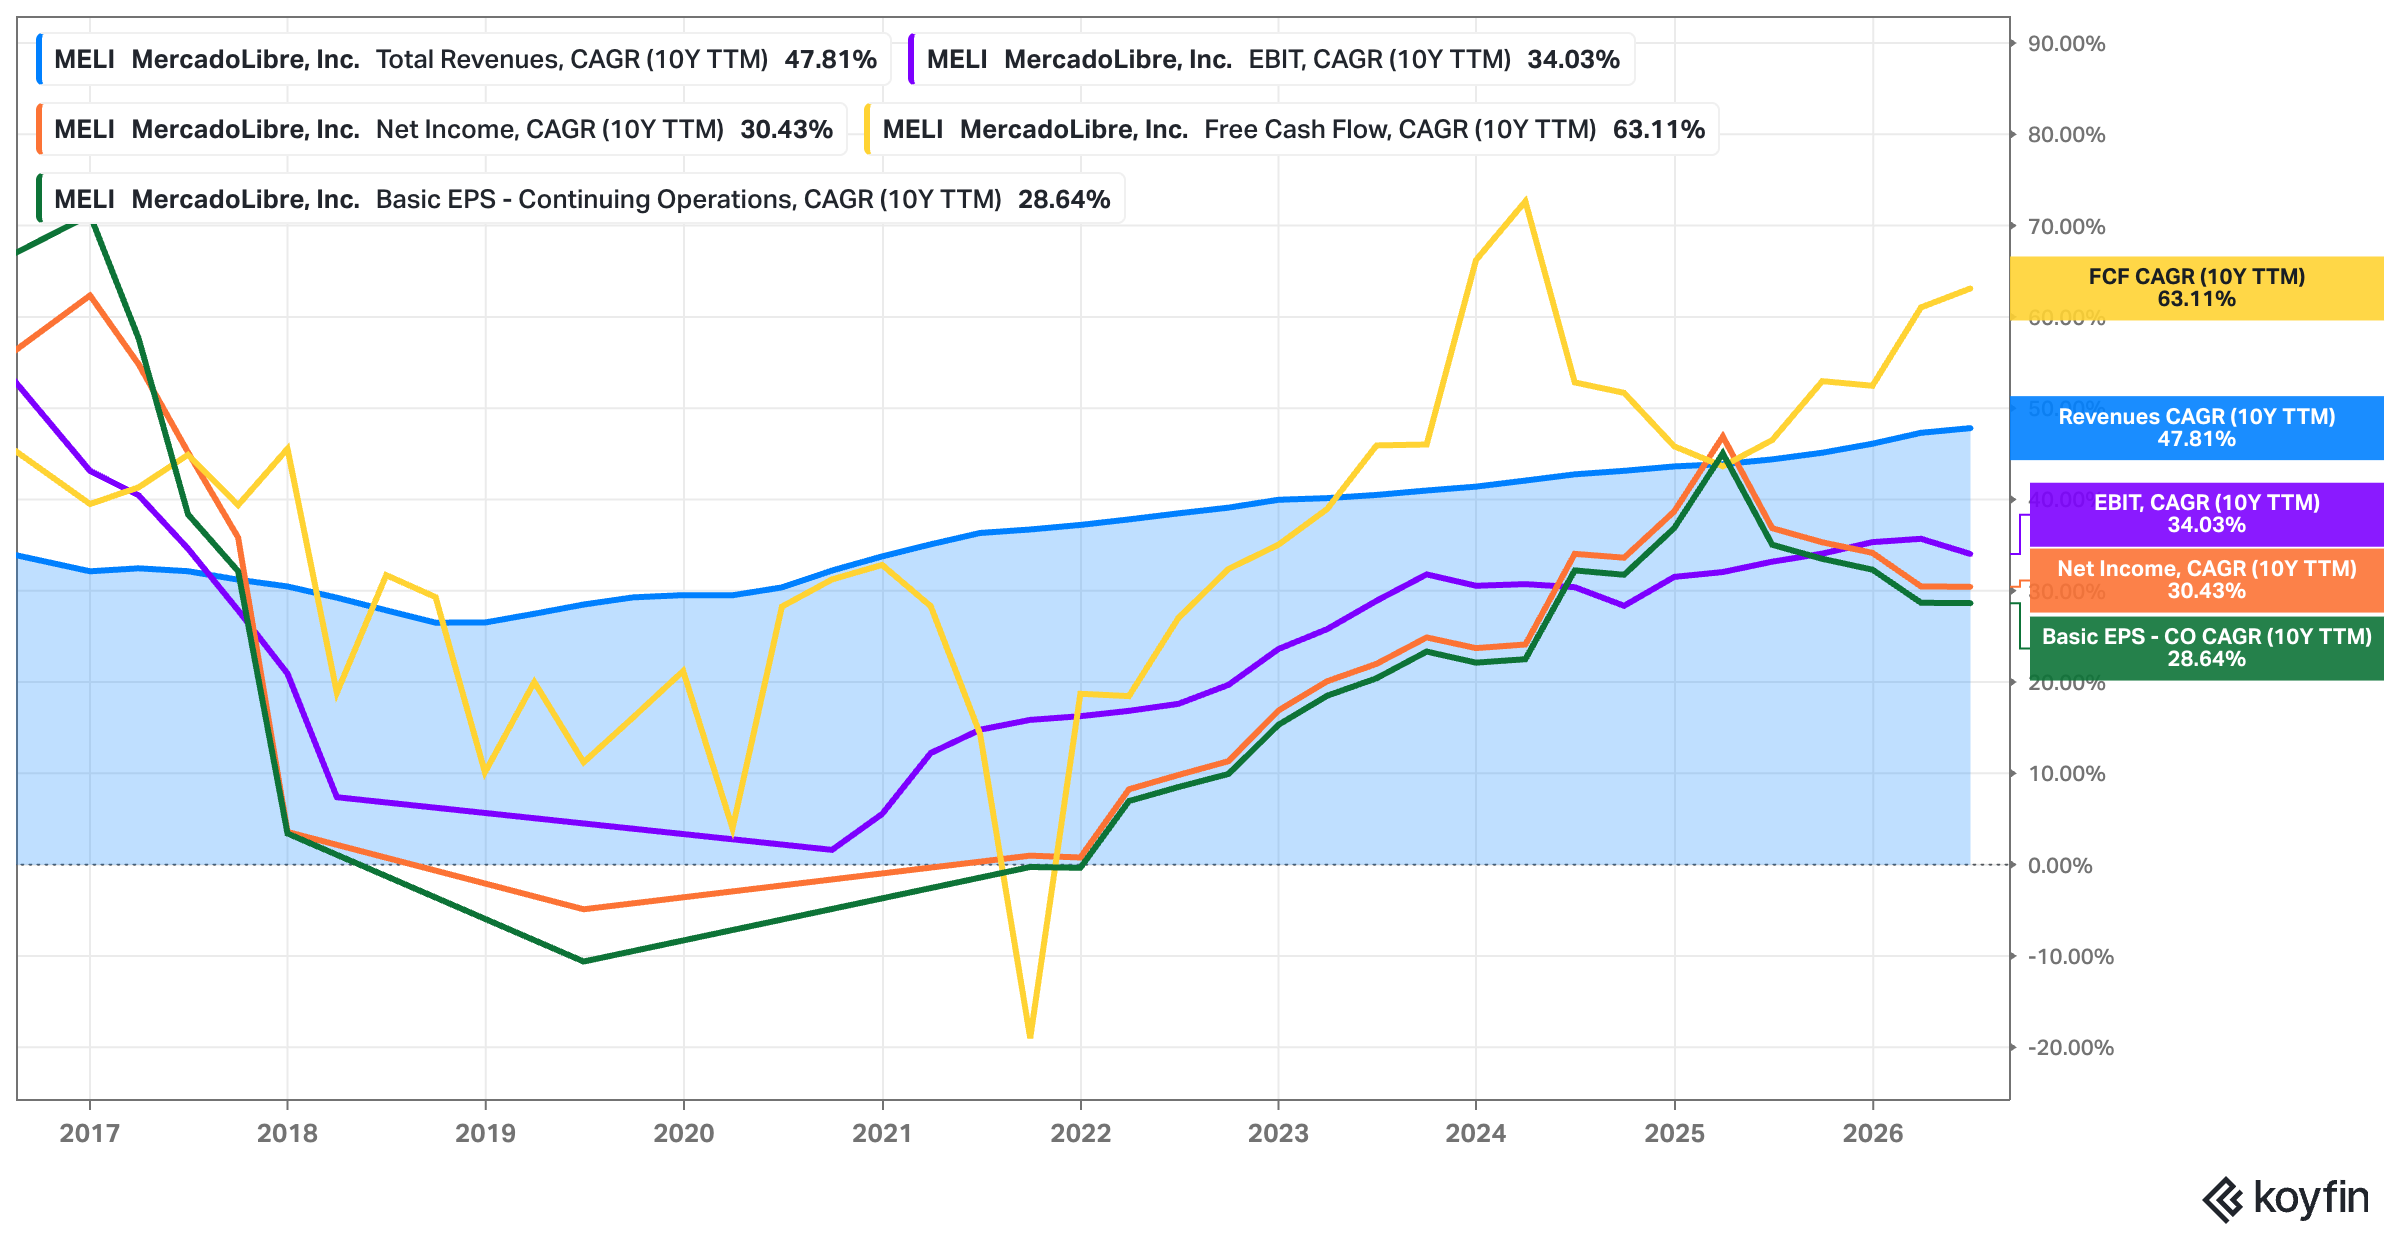
So let’s circle back to Mercado Libre because it helps to illustrate my point. Over the last ten years, Mercado Libre compounded topline by 47% annually. FCF compounded at 63% annually. And EPS compounded at 28.6%.
OVER ten years!
If the underlying business grows so rapidly, let me show you what kind of multiple these stocks would need to trade at to experience a lost decade.
The arithmetic fits on a napkin. For a stock to be flat over ten years, the exit multiple has to equal the starting multiple divided by (1 + g) raised to the tenth. That’s the whole formula. Growth sits in the denominator and it compounds against the multiple every single year.
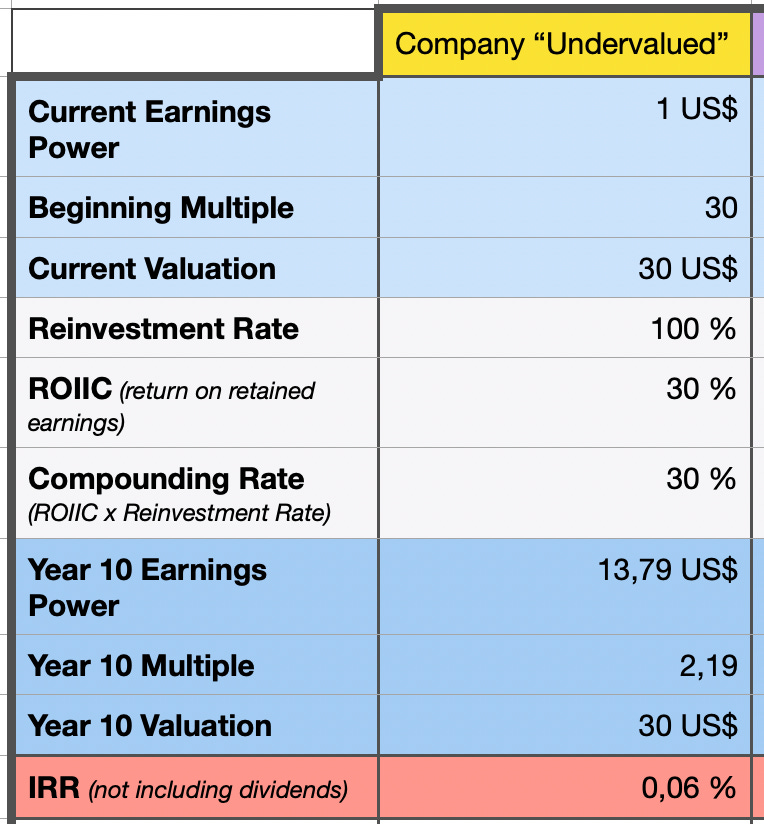
Let’s say the starting multiple was 30x and the underlying earnings compounded at 30% over ten years. What kind of multiple would the stock need to trade at in year ten to be flat over ten years?
Take your time to come up with an answer in your head before you scroll further.
.
.
.
The answer: around 2.2x.
That is never going to happen. Sure, they say “never say never.” And stocks can trade at absolutely stupid prices, but a business that just grew its earnings engine at 30% over ten years IS NOT going to trade at 2.2x earnings.
It is not going to happen!
Now you might argue that 30% growth is an absolute outlier, an exception, something base rates suggest should happen in maybe 0.1% of cases if you start from a small base.
Fair!
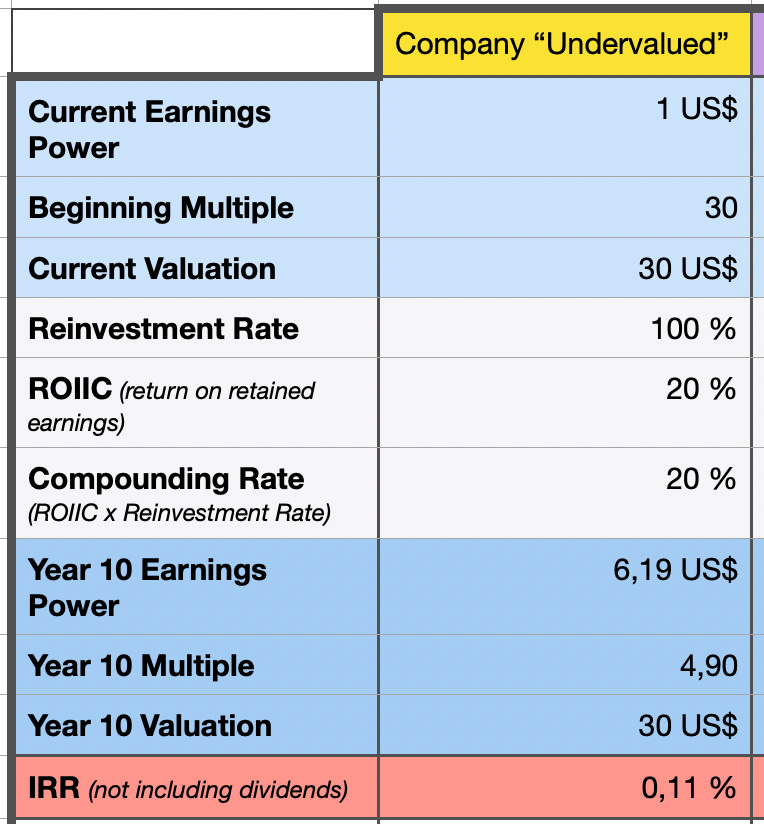
Let’s do 20% compounded earnings growth over ten years. Starting from a 30x earnings multiple base. What kind of multiple would the stock need in year ten to be flat?
Again, take your time to come up with a number in your head.
.
.
.
Answer: roughly 4.9x.
But again, you may point to base rates. Mauboussin’s work is the relevant research to cite here. When he tested Elon Musk’s claim that Tesla could grow sales 50% a year for a decade, he went to the reference class of companies with a sales base between $6 and $13 billion and counted how many had ever sustained 45% or better sales growth for ten years. The answer was none. Zero. Zero out of the entire sample. Widen the lens and roughly 1% of US-listed companies have posted a ten-year revenue CAGR above 20%. So the arithmetic that protects a fast grower from a lost decade only protects it if the growth genuinely shows up for ten years, and the base rate for that is brutal. My friend and I are both right, in a sense. He is right that sustained extreme growth is vanishingly rare. I am right that where it does occur, the lost decade is mathematically often off the table. The interesting question is what happens in the space between those two claims.
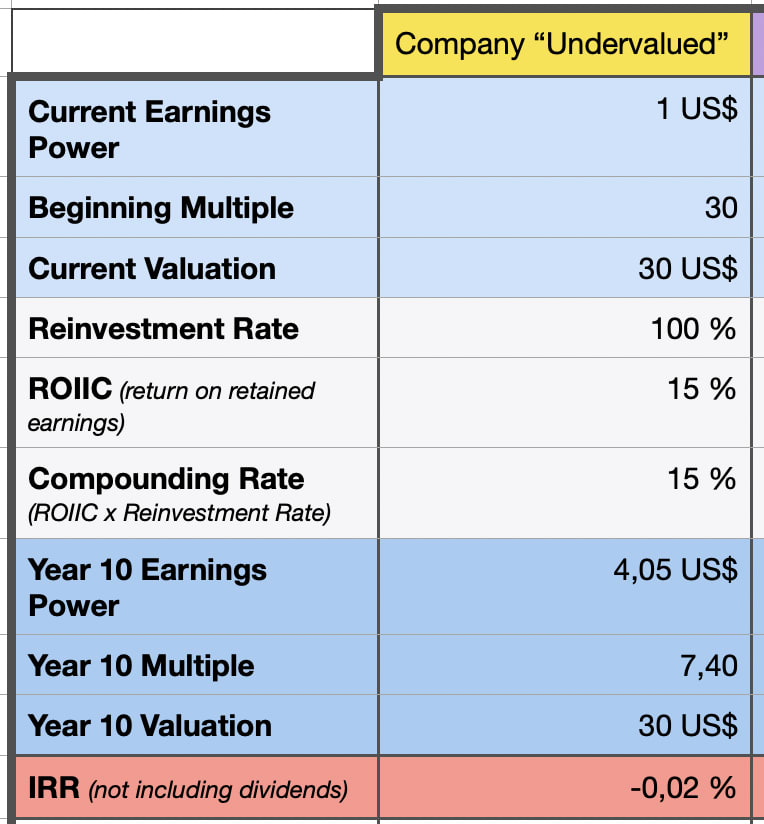
So what about 15% compounded growth?
About 7.4x.
And even at a thoroughly pedestrian 10%, you would need 30x to become 11.6x, which is possible, but it already requires the market to price a steadily growing business as a melting ice cube for a decade straight.
You see what I’m getting at?
The lost decade is a phenomenon of slow compounders and/or deranged starting valuations. It needs the growth to stop, or the entry multiple to have been genuinely insane.
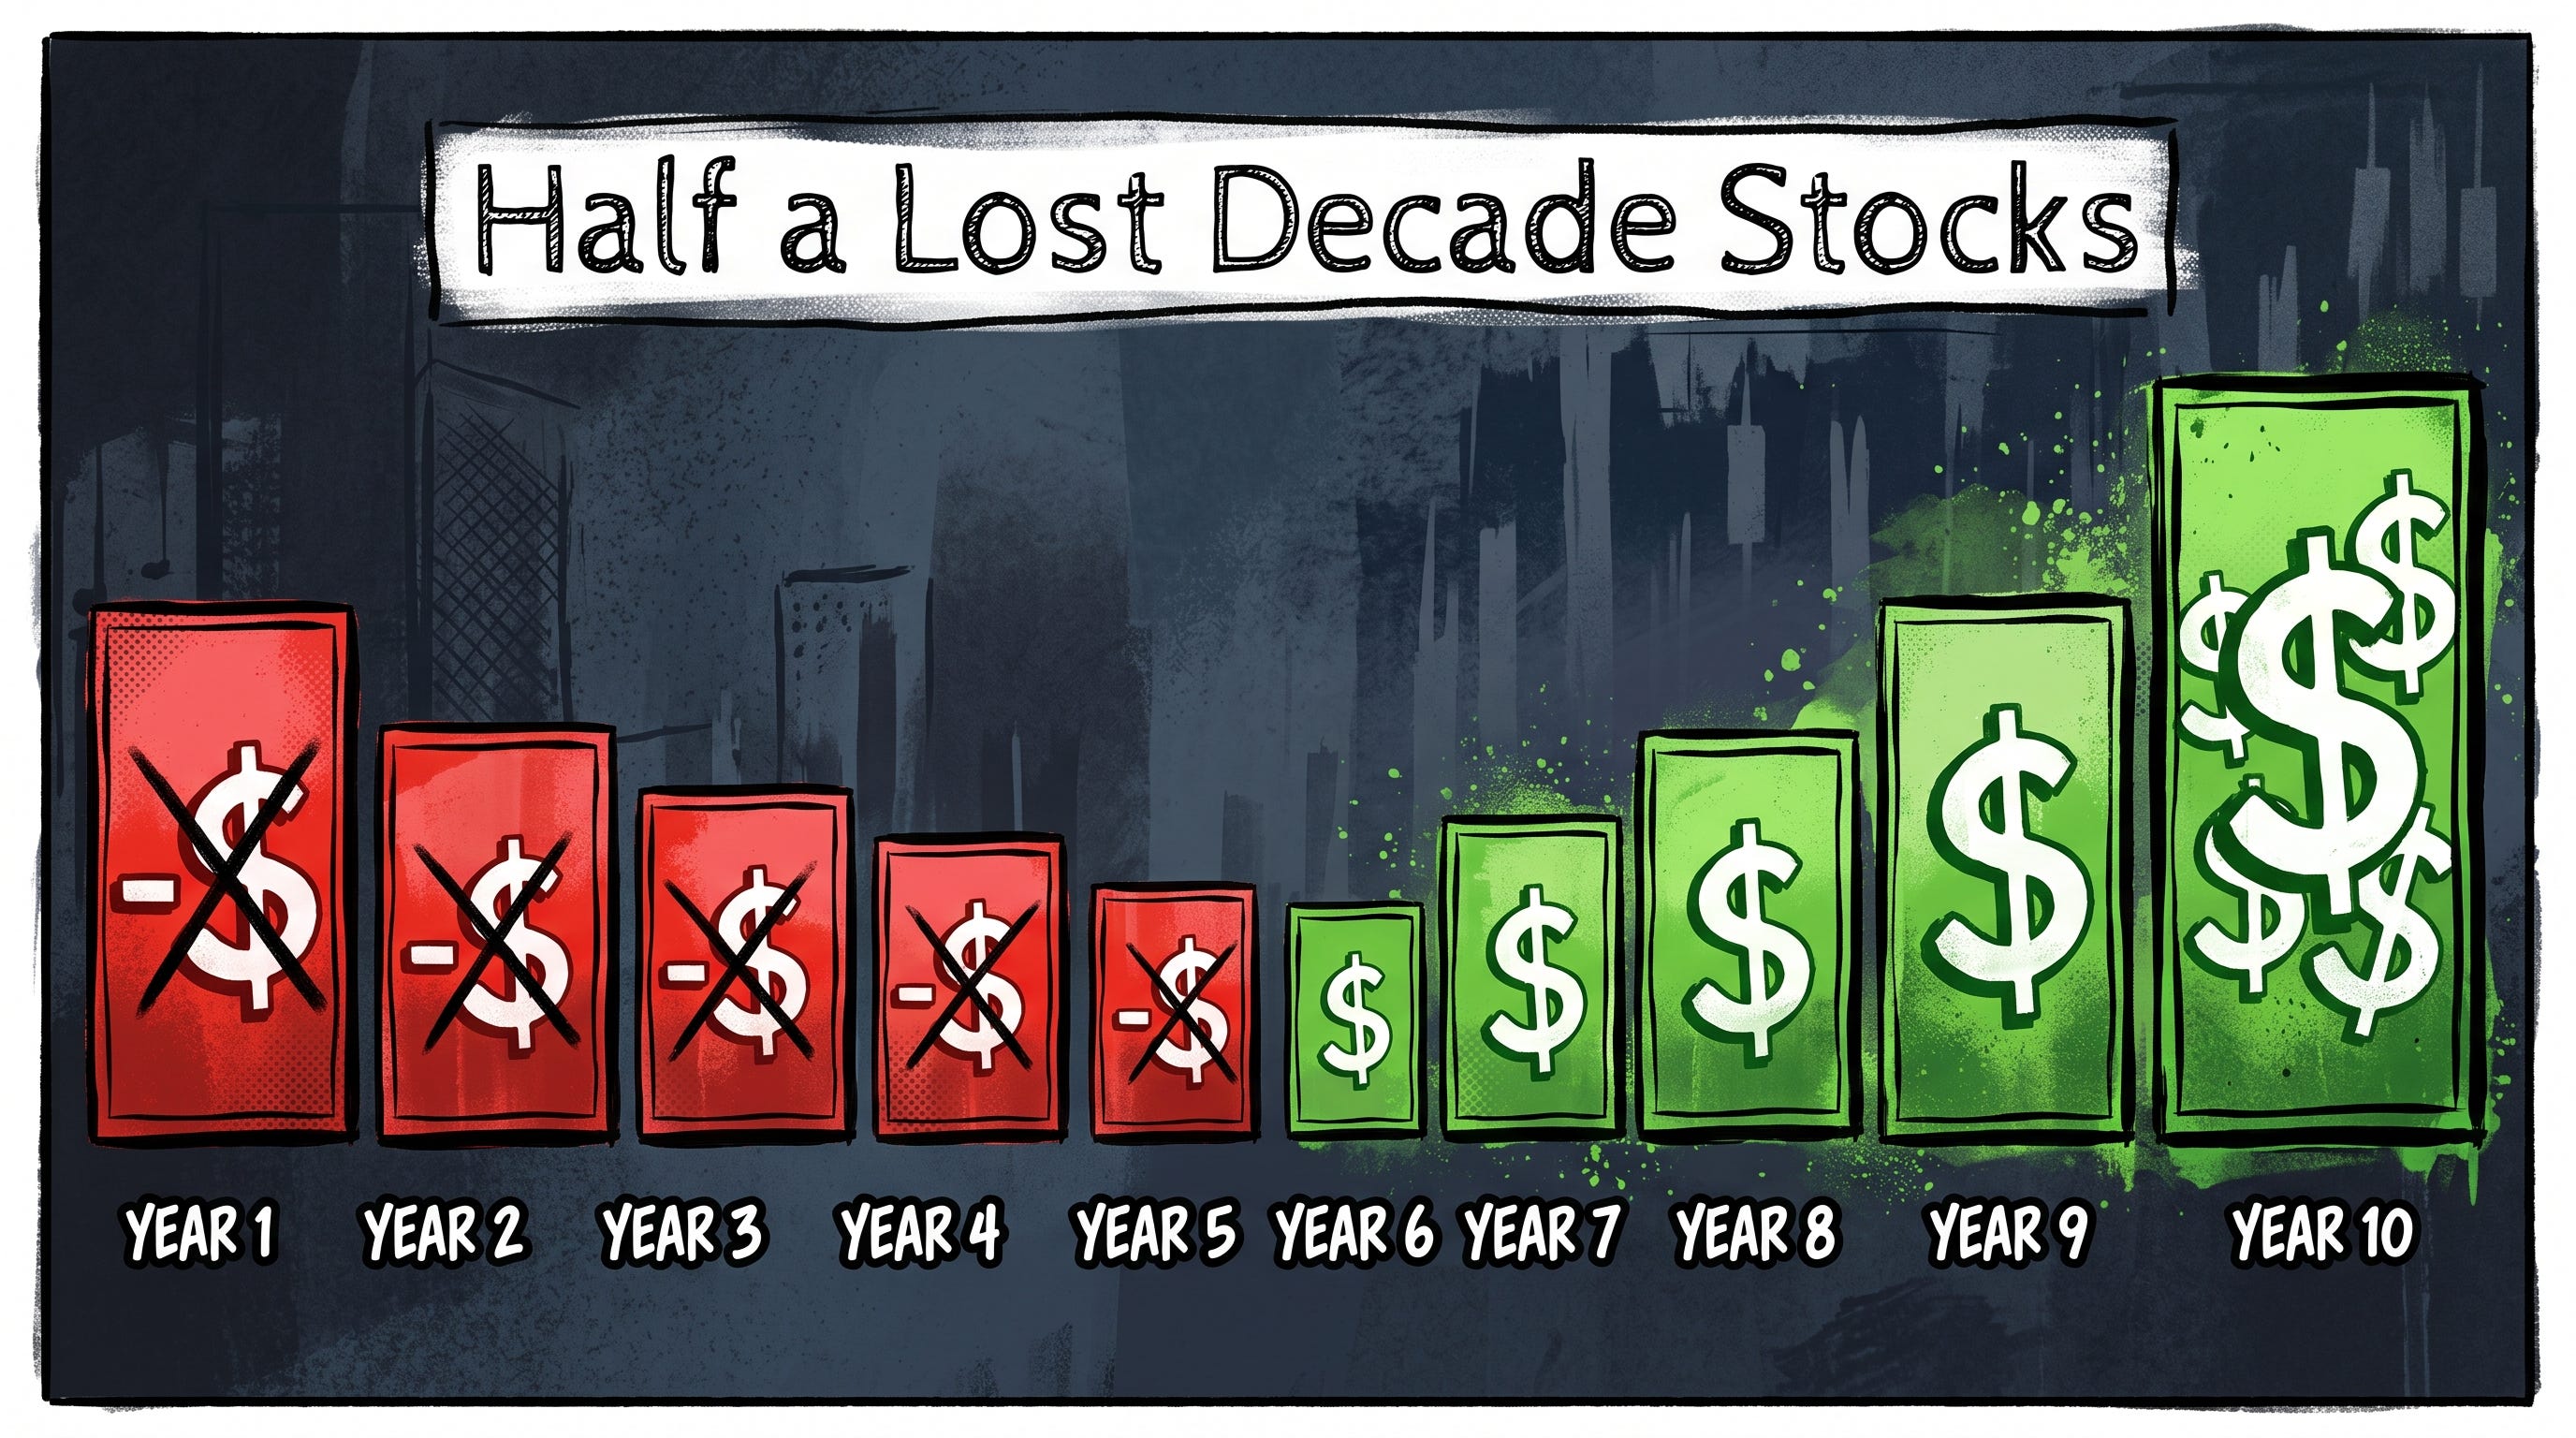
That’s why my twist to the concept is to look for “half a lost decade” stocks. If the underlying earnings growth is rapid, a flat 5-year stock performance may also signal that the sentiment is completely bombed out.
And if you think about it, five years of flat returns is a long time.
Run the same napkin math over five years instead of ten, and a lot changes. Starting from 30x, here is the exit multiple a stock would need in order to be flat over five years:
... at 15% earnings growth, 14.9x
... at 20% earnings growth, 12.1x
... at 25% earnings growth, 9.8x
... at 30% earnings growth, 8.1x
Look at that list again, because this is the crux of the entire post.
Every one of those numbers is a multiple that is more likely to occur in the real world. Still rare. But it happens. 12x for a business compounding at 20%. Under 10x for one compounding at 25%.
When Meta bottomed, I think the stock traded at something ridiculous like 5-6x 2-year-forward operating income.
So while these setups are rare, these aren’t fantasy valuations that would require the market to lose its mind for a decade. They are what you see in a bad tape, in a de-rated sector, in an unloved geography, after two disappointing guides in a row. And if you have 150-200 high quality stocks on your watchlist, these setups actually occur more frequently than you might think!
Today, I’m doing something I don’t take lightly: I am opening up the hood and sharing my personal watchlist of roughly 150 global, above-average companies that I’ve meticulously curated over the last few years.
The ten-year version of this exercise produces impossible numbers like 2.2x. The five-year versions can be found much more frequently. Still rare. But more frequent.
That is why five years is the window I care about. It’s long enough that keeping the stock flat against fast growth requires the multiple compression to be severe, and short enough that it happens often enough to build a watchlist around.
Five years is also long enough for the ownership base to have completely turned over, for the sell-side to have downgraded and moved on, and for the narrative to have fully inverted.
Changes in multiples, “sentiment flips,” usually happen swiftly! Remember what we wrote when we talked about price trends further above?
“That’s why breaks in long-term uptrends deserve attention. They don’t happen often, and when they do, they usually signal a meaningful change in perception, and they often “break hard.” As a rule of thumb: The longer and steeper the uptrend, the more violent the reversion when it finally breaks.“
Take a business that compounded earnings at 25% for five years while the stock did nothing. By definition, the multiple is now sitting at about a third of where it started, so 30x has become roughly 10x. Now assume growth halves from here to 12%, which is a serious haircut and not a bull case, and assume the multiple merely recovers to 20x over the following five years. That’s a 14.9% annual contribution from the multiple stacked on 12% from earnings, or (almost) a 29% CAGR.
Importantly, the growth didn’t have to continue at the old rate. It only had to avoid collapsing, which is effectively also my Meli thesis. For the bet to work out, the business does not need to continue growing at 35%, let alone 50%+. 15% for five years likely does the job.
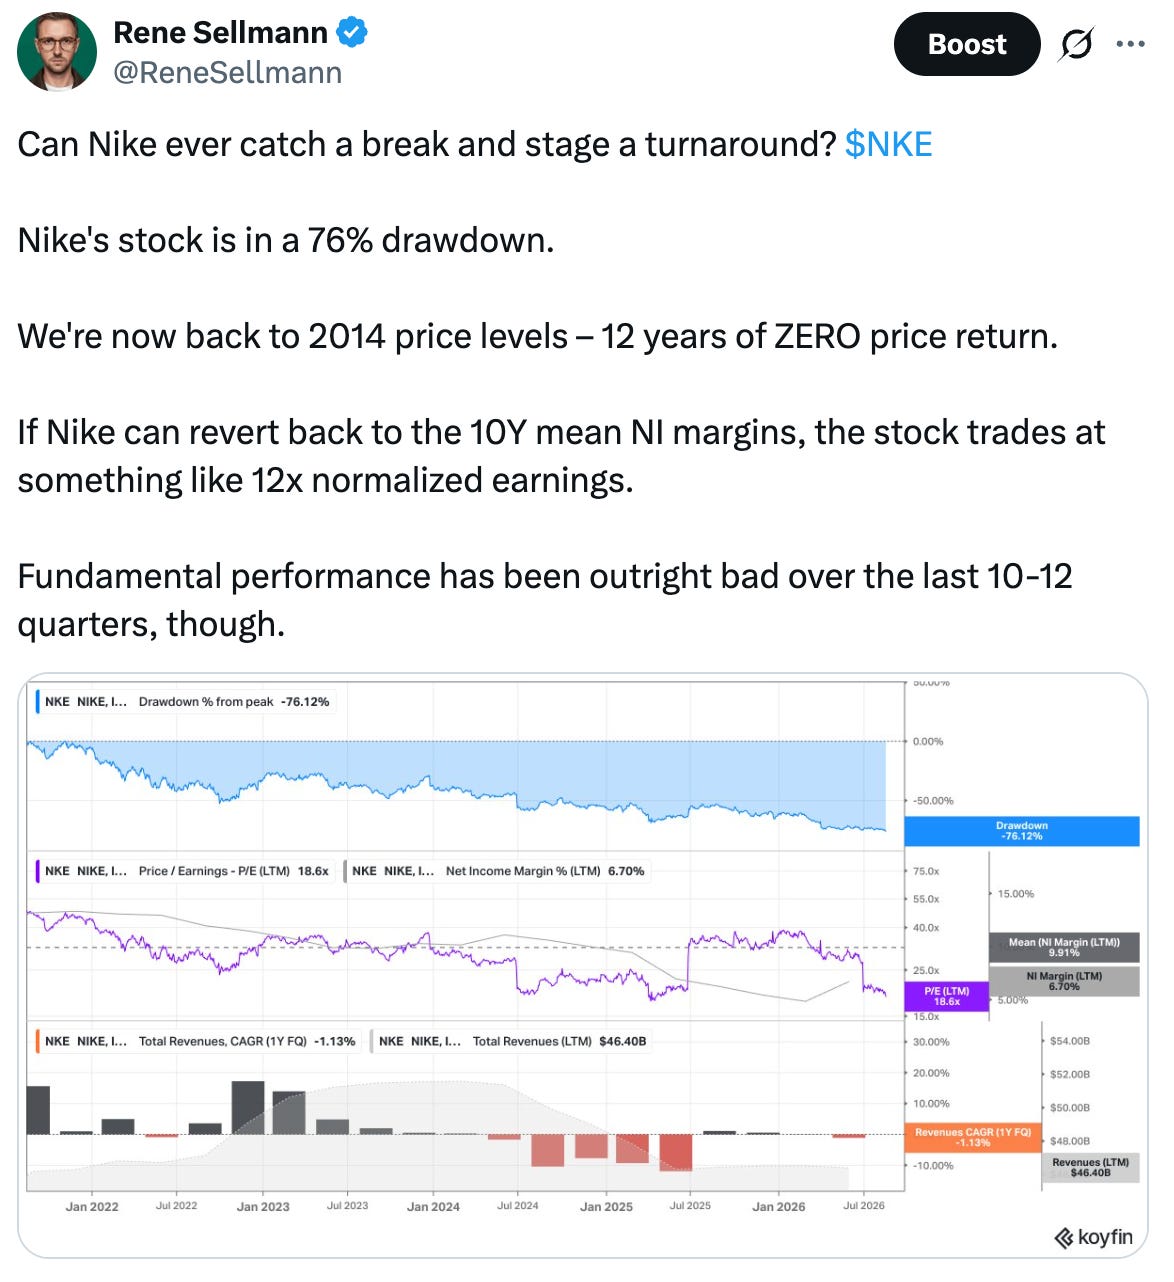
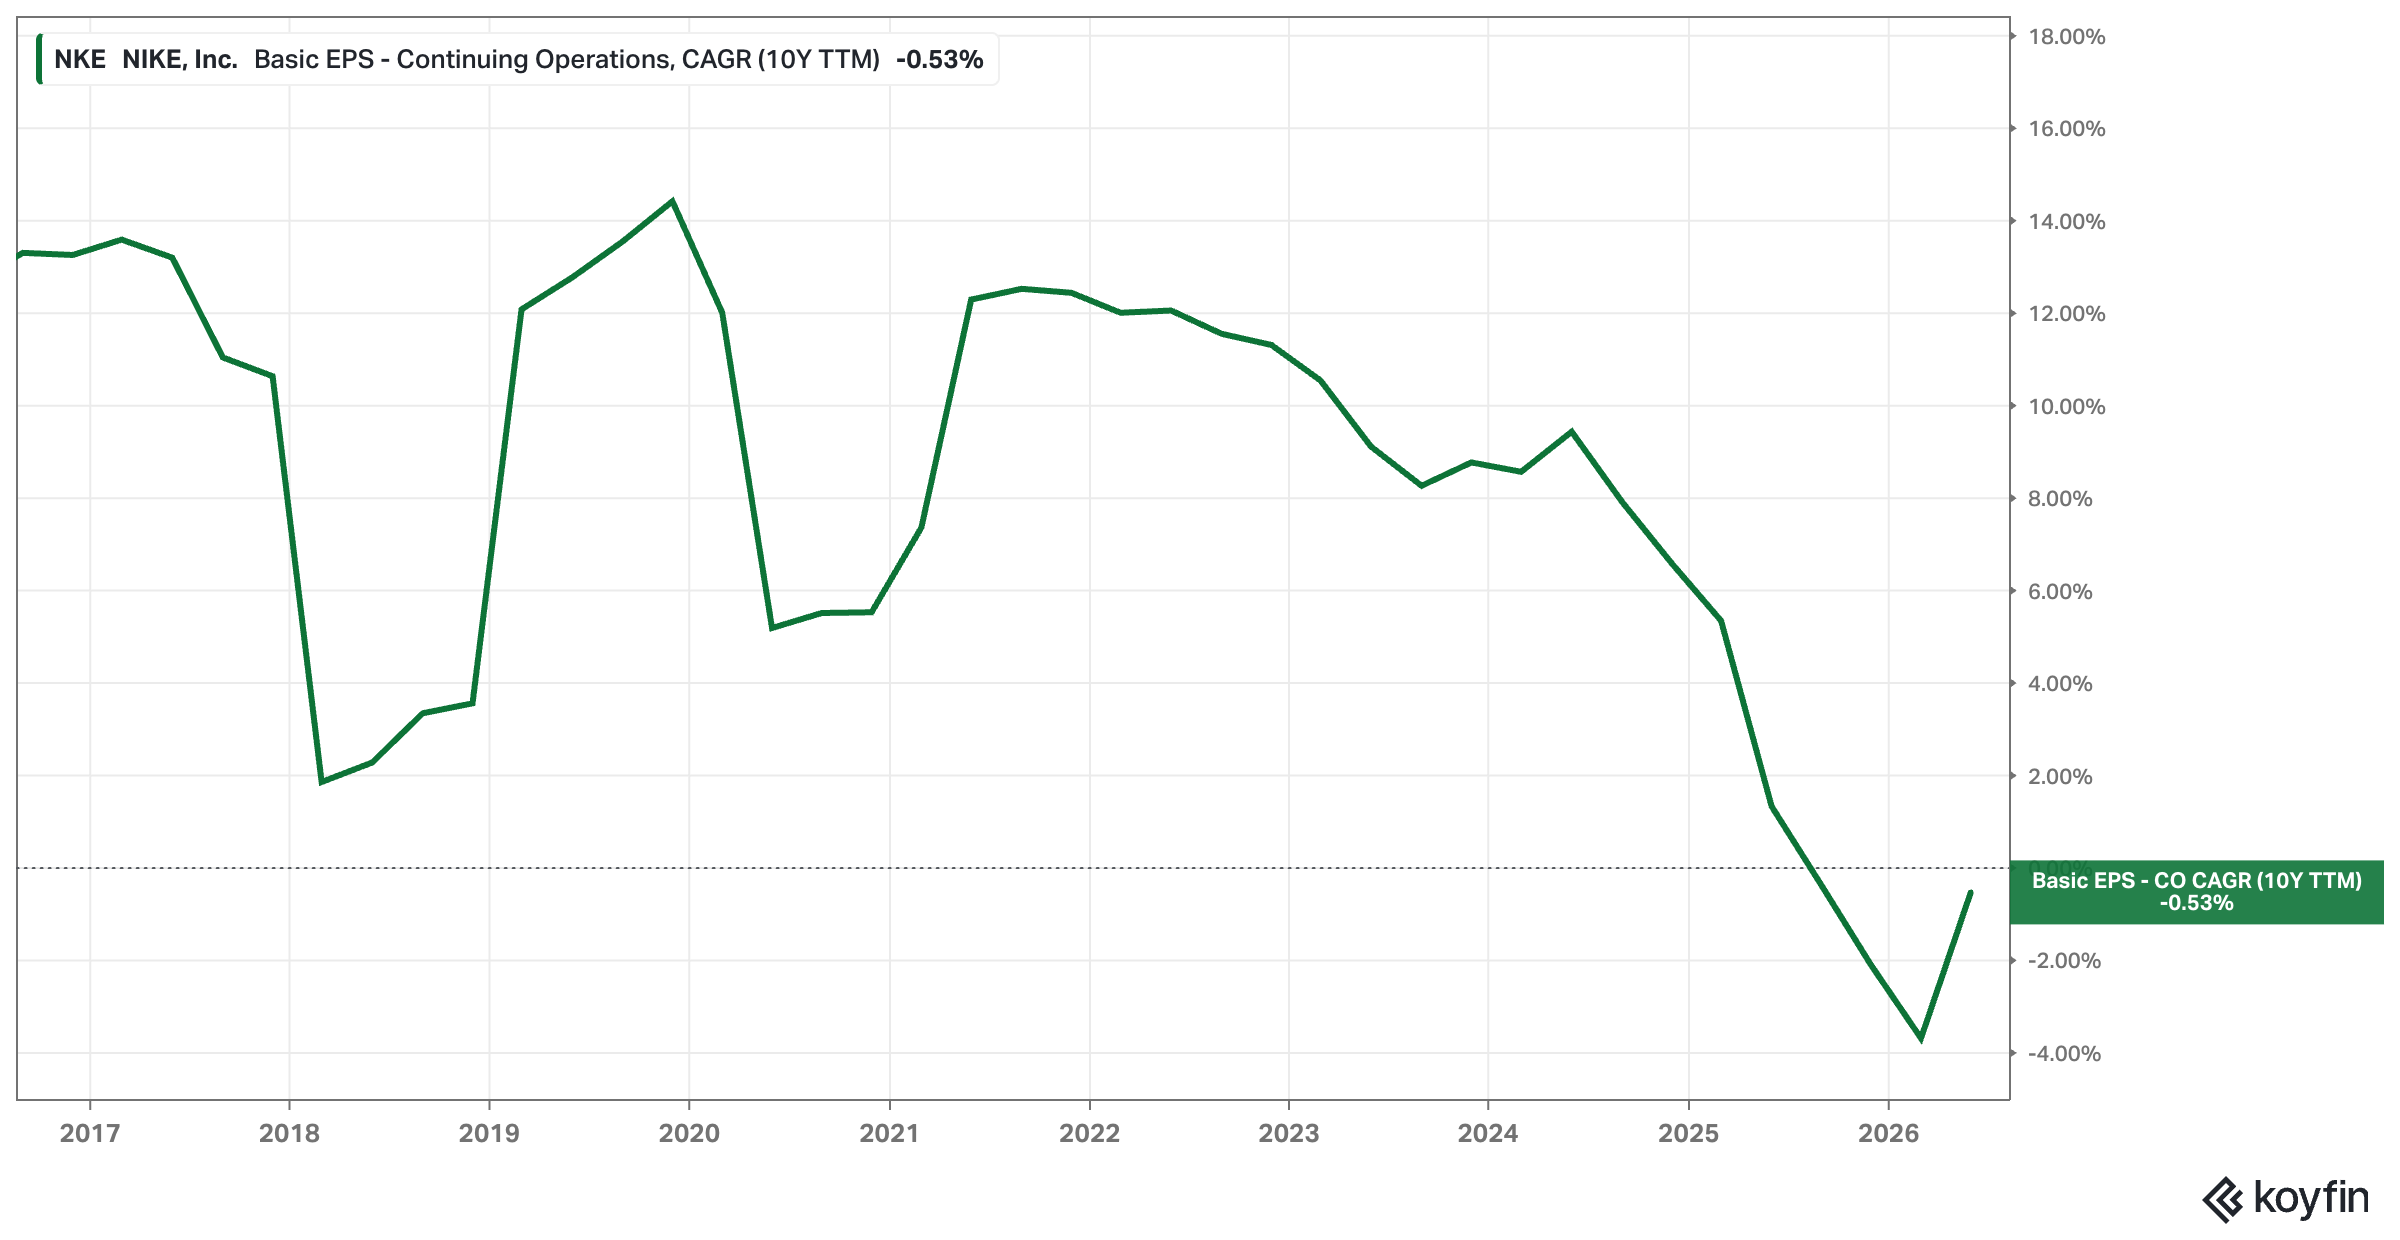
I prefer these setups over something like Nike, now flat for 12 (!) years and sitting at an eleven-year low as I write this, where the intrinsic value growth is just not there or very slow.
You want to know at what rate Nike compounded its EPS over the last ten years?
Take a guess!
Negative 0.5% ...
The company is earning less per share than it did a decade ago. Both twin engines were in action here; unfortunately, in the wrong direction (Nike is down something like 76% from a prior high).
That’s why I prefer setups like in Mercado Libre in 2026. In my deep dive, I started with this observation, which got me interested in the first place:
“This approach has allowed MELI to compound value at an extraordinary pace. Even with the current 37% drawdown and a stock that has essentially gone sideways over the past five years, ...”
The de-rating is not a risk sitting out in front of me. It’s a thing that already happened, and it happened while the business did the exact opposite of deteriorating, closing the stretch with its fastest growth in four years.
My friend – and he is much wiser than I am – may look at that chart and see the opening act of a lost decade. I – a much younger and more naive investor, chasing growth 😉 – look at the same chart and see five years in which the multiple did all the work in the wrong direction while the business kept its end of the bargain.
Where This Could Blow Up In My Face
I want to be honest about the failure mode, because this screen has one and it’s not a small one.
Five flat years against fast reported growth is also the exact shape a stock makes when the market is early, but correct. The de-rating happens because the market has begun pricing a deceleration that hasn’t yet arrived in the reported numbers.
Fifty percent growth today is a statement about the last twelve months. The multiple is a statement about the next ten years, and there’s no rule that says the trailing number is the better-informed of the two.
The J.P. Morgan figure that should keep me humble is the sector one: close to 60% of technology companies in that Russell 3000 sample suffered a permanent 70% decline. The pond I love to fish in is the same pond that produces most of the wreckage.
So the question I have to answer for every half-lost-decade candidate is the same one you would ask about a full one. Is the deceleration the market is pricing structural, or is it temporary and solvable?
For Mercado Libre, it means naming in advance the things that would tell me the multiple was right and I was wrong: credit losses running above the loss curves management has guided to while the book grows 75% a year, engagement metrics rolling over, take rate compression that traces to competition rather than to mix, or margins permanently parked at 6.7% for reasons other than deliberate reinvestment. If these things materialize, then the five flat years were a warning, and I mistook a warning for a discount.
But if they don’t show up, what I bought was a business that grew straight through its own de-rating. That’s the only version of this game I actually know how to play.
That’s a great way to highlight that compounding prevails over the long term. It all boils down to understanding which businesses are capable of compounding versus the ones that are not.
Really good thought provoking post René. The majority of stocks we select will go on to underperform, just due to the nature of base rates. Be it multiple contraction, top line / bottom line deceleration, whatever, even the best of the best only get it right ~40-60% of the time.
What matters then is ensuring the winners can do the heavy lifting - let the winners run (always easier said then done!).
How do you think about position sizing in this context?








That’s a great way to highlight that compounding prevails over the long term. It all boils down to understanding which businesses are capable of compounding versus the ones that are not.
Really good thought provoking post René. The majority of stocks we select will go on to underperform, just due to the nature of base rates. Be it multiple contraction, top line / bottom line deceleration, whatever, even the best of the best only get it right ~40-60% of the time.
What matters then is ensuring the winners can do the heavy lifting - let the winners run (always easier said then done!).
How do you think about position sizing in this context?