

Dear Compounders,
As I mentioned before, a self-made printed copy of Nick Sleep’s Nomad letters (a softcover book version) sits on my shelf. I first read the letters about eight years ago and have gone back to them several times since.
In the first part of this series focused on Sleep’s letters, I worked through the letters from the partnership’s launch in 2001 up to 2004. Today I’m moving on to the middle years, 2005 to 2007, and the timing of my latest reread turned out better than I could have planned.
One passage from the summer of 2006 stopped me cold. Sleep is describing a commodity boom. The copper miner Phelps Dodge carried a $20bn market value, and its shareholders held the stock for an average of three months.
Three months.
Read that passage next to this year’s AI infrastructure headlines and the parallel is hard to miss.
What Does a Three-Month Holding Period Tell You About a Ten-Year Forecast?
Sleep’s argument was simple. “Prices are a language,” he wrote, and the Phelps Dodge price said the company would earn record free cash flow for most of the next decade, with no room for error. Yet the people setting that price changed their minds every quarter.
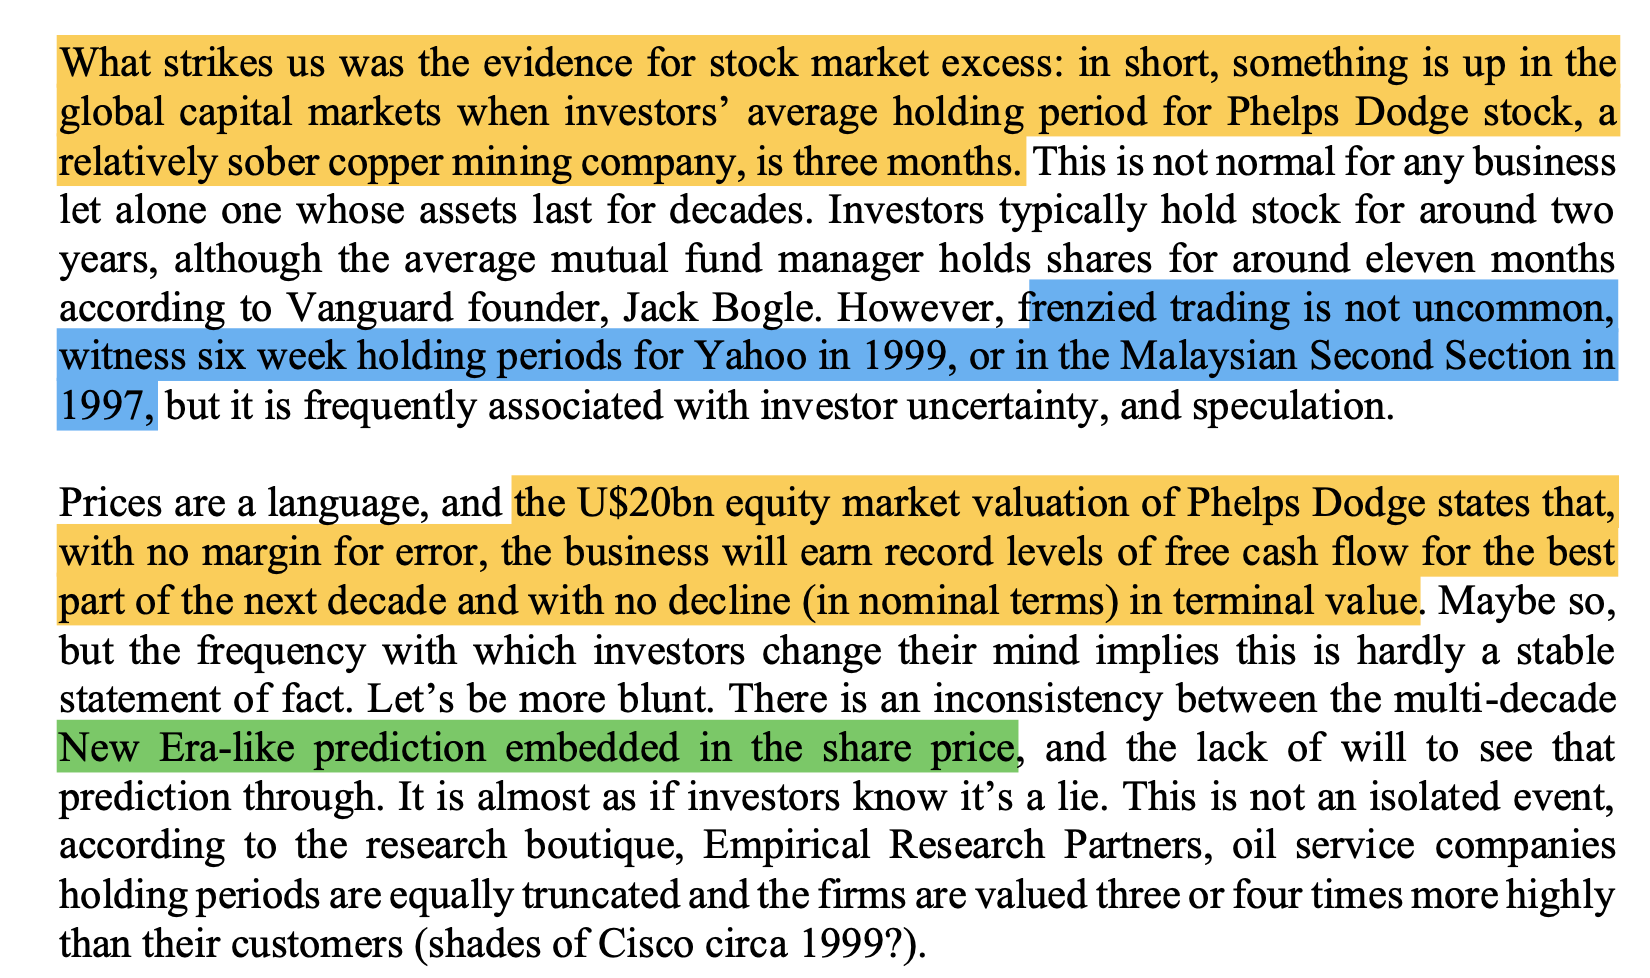
He saw a contradiction between a multi-decade prediction built into the stock and the lack of conviction among its owners, and he concluded that it was “almost as if investors know it’s a lie.” He then turned to the supply side. Companies in the sector expected to raise capital spending by around 40% over 2005, and he suspected management teams were understating their plans so as not to upset investors.
That is the capital cycle in its purest form: high valuations attract investment, and the investment eventually undermines the returns the market had priced in.
The open question is how long “eventually” takes.
“Human nature being as it is, we can almost guarantee that capital spending will continue to grow until share prices decline.”
Now jump twenty years ahead. Goldman Sachs now expects a combined $5.3 trillion of capex from the four largest hyperscalers – Meta, Microsoft, Amazon, and Alphabet – from fiscal 2025 to fiscal 2030, and its baseline aggregate estimate stands at $7.6 trillion between 2026 and 2031 across compute, data centers, and power. McKinsey arrives at a similar figure, projecting nearly $7 trillion in global data-center capex by 2030, comparable to the GDP of Japan and Germany combined. In 2026 alone, Google, Amazon, Microsoft, and Meta plan to allocate $725 billion to capital expenditures, up 77% from last year’s already record-breaking $410 billion.
I’m not calling a top. The AI trade may well have further to run and may rebound relatively quickly, and these are cash-rich companies run by capable people. Still, the warning signs are piling up, and the one that bothers me most is how increasingly creative the financing has become. Both Jensen Huang and Nvidia have been widely referred to by Wall Street analysts, tech commentators, and the financial press as the "central banker" (or "central bank") of the AI sector. It remains to be seen whether Huang’s successor can replicate this deal-making talent.
What I take from Sleep’s passage, too, is a lesson about where attention flows. He noted that whenever one corner of the market is in a frenzy, there is usually an “anti-bubble” of discarded companies somewhere else.
In 2006, he found it in large, high-quality growth businesses that looked cheaper to him than they had in years. Interestingly, we may witness the same anti-bubble right now; I certainly believe so and my portfolio activity reflects that. Bill Ackman, known for his quality approach, made seven (!) new investments in the last six months as he just revealed.
The Phelps Dodge passage leads straight into the three mental models I want to unpack today.
Why Is the Long End of the Curve So Empty?
I’ve written about this idea at length before, so I’ll keep it short.
The Equity Yield Curve: Why the Long Game Pays Better Than You Think

Most investors have a working knowledge of the bond yield curve. It's a basic concept of finance: under normal circumstances, the longer you lend your money, the more you expect to be compensated.
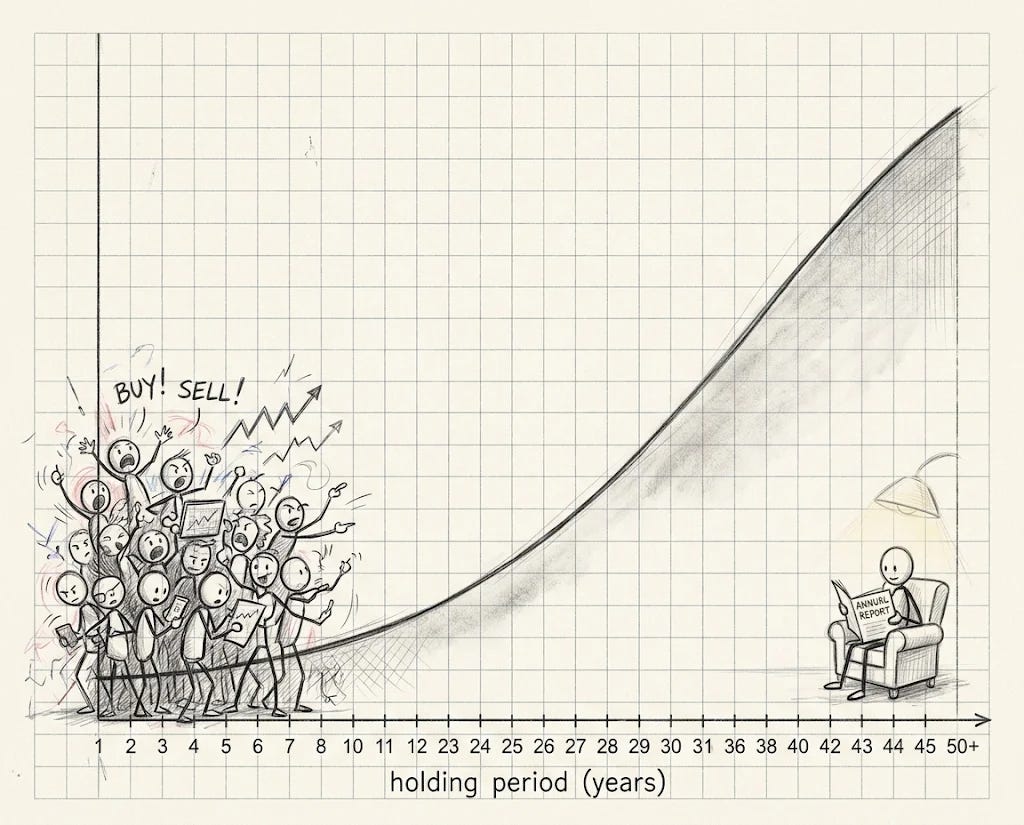
Sleep’s equity yield curve borrows its shape from the bond market and turns its logic around. Bonds pay more at longer maturities to compensate for more risk. In stocks, Sleep argued, a business’s outcomes are often easier to predict five years out than next quarter, because corporate strategy, capital allocation and the starting valuation are visible today, while the next data point is noise.
“In other words (at this point economics students may wish to cover their ears) the return from investing in shares can be both increased and de-risked by time.”
His own portfolio provided the evidence. Sorted by how long Nomad had held them, the stocks’ annualized returns rose with every additional year, and the gap between the newest and oldest holdings exceeded 1,000 basis points a year.
Other investors held Nomad’s stocks for about twenty weeks on average. Sleep planned to hold them for about 260.
The short end of the curve is crowded with people competing on the next print, while the long end is almost empty. Benefiting from it takes patience more than brilliance.
You need to be willing to wait while the crowd isn’t.
Who Gets the Spoils of Scale?
The second model is the one Sleep is best known for, and the 2005 to 2007 letters show it most clearly. He called it “scale economies shared.”
Some businesses take the savings that come with size and hand them back to customers as lower prices, which widens the moat with every year of growth.

To measure this, he created the robustness ratio: the value a company passes to customers (and to employees, through above-market pay) divided by what it keeps for shareholders.
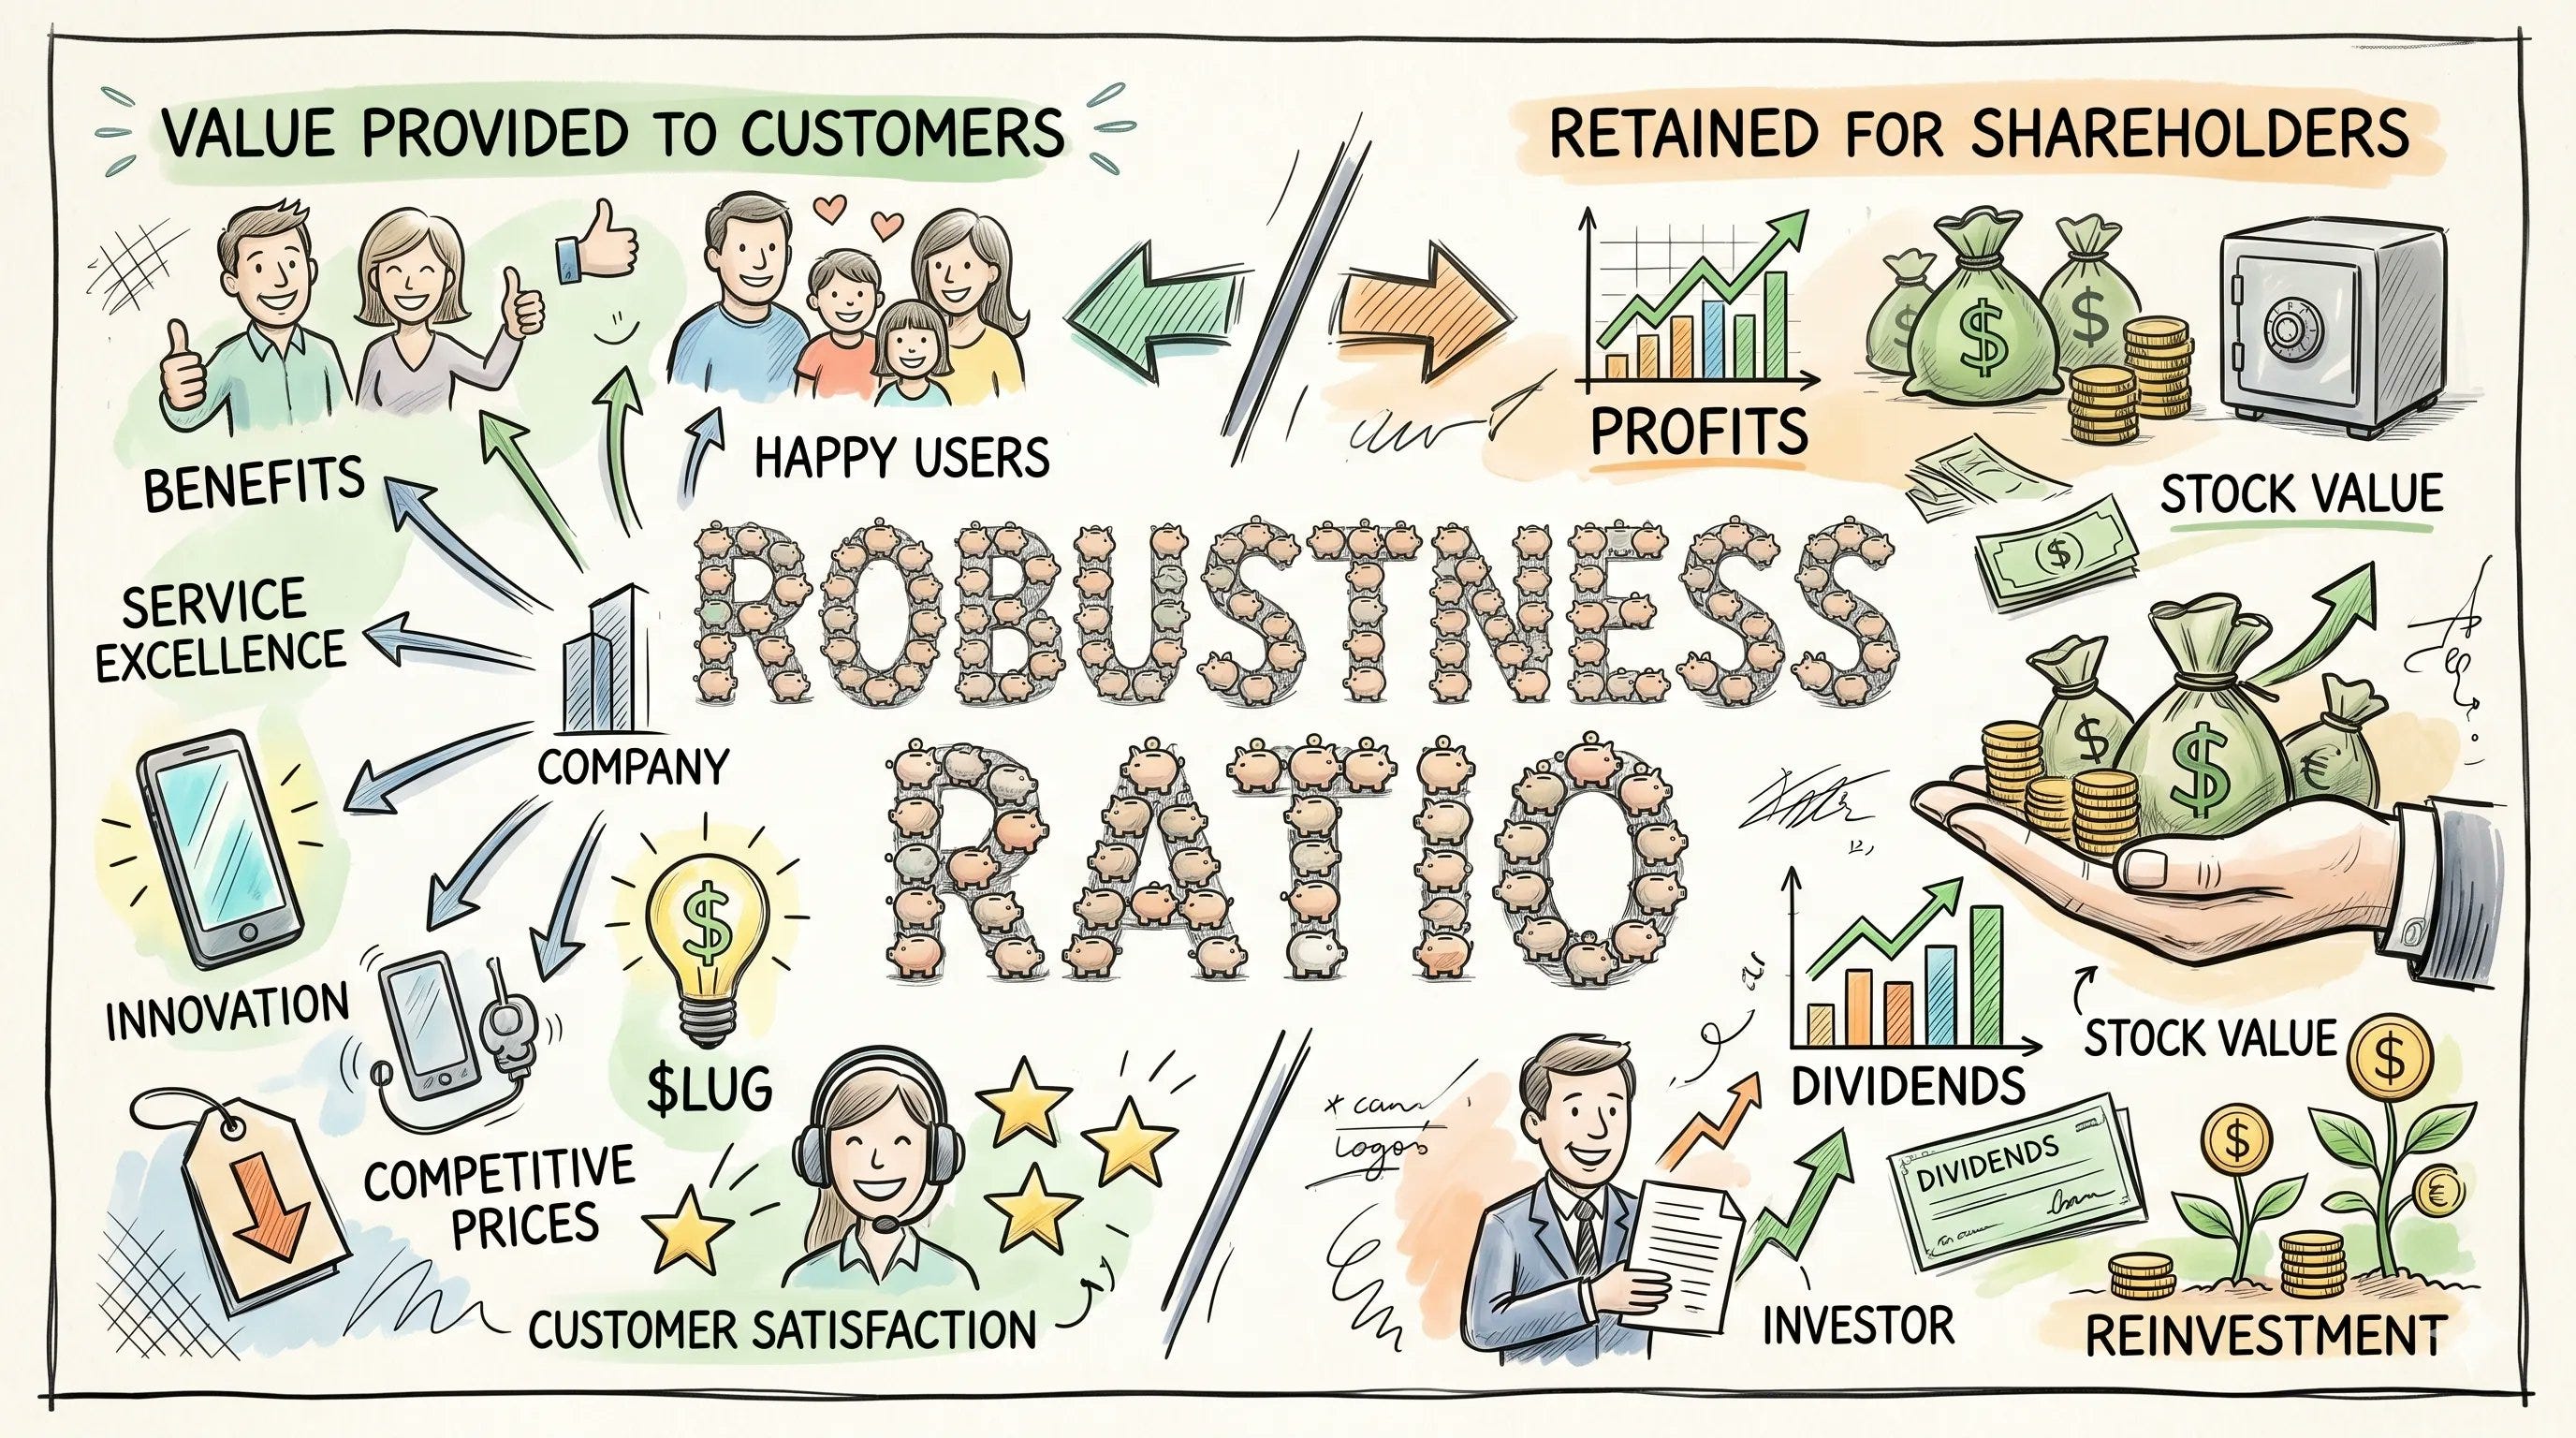
GEICO came out at roughly 1:1. Its customers saved about $1bn on premiums, and its underwriting profit was about $1bn. Costco came out at roughly 5:1. The average cardholder saved around $175 a year in exchange for a $23 membership fee, while shareholders kept about 15% of the total benefit. Wall Street saw this as retailing’s version of collectivism. Sleep saw a moat so wide that matching it would have cost Sam’s Club billions every year.
“Look around you. How many companies save five dollars for their customers for every one dollar they keep?”
By 2006, Amazon was showing the same pattern. It reported around $500m of free cash flow after spending, by Sleep’s estimate, roughly another $500m on discretionary growth, and that figure did not even count the price cuts it kept passing on. At its lows, the market was effectively telling Bezos his growth spending was worth nothing. Sleep took the opposite side of that bet and kept increasing the position.
Today, Wise is often described as the modern Costco, and when I first ran Sleep’s numbers on it, the result surprised me. In its FY2023 report, Wise said it had saved customers more than £1.5bn compared with traditional banks. In the same fiscal year, it reported net income of £114m. Divide one by the other and you get a robustness ratio of about 13:1.
That is more than two and a half times Costco’s ratio and roughly thirteen times GEICO’s.
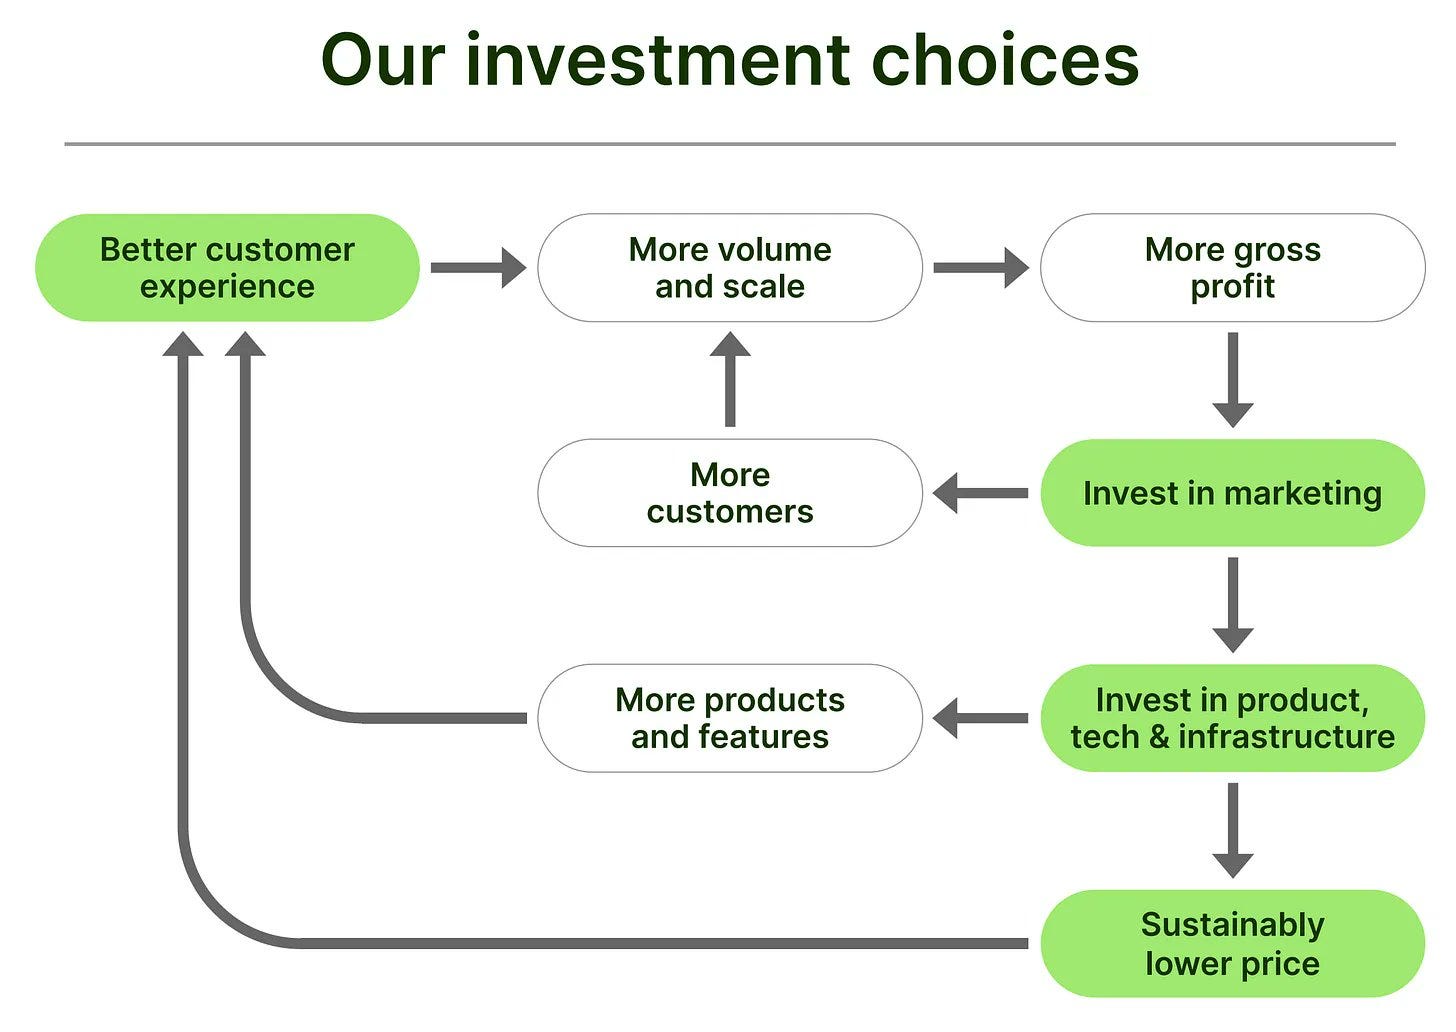
Put another way, for every pound Wise kept for its owners, its customers kept about thirteen. A competitor trying to match that offer would have to give up almost all of its own profit, and Wise keeps raising the bar, because it continues to reinvest efficiency gains into lower prices.
So how does the metric look 2-3 years later? When I ran the numbers again in May, Wise put its customer savings at about $3.3bn. Preliminary FY26 revenue back then was expected to be around $2.5bn, and if the 18% net margin from its H1 FY26 numbers held for the full year (so I assumed in May), net income should come in around $450m.
That gives a ratio of about 7.3:1.
At first glance, that looks like a moat in retreat. I read it differently. In FY23, cross-border transfers produced around 70% of Wise’s revenue. In May 2026, that share had fallen to 52%, and interest income and card services together make up the remaining 48%.
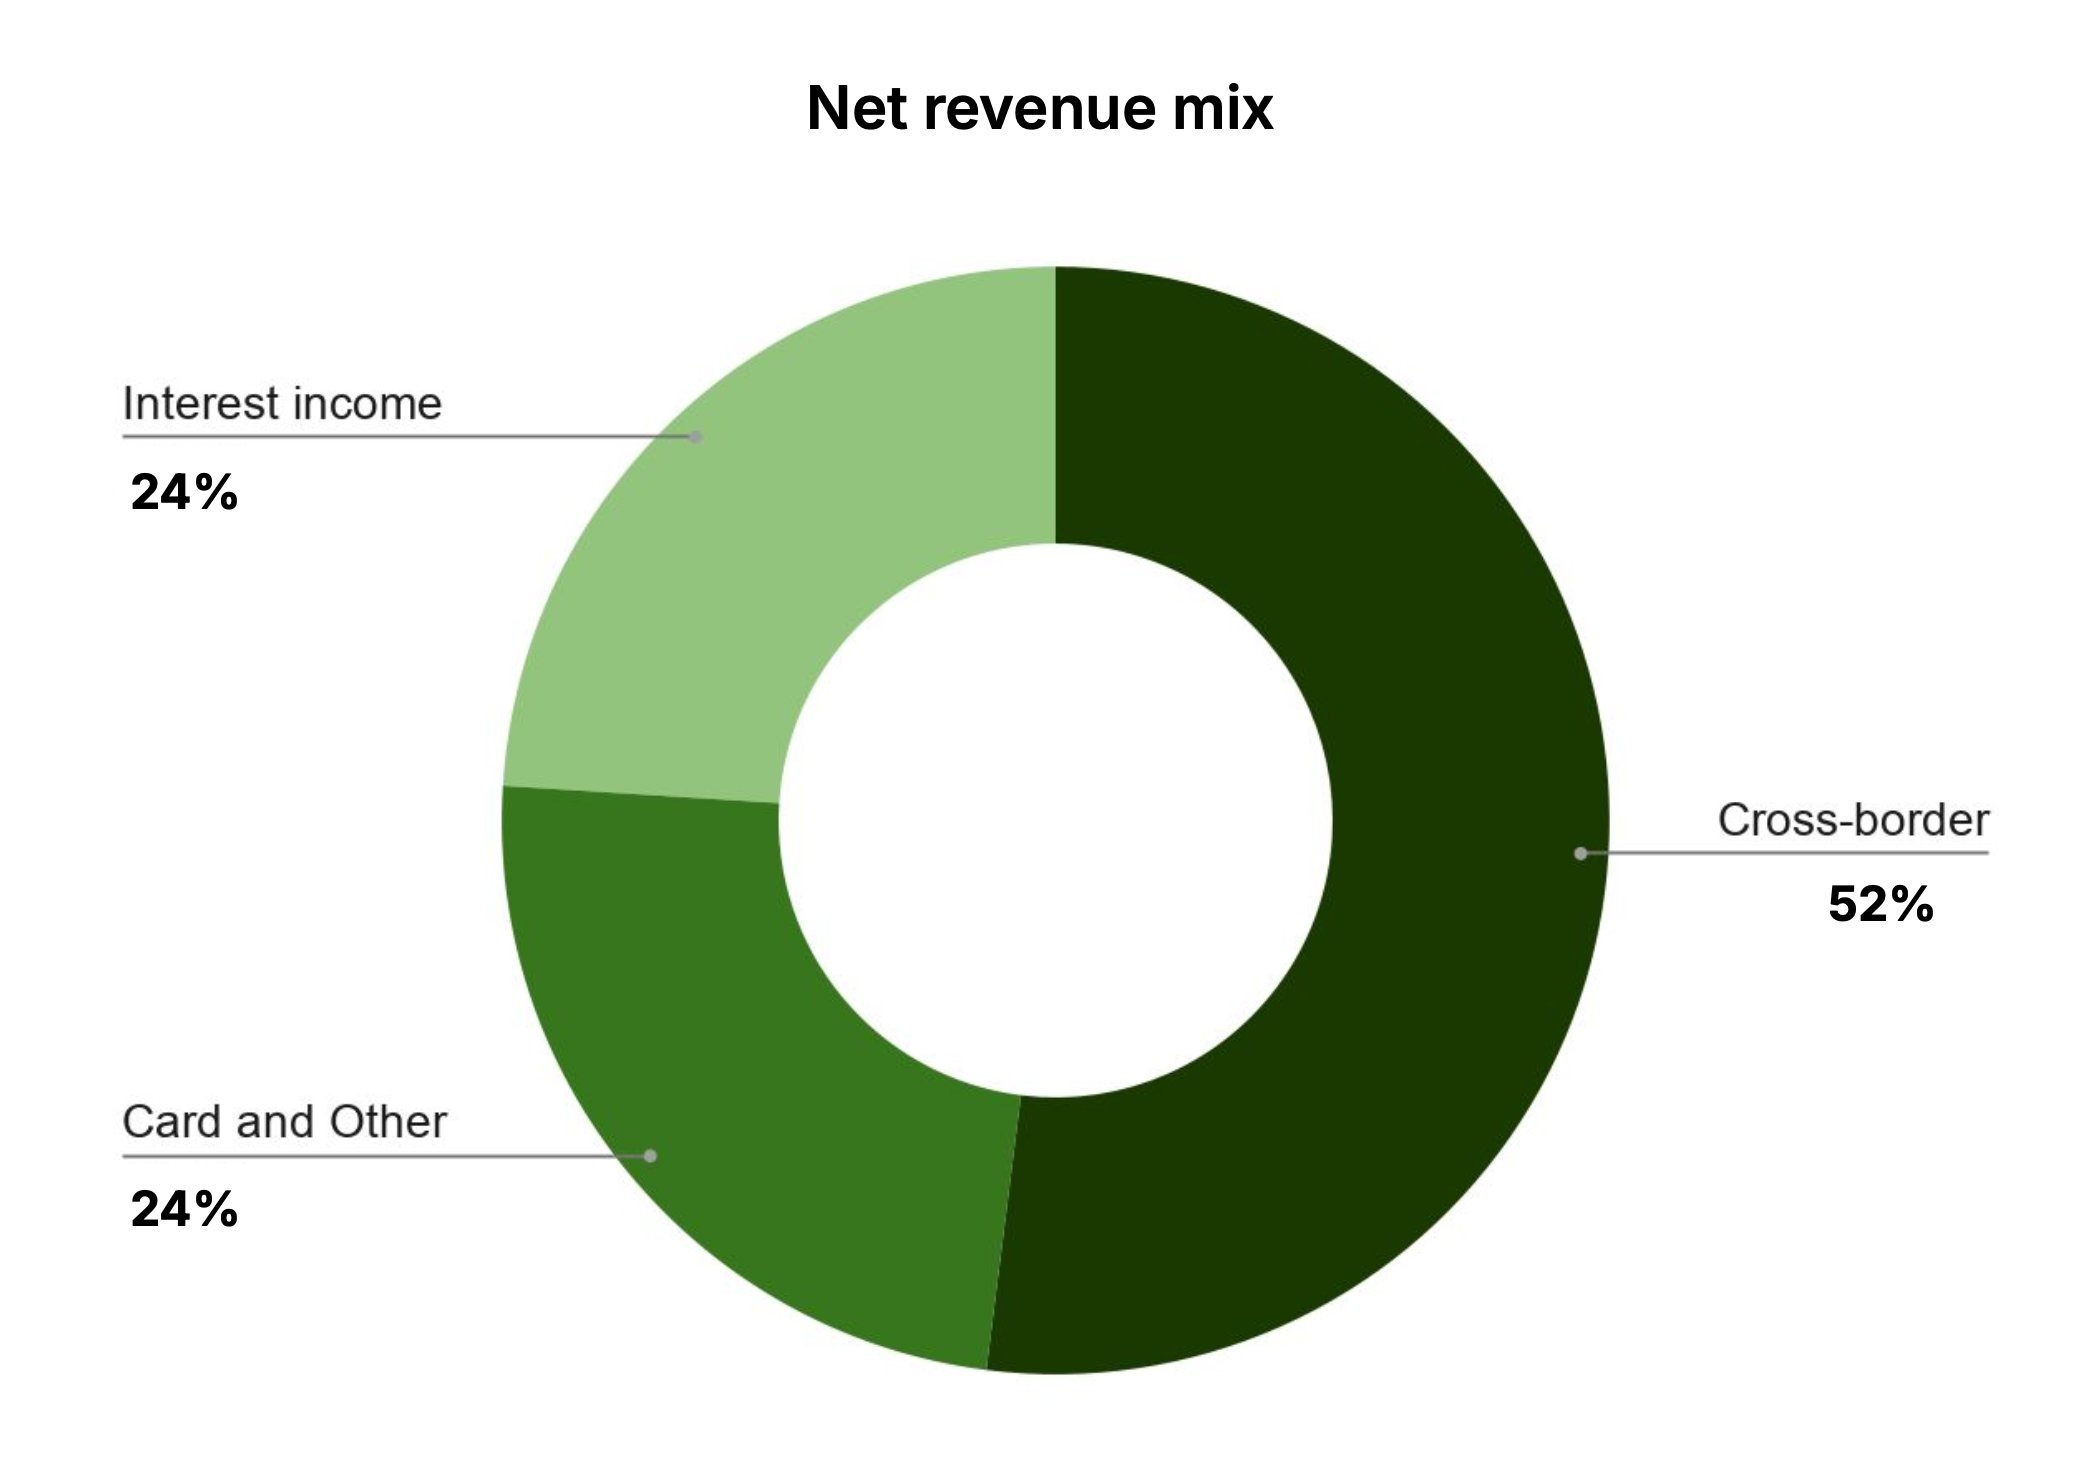
Those newer businesses carry richer margins for shareholders, which pulls the ratio down even while the core transfer business keeps cutting prices. Even so, for every dollar Wise keeps as profit, its customers still keep more than seven dollars compared with what a traditional bank would charge them.
That is still well ahead of Costco.
One detail deserves watching. Much of the interest income comes from customer balances, so how much of that yield Wise passes back to the account holders will decide whether the ratio holds at this level or keeps drifting lower.
The model shows up in other places in my portfolio too. Grab is rarely described this way, yet it carries some scale-economies-shared DNA, which I laid out in my deep dive. Interactive Brokers has kept passing the cost advantages of its automation on to clients through pricing for decades.
Once you start looking for the pattern, you find it in more places than you would expect. Sleep found it in a warehouse club, a car insurer and a (back-then predominantly) “online bookstore.”
Can You Plan Your Way Into a “Founder Portfolio”?
In the 2007 interim letter, Sleep makes an admission I find disarming. More than 85% of Nomad was invested in businesses run by their founders or first-generation management, and Zak and he “did not plan for this.”
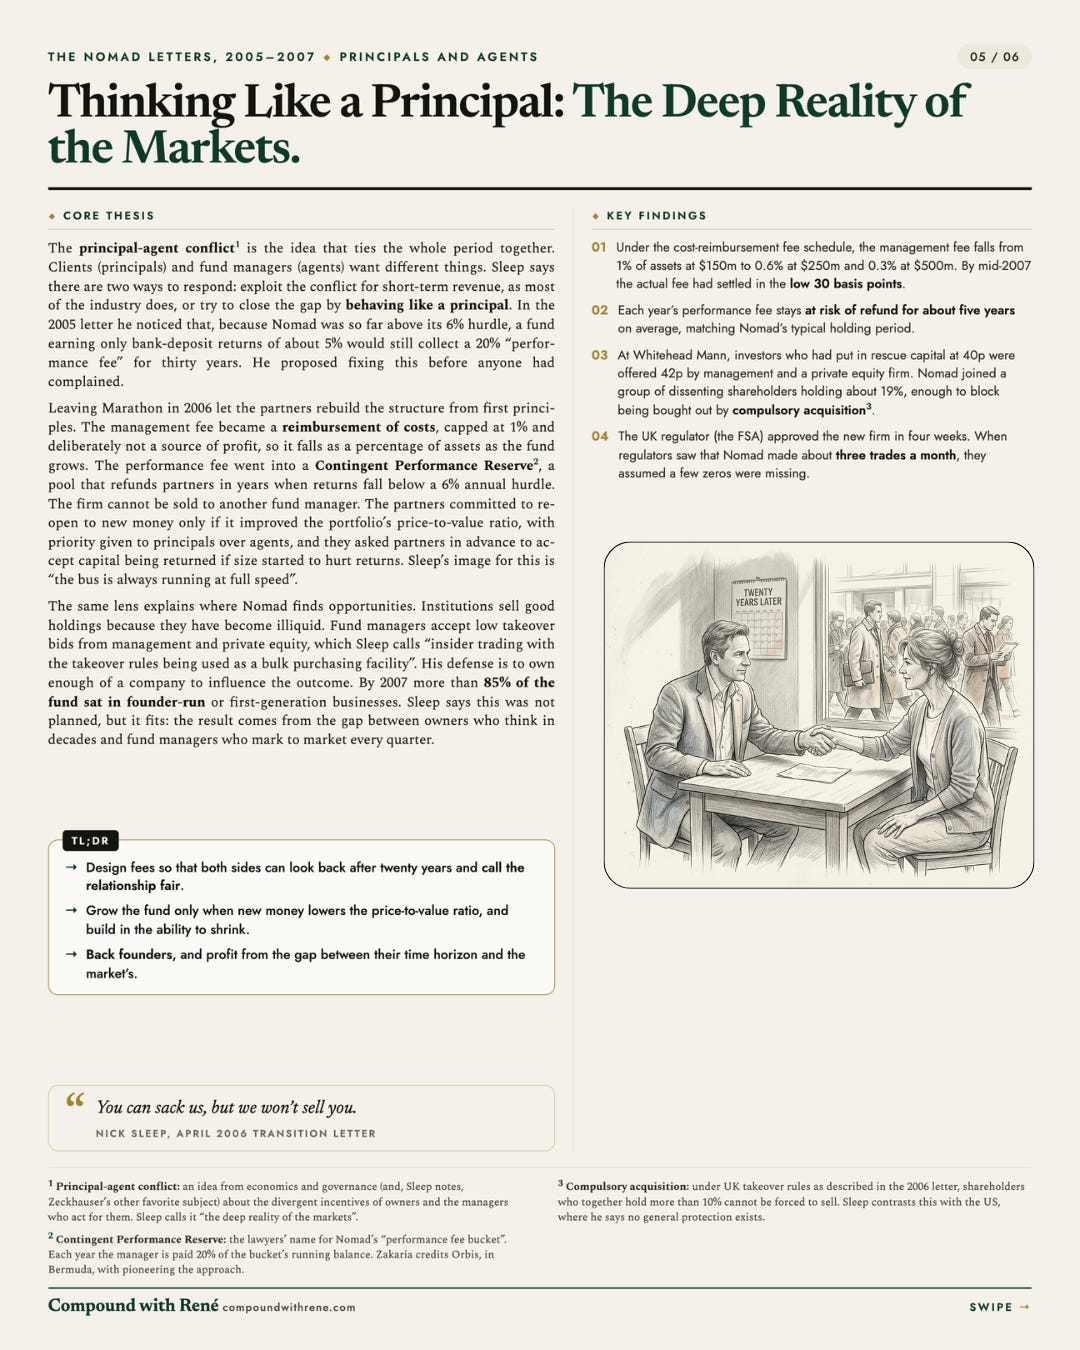
The managers, he wrote, had earned their way into the portfolio as a byproduct of how the two of them assessed people. Then he explained why it mattered.
“This principal (founder) agent (trading oriented fund manager) conflict is the deep reality of the markets and probably the dominant characteristic of our careers.”
I recognized myself in that passage more than I expected. As of today, all nine of my holdings are founder-led. In two cases, Mercado Libre and Interactive Brokers, the founder is no longer the CEO but remains deeply involved. I never set a filter for it. It emerged from following my process closely and strictly, much as it did for Sleep.
The counterexamples are instructive, too, though. The two positions I sold most recently, Edenred and Ashtead Technology, earned me excellent IRRs, and neither was founder-led.
In my recent quick pitch on EVS (trading at 4x trailing operating income after a profit warning a few weeks ago), low insider ownership was one of the weaknesses of the hypothesis I flagged.

Back to my portfolio. A 100% founder-led portfolio was never the goal. It is, however, a fingerprint my process leaves behind.
Now that I type this, I’m also reminded of Andrew Hollingworth and his fund at Holland Advisors, probably the most founder-focused fund I know of. His process rests on three pillars:
owner-managers,
the best business models, and
buying at opportunistic prices.
The result looks a lot like Nomad’s. In his own words, owner-managers make up around 90% of the holdings in his fund I believe (please double check this claim). More recently, the fund’s largest positions have included Jet2, Block, Nu Holdings, Wise, Ryanair, Amazon, and Constellation Software.
He also explains why so few professionals follow him: entrepreneurs are generally “eccentric” and “don’t care what other people think of them”, which tends to rub conventional fund managers the wrong way.
Sleep would have nodded along. Founders think like principals. Most of the people trading their shares think in quarters.
Disclaimer: The analysis presented in this blog may be flawed and/or critical information may have been overlooked. The content provided should be considered an educational resource and should not be construed as individualized investment advice, nor as a recommendation to buy or sell specific securities. I may own some of the securities discussed. The stocks, funds, and assets discussed are examples only and may not be appropriate for your individual circumstances. It is the responsibility of the reader to do their own due diligence before investing in any index fund, ETF, asset, or stock mentioned or before making any sell decisions. Also double-check if the comments made are accurate. You should always consult with a financial advisor before purchasing a specific stock and making decisions regarding your portfolio.
On Takeover Catalysts
Sleep mentions something else almost in passing. Six of Nomad’s roughly two dozen holdings received takeover bids within eighteen months, and Sleep called his book a “told you so” portfolio, full of stocks other investors would happily ridicule.
My experience rhymes with his. Over the past few years, a surprising number of companies I wrote about and owned received bids or saw a key asset sold. At Brockhaus, the Bikeleasing business was acquired. Zalaris and InPost both had transactions in 2026. Ashtead Technology received a takeover proposal. Edenred was the subject of rumors. I owned every one of them.
Sleep also offers an important caution on this point, and I keep it in mind. He was far from cheering every bid. Several letters rail against management buyouts and private equity offers that pay a small premium to a depressed share price, which he described as “insider trading with the takeover rules being used as a bulk purchasing facility.”

A bid confirms there is a gap between price and value. Whether the offer closes that gap is a different question. When a buyer turns up, my first reaction should be to ask what they can see that the market is missing.
What Still Holds Twenty Years Later?
These letters were written before the financial crisis, before smartphones changed retail, and before AI agents could summarize a 10-K in seconds. When Sleep asked readers to estimate e-commerce’s share of US retail, the answer was about 3%. Nomad itself was wound up in 2014, after the December 2013 letter.
Much of the world he described has changed, yet his core diagnosis holds up remarkably well. He argued back in 2005 that informational edges had largely vanished and that the lasting advantages were psychological and structural: patience, independence from the quarterly scorecard, and the willingness to back owners who think in decades.
If anything, the arrival of AI-driven research makes that diagnosis more relevant, because the analytical shortcuts are now available to everyone.
AI can speed up the research, but it cannot extend your holding period for you.
The Blueprint
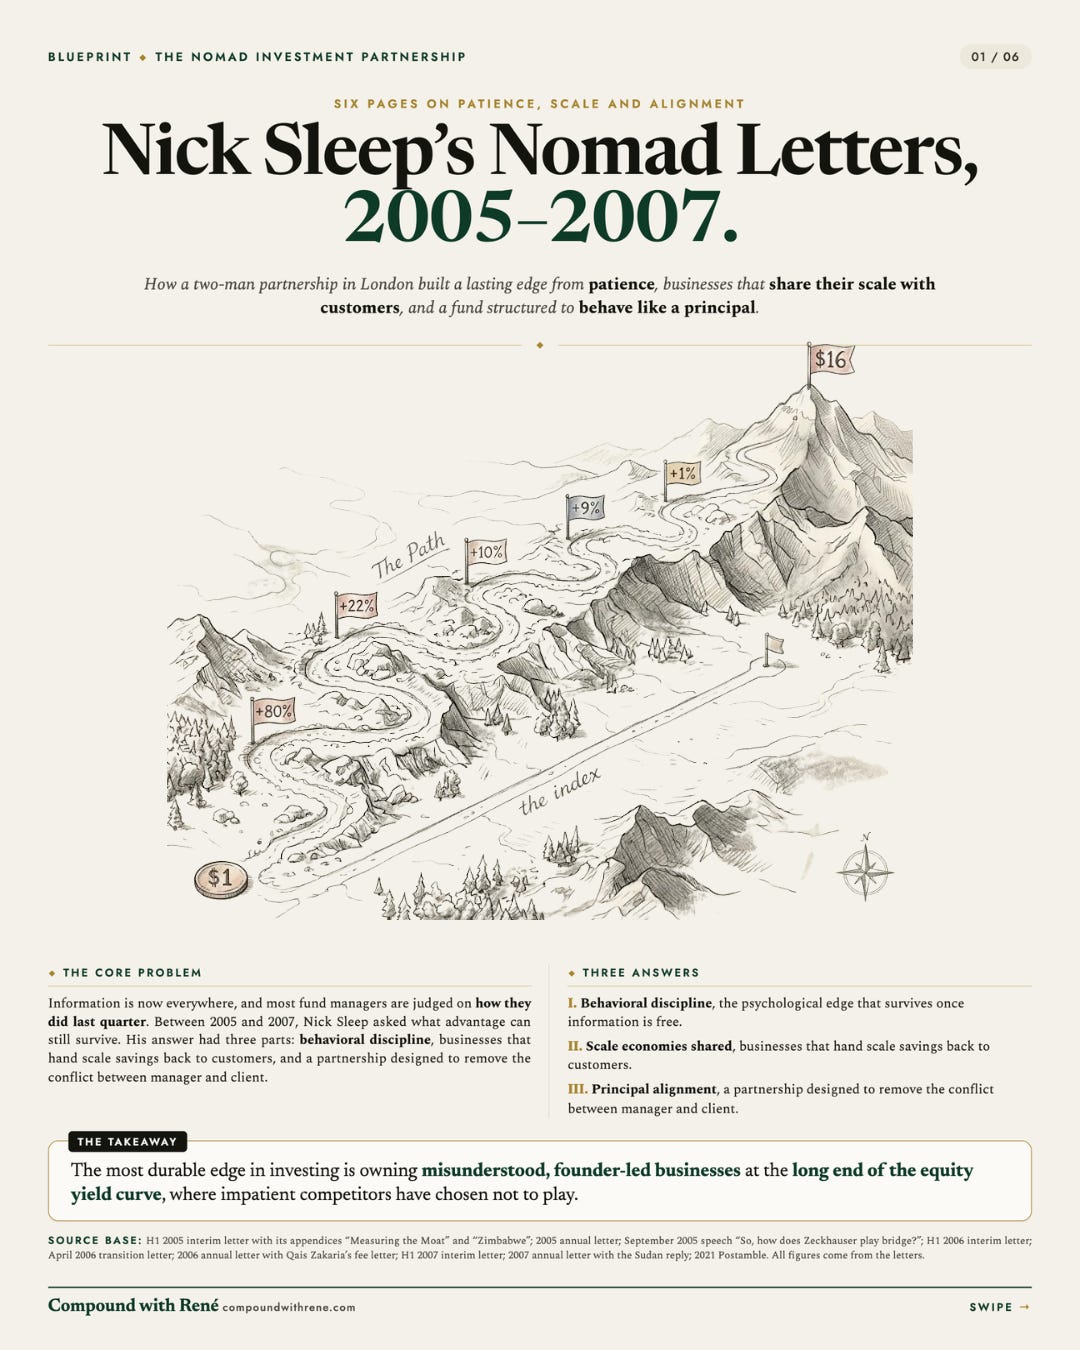
I distilled the 2005 to 2007 letters into a six-slide visual Blueprint. The cover sets out the central thesis. The five content slides cover destination thinking and the equity yield curve, the psychological edge (including how Zeckhauser plays bridge), scale economies shared and the robustness ratio, the principal-agent conflict along with Nomad’s unusual fee structure, and Sleep’s surprisingly gentle framework for learning from mistakes.

Each slide pairs a dense summary with key data points, footnotes, and pencil-drawn visuals, so you can take in the ideas in a few minutes and come back to the details whenever you need them.
Link to a note I shared with the slide deck as images (free to access for everyone):
Downloadable High-Resolution PDF (Exclusive for paying subscribers)
My suggestion: create a dedicated folder on your computer – something like “Investing Blueprints” – and save this one as your first entry.
Until next time, keep compounding.