

Let’s start with an anecdote before we move on to more structural things I’m seeing.
On the morning of July 30, a hedge fund sold its entire public equity portfolio in a single block trade before the opening bell. Longs and shorts together, the whole book, handed to Citadel in one transaction. Six trading days earlier, that same portfolio was sitting on a 439% net return for the year.
Ooops!
The fund we’re talking about – you already know it – is Situational Awareness LP, run by Leopold Aschenbrenner, who is twenty-four years old and wrote what a lot of people consider the defining investment memo of the AGI era.
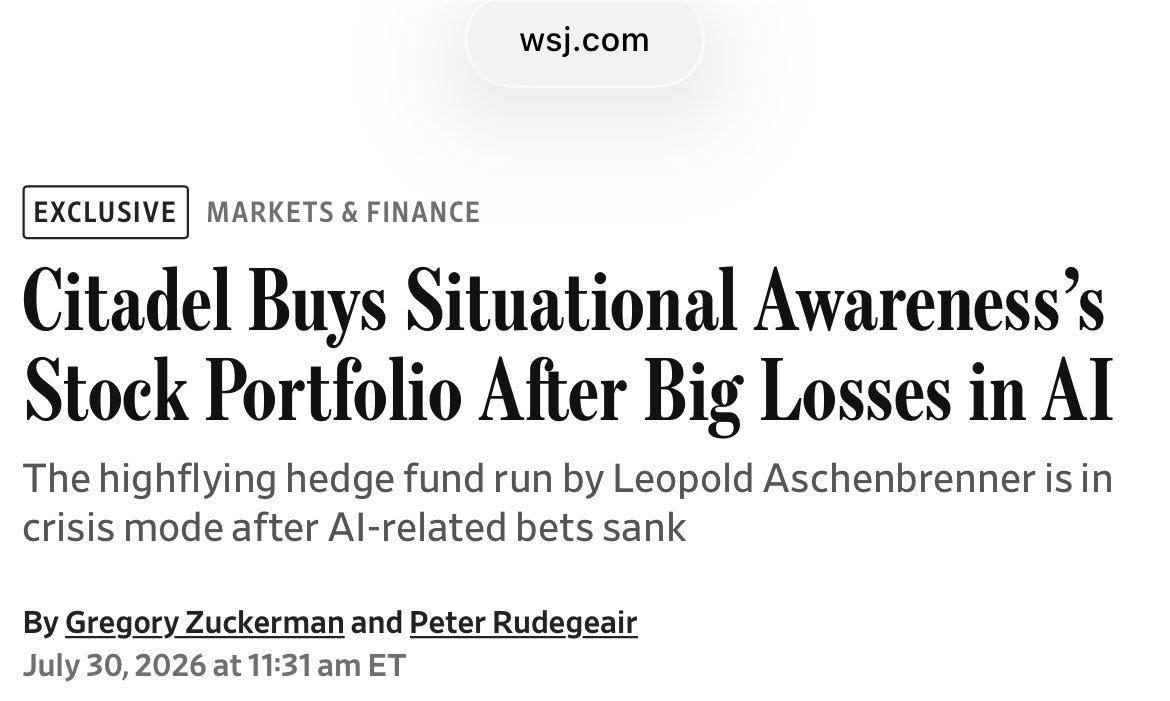
He had turned roughly $225 million of seed capital into a book worth tens of billions in under two years. Reports on the exact size vary quite a bit, somewhere between $20 billion and $45 billion depending on which outlet you read.
Apparently using 4x gross leverage, concentrated across the AI infrastructure stack:
power generation,
data centers,
memory.
Then Korean semiconductors wobbled. Under a week later, it was finished.
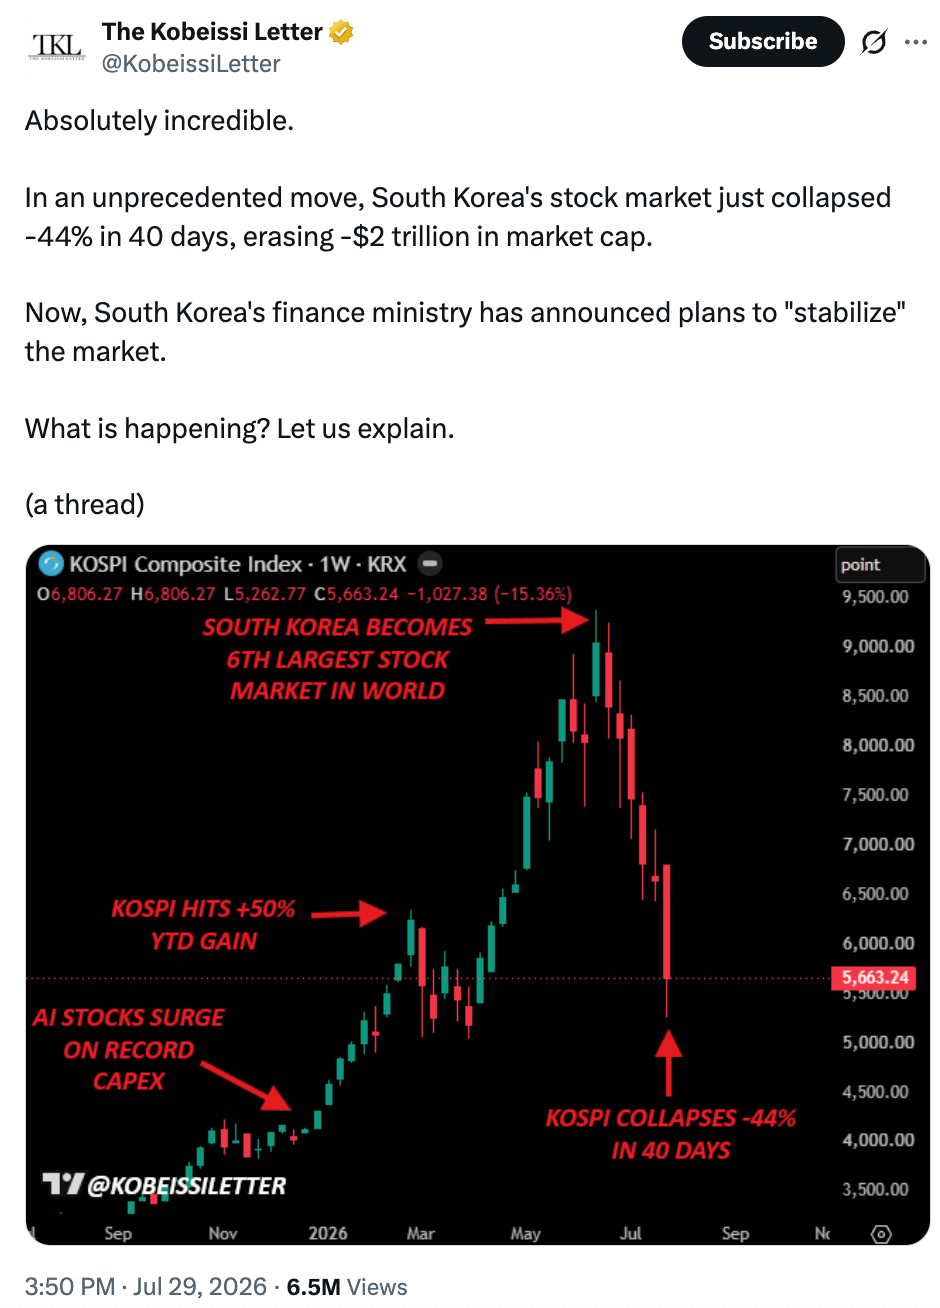
I published a piece in early June called “Navigating the Froth: 6 Alternative Signs of a Market Top,“ where I laid out six alternative signs that we were somewhere late in this cycle.
Chip workers in Seoul buying Ferraris with their bonuses.
Jensen Huang being chased through a Taipei night market by food bloggers.
Three private companies queuing up to go public at a trillion dollars each.
Berkshire’s cash pile going vertical.
And more.
Those six had something in common that I did not fully appreciate when I wrote them. You could see all of them from across the room.
There is a line on my Market Sentiment Cheat Sheet that has aged well: bottoms scream, tops whisper.
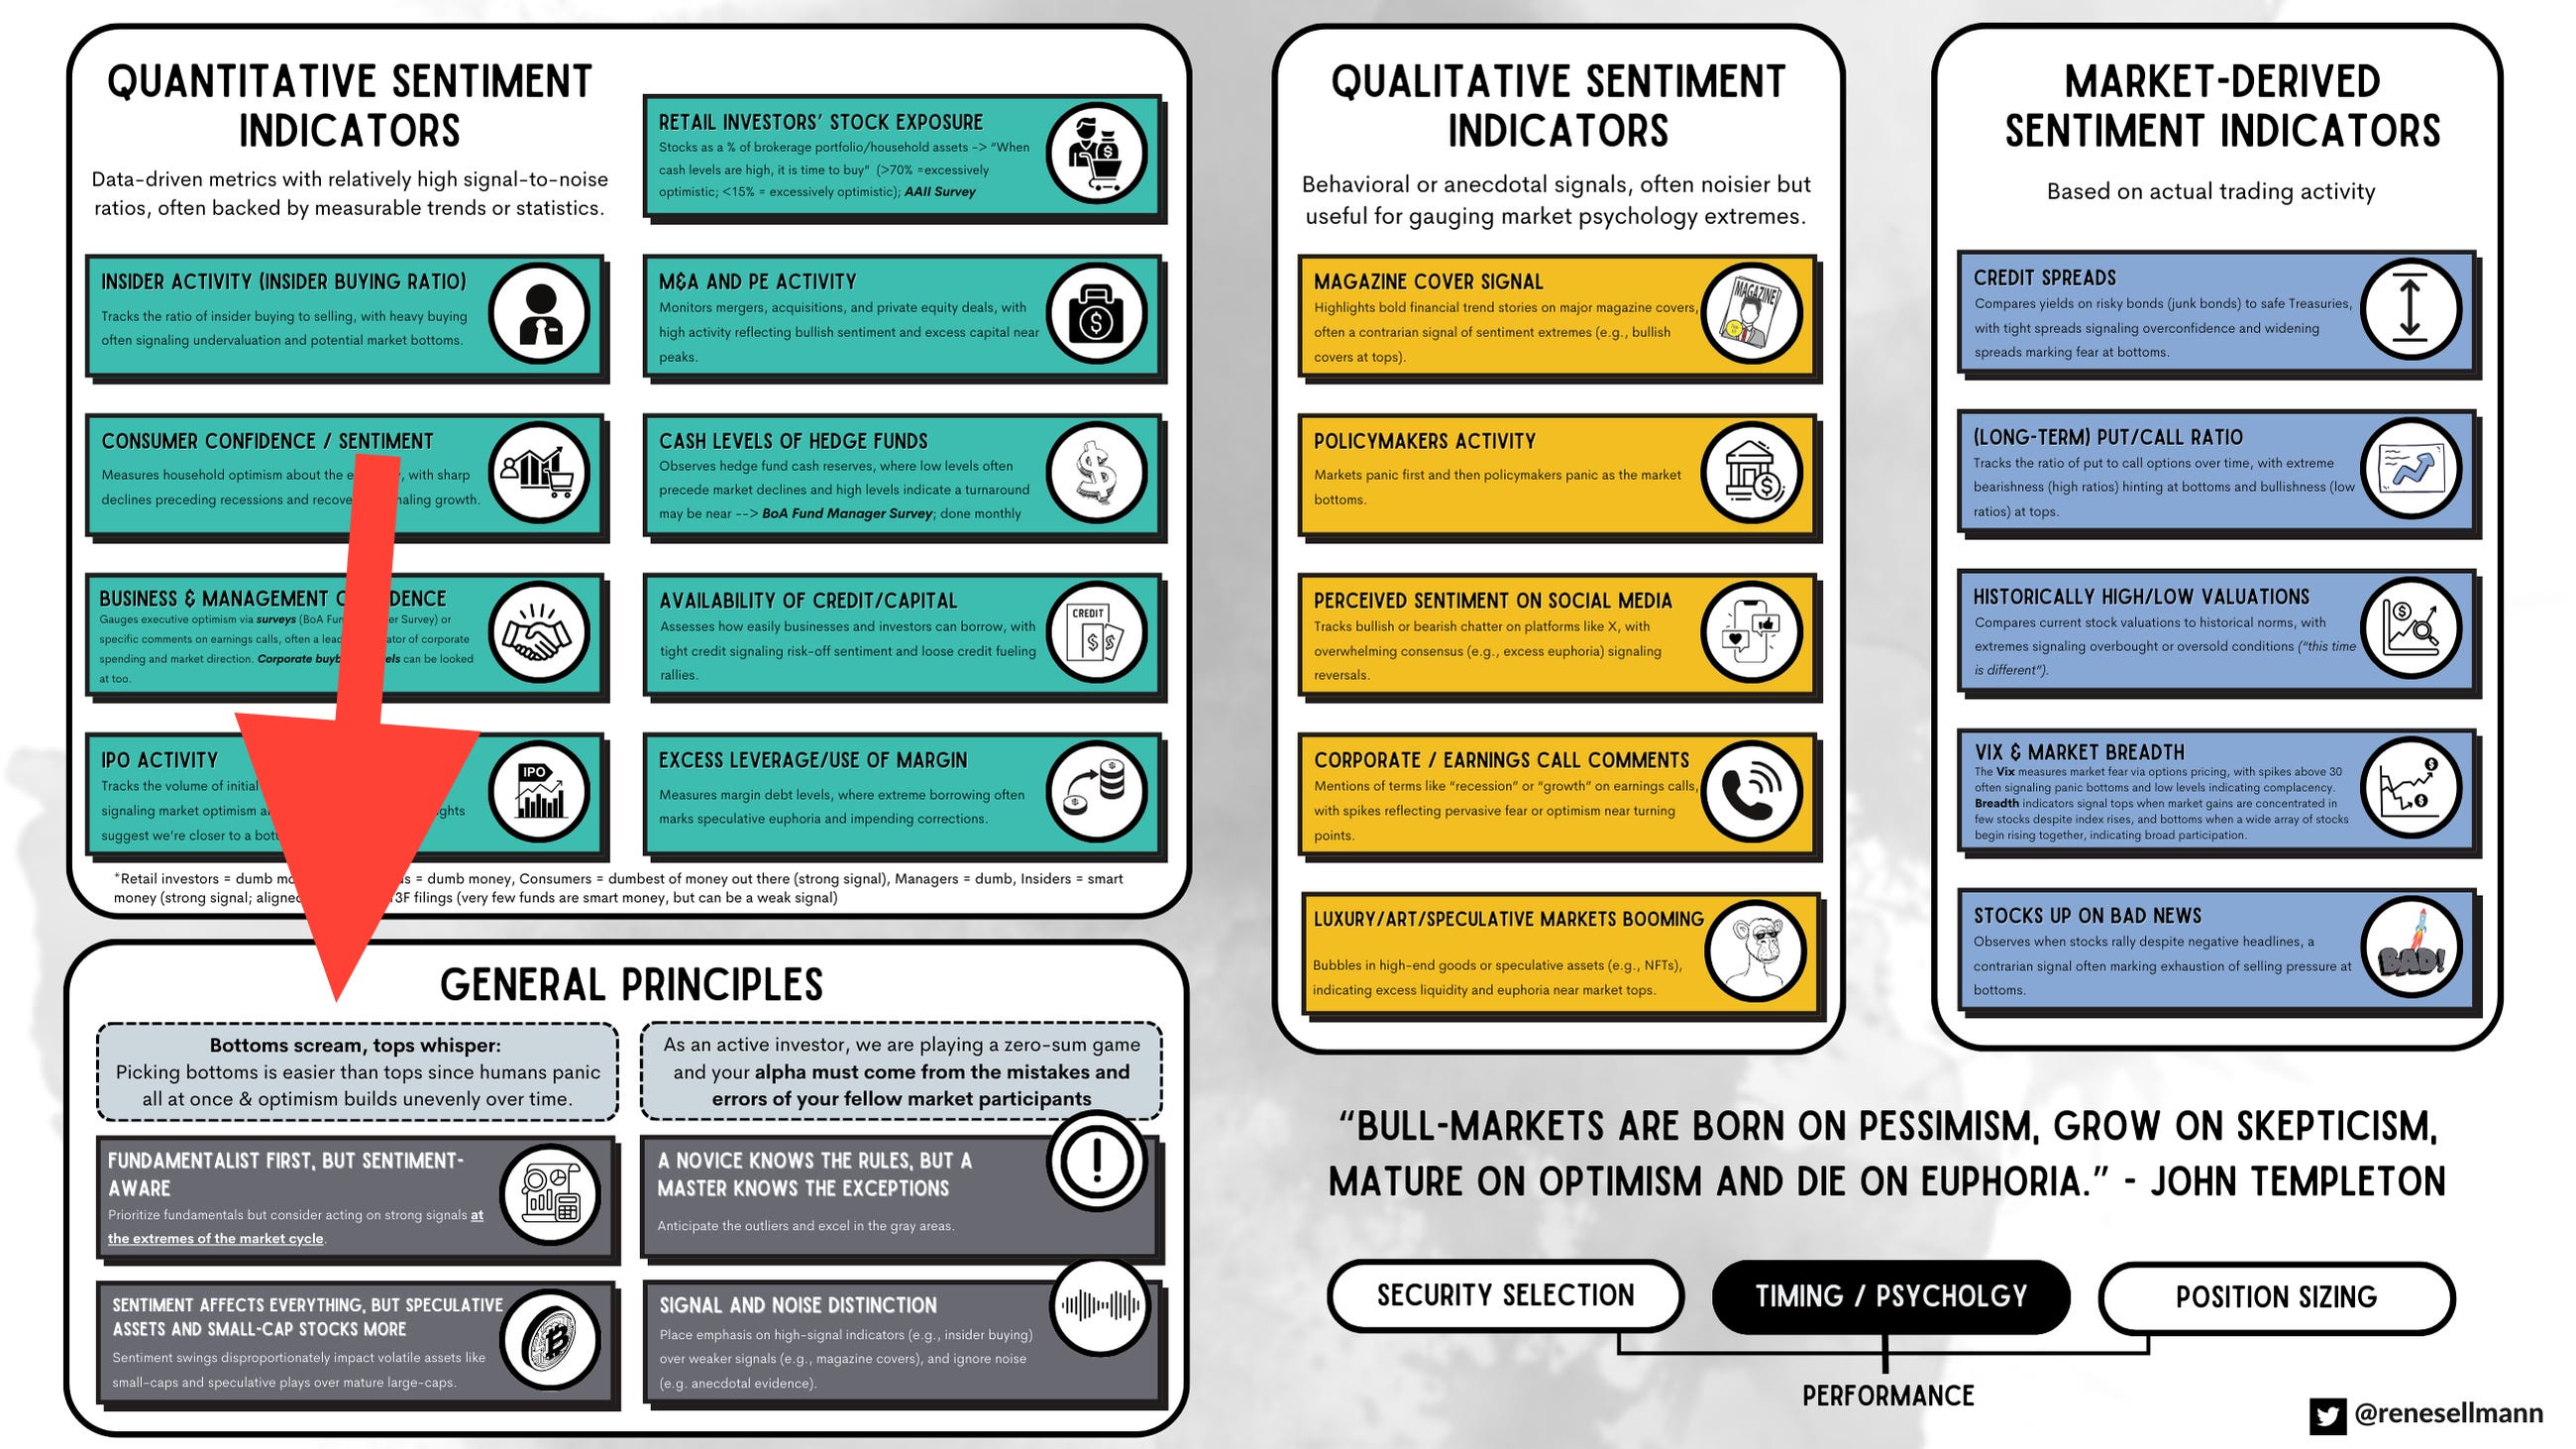
In the weeks since that piece, the whispers have moved somewhere considerably harder to look. Into special purpose vehicles. Into lease classifications. Into a single sentence about useful-life assumptions in an earnings call.
Before we start, let me deal with an objection I hear most often these days:
We cannot be in a bubble if this many people are calling it a bubble.
I don’t find that argument persuasive for a straightforward reason: you are not observing the market when you scroll your feed, you are observing an algorithm that has learned what keeps you engaged. Fintwit did not exist in 1999. It did not exist in 2007. The fact that your timeline is saturated with bubble talk tells you something about your timeline, your echo chamber, but very little about aggregate positioning.
And positioning is the thing. Saying you think the market is expensive costs nothing. What people are doing with their money looks quite different from what they are saying with their words. That’s one of the first principles I learned about Buffett - watch what he does, and not what he says.
In this piece, I want to discuss eight new signs that we may be approaching a market top and the end of the long-lasting bull run.
Here is the structure:
Systemic Leverage
When the Supplier Becomes the Customer’s Bank
The Cash Flow Machines Start Borrowing
Reading the Footnotes Instead of the Headline
Common Sense ROIIC Check – The Arithmetic Nobody Wants To Confront
The Electricity May Not Exist
The Customers Aren’t Getting Their Money’s Worth
Common Sense Test #2 – This Time: Valuation
Final Thoughts
Disclaimer: The analysis presented in this blog may be flawed and/or critical information may have been overlooked. The content provided should be considered an educational resource and should not be construed as individualized investment advice, nor as a recommendation to buy or sell specific securities. I may own some of the securities discussed. The stocks, funds, and assets discussed are examples only and may not be appropriate for your individual circumstances. It is the responsibility of the reader to do their own due diligence before investing in any index fund, ETF, asset, or stock mentioned or before making any sell decisions. Also double-check if the comments made are accurate. You should always consult with a financial advisor before purchasing a specific stock and making decisions regarding your portfolio.
1. System Leverage – Aschenbrenner Is Just One Anecdote
Aschenbrenner’s thesis was arguably right. Power, data centers, and memory were precisely where the money went in 2025 and the first half of 2026. What ended him was the financing structure sitting on top of that thesis.
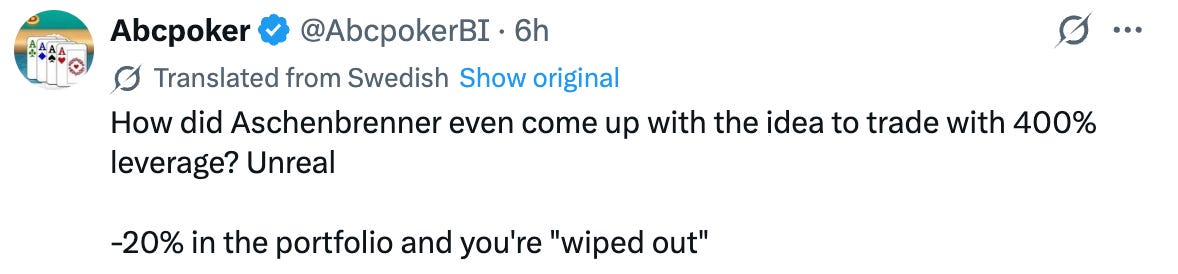
Run four times gross leverage and a 25% drawdown erases your equity. You lose the option of being right eventually. Your prime broker decides when the position closes, and makes that call during the worst week rather than the best one.
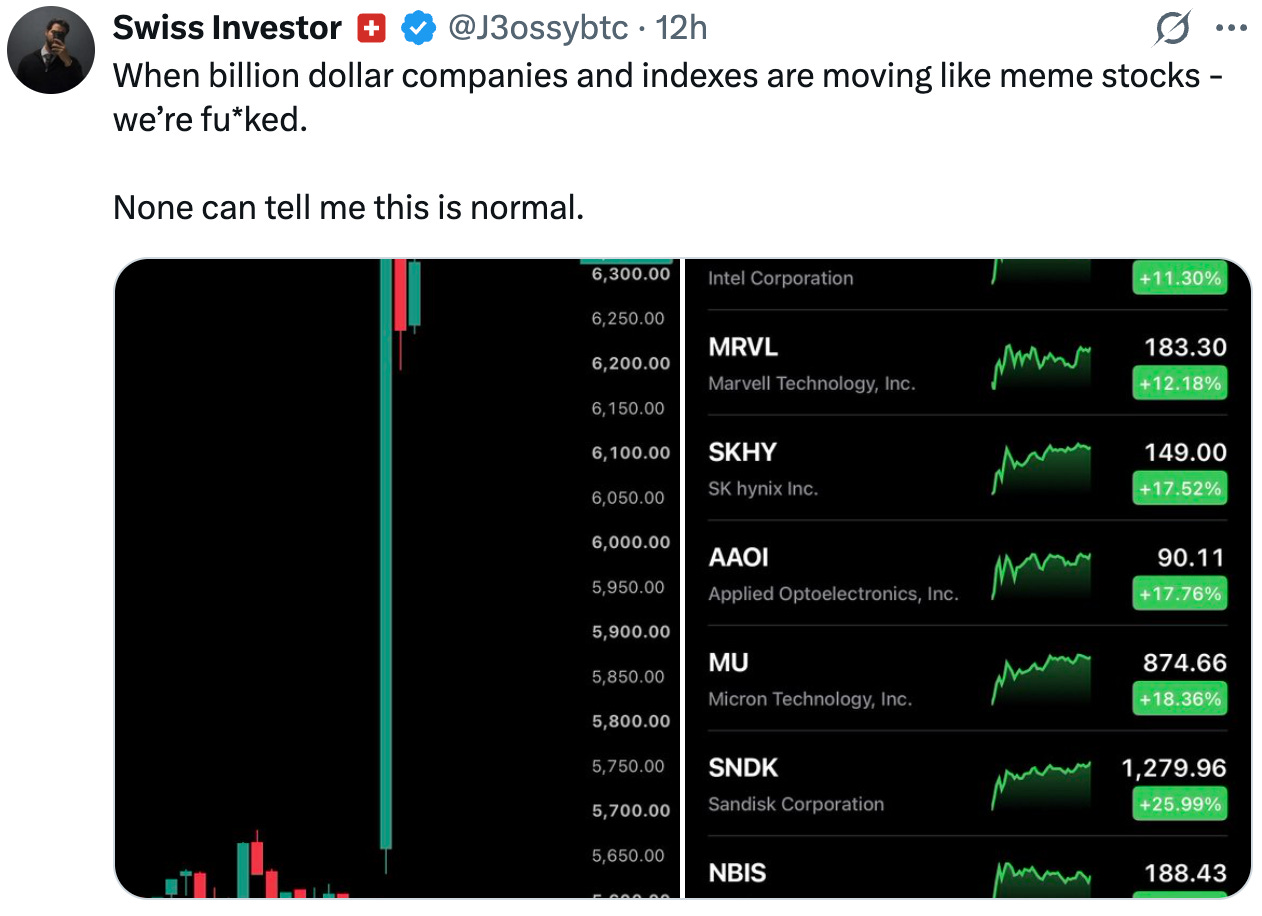
Note what did the damage. Korean semiconductors, specifically the pressure around SK Hynix’s US listing. In my June piece, I wrote about the KOSPI as a national index trading with the volatility of a micro cap, more than half its weight in two chip companies. Concentration of that sort is wonderful on the way up.
One fund blowing up may be an anecdote. I get that. But this isn’t a single incident. It is more systemic.
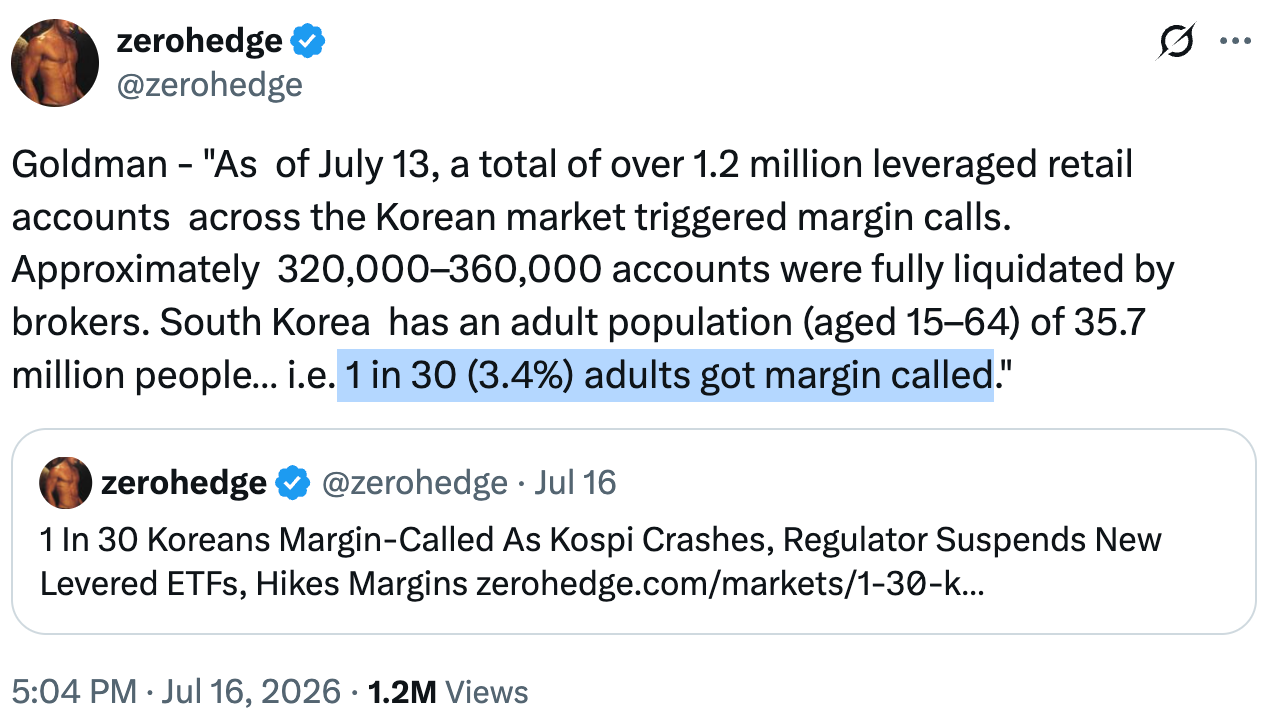
In mid-July, apparently, 1 in 30 (3.4%) adults got margin called.
FINRA margin debt, the total amount of money that investors borrow from their brokerage firms to buy stocks and other securities using their current investments as collateral, hit $1.502 trillion in June, an all-time high, up 51.5% year over year and still up 46.3% after inflation.
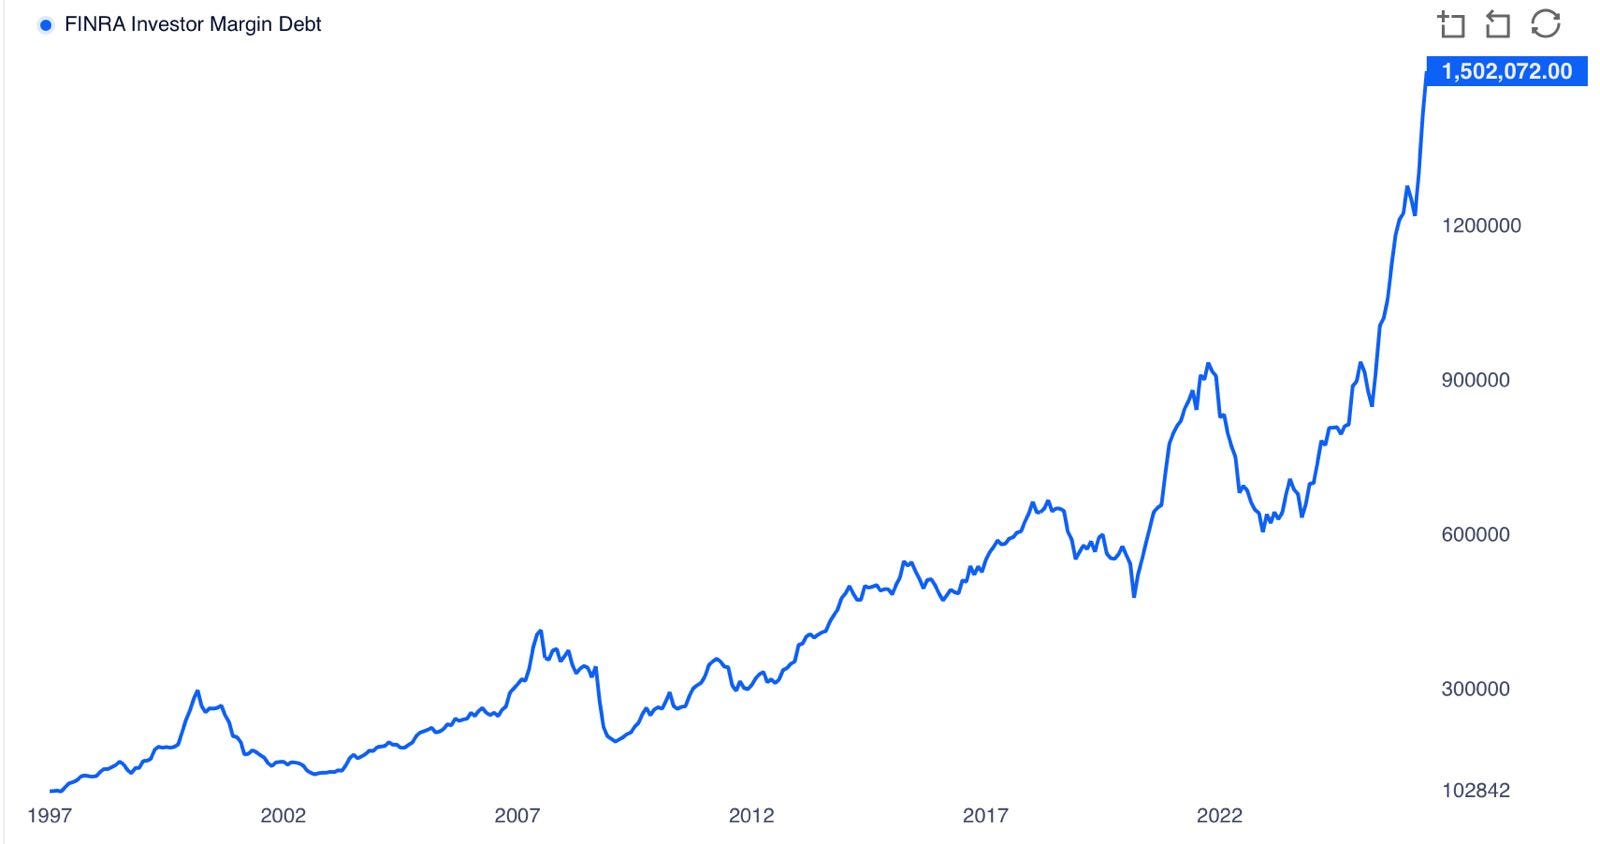
As I argued in June, this indicator on its own is a lousy timing tool. What it measures well is fragility, which tells you how violent the adjustment will be when things go south, without telling you when exactly.
And the metric above may even understate how levered up investors are, possibly badly, because it captures margin lending at broker-dealers while missing the leverage embedded inside the products retail increasingly buys as default exposure.
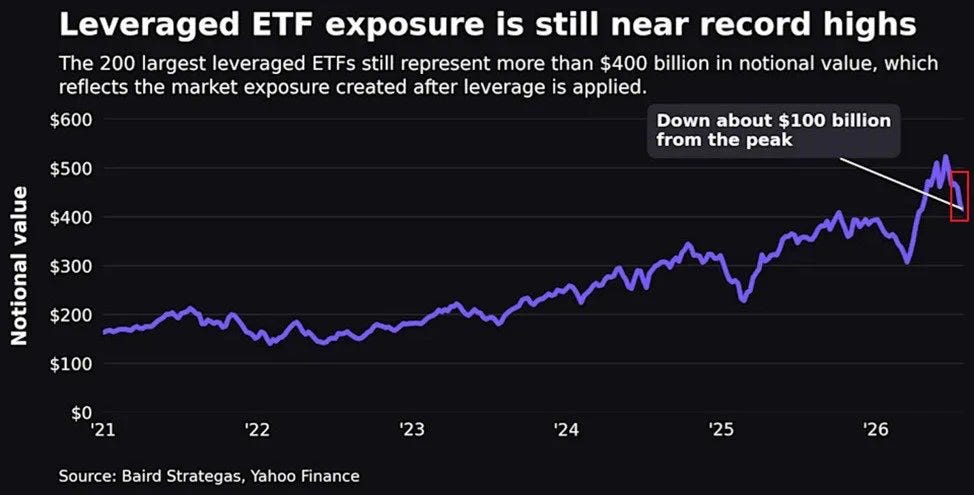
Nobody holding those products will ever get a margin call, and that is the problem. When an individual buys a leveraged ETF (like a 3x S&P 500 fund), the leverage exists inside the fund's structure via total return swaps and futures contracts. A daily-reset fund must thus rebalance at the close to maintain its target multiple, so it mechanically sells into declines. The forced selling still happens, on schedule, inside the fund, without anyone experiencing the moment of panic that would normally make an investor reconsider what they own.
When the market goes UP: The fund’s asset base grows faster than its debt/exposure ratio. To restore a 3x target for the next day, it must buy more exposure at higher prices.
When the market goes DOWN: The fund’s assets shrink faster than its exposure. To bring its leverage ratio back down to 3x (and avoid being over-leveraged for the next day), it must sell exposure at lower prices.
Related to this, I guess, Arne Ulland made an observation that stuck with me (read his thoughts here): watch how fast people dump enormous, established businesses on a single bad headline. Few built their position by understanding the firm well enough to hold through a bad quarter, so they use trailing stops, then buy back after the recovery. Li Lu once called rotation the rarest gift in investing. What we have instead is a market where much of the float is held by people who pre-committed to selling at a price rather than at a thesis, on record margin, in products that liquidate themselves on the way down.
A levered holder is not really a holder. They are a renter, and the margin clerk owns the building.
2. When the Supplier Becomes the Customer’s Bank
Nvidia is reportedly in talks to backstop as much as $250 billion so OpenAI can lease computing power from a ten-gigawatt project in Pike County, Ohio, with a separate arrangement to help finance OpenAI’s purchase of some $350 billion of chips. Bloomberg puts the total slate of fresh deals above $750 billion.
“Nvidia Corp. is working on AI infrastructure deals potentially worth more than $750 billion, including an artificial intelligence initiative with SK Hynix Inc.’s parent worth more than $500 billion.” - Bloomberg
Here is the number that made me put my coffee down (admittedly, I looked a little more shocked than in the image below) …

Nvidia’s own Q1 fiscal 2027 10-Q caps total lease-guarantee exposure at $3.5 billion.

A $250 billion commitment would run roughly seventy-one times the entire guarantee book it currently discloses.
How times can change.
The term “circular financing” gets thrown around frequently these days without much precision. A supplier provides capital, or a guarantee that unlocks someone else’s capital, to a customer, who then buys the supplier’s product. The supplier books revenue at shipment while the risk moves onto its balance sheet. Demand looks robust, growth looks organic, and the accounts record something economically closer to the supplier buying its own products with extra steps.
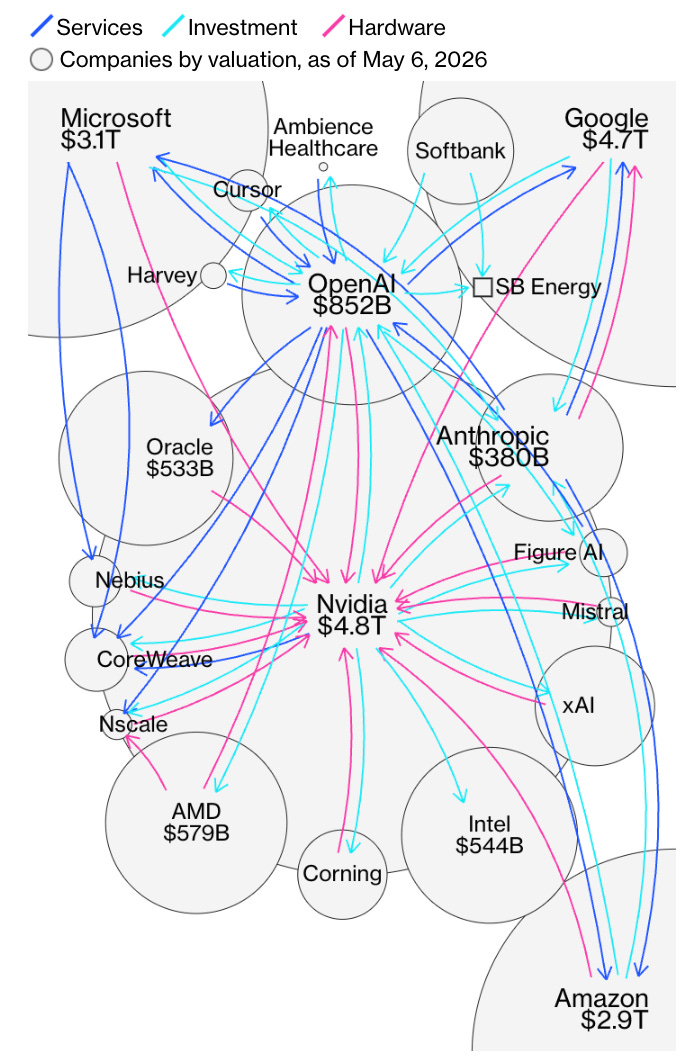
The bull response is that these arrangements are immaterial at Nvidia’s scale.
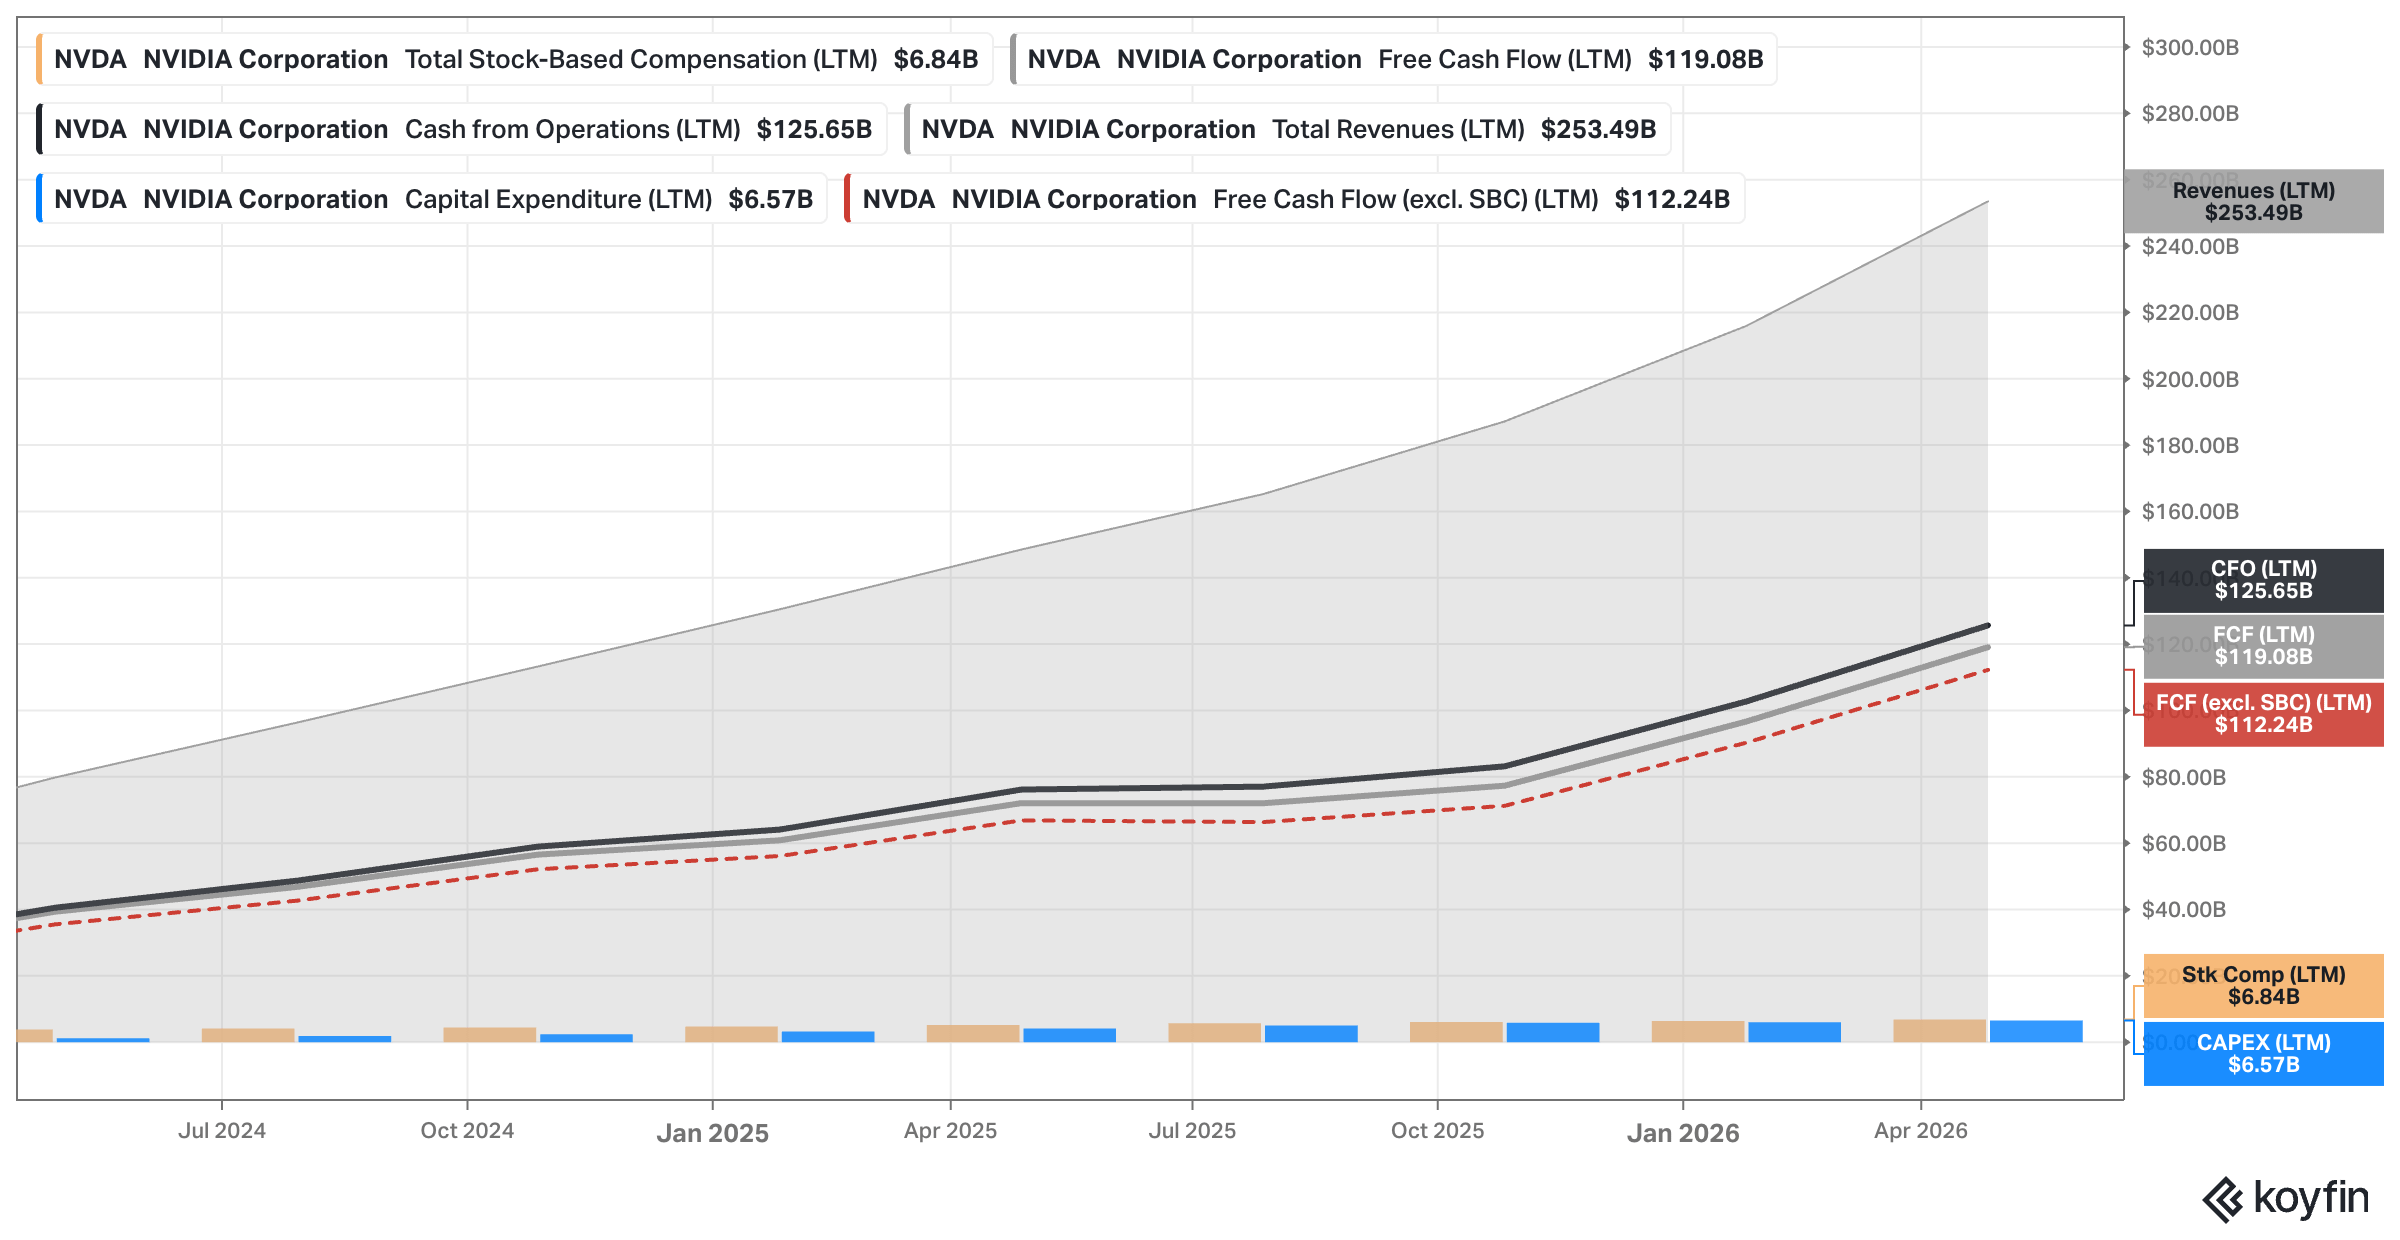
The writer behind Dirt Cheap Stocks gave the most economical rebuttal I have read in his piece from two months ago titled “Calling the Top“:
“if it’s immaterial, why would you engage in the behavior at all?”
We ran this experiment in 1999, when telecom equipment makers lent enormous sums to carriers so those carriers could buy equipment. Lucent alone committed $8.1 billion, and McKinsey later put nine suppliers’ combined exposure around $25.6 billion. The customers could never generate the revenue to repay, Lucent’s sales fell 69% from their peak, and it wrote off roughly $3.5 billion of customer loans.
The detail worth holding onto is what the vendors did as conditions deteriorated. When outside capital fled in early 2001, they accelerated financing rather than pulling back, because slowing down meant admitting the previous two years of revenue were partly manufactured. That entire nine-supplier complex committed about $47 billion in today’s money (accounting for ~80–85% cumulative inflation over the past 25 years).
In today’s instance, we are discussing one supplier contemplating $250 billion.
One other number in Nvidia’s filings stands out too: the share of its receivables tied to major customers has gone from an average of roughly 23.8% across fiscal 2020 to 2024 to about 64% in its latest quarter.
“Three direct customers accounted for 30%, 18%, and 16% of our accounts receivable balance as of April 26, 2026. Three direct customers accounted for 25%, 18%, and 13% of our accounts receivable balance as of January 25, 2026.”
Of course, during fiscal years 2020 through 2024, Nvidia’s business was far more balanced across PC gaming, professional visualization, and automotive clients, and as the generative AI boom accelerated through FY2025 and FY2026, Nvidia’s Data Center segment expanded to represent nearly 90% of total company revenue. Still, I find this a remarkable level of concentration.
Now, this heavy customer concentration is a direct structural byproduct of the hyper-consolidated AI infrastructure boom. Because training and deploying frontier AI systems requires tens of billions of dollars per quarter in capital expenditure, purchasing power is concentrated almost exclusively among a small circle of hyperscalers (widely identified by Wall Street as Microsoft, Meta, and Amazon) alongside key server integrators. Clearly, those are cash-flowing machines throwing of billions and billions in cash flow. But the required CapEx may be too much of a burden even for those players, which leads to signal number 3.
3. The Cash Flow Machines Start Borrowing
For fifteen years, the defining financial trait of big tech was that it did not need anyone’s money. Microsoft still carries a AAA rating, one of two left in America. That era has ended fast enough that most investors have not repriced what these companies now are.
Amazon, Alphabet, Meta and Oracle issued roughly $194 billion of bonds in 2026 through July 7 alone, according to Reuters' analysis, against about $108 billion in all of 2025. Meta’s October deal was $30 billion in one shot, the largest individual non-M&A high-grade bond sale on record. Oracle is the one to watch, sitting at BBB while participating in the same build-out as counterparties rated AAA. The marginal borrower always breaks first.
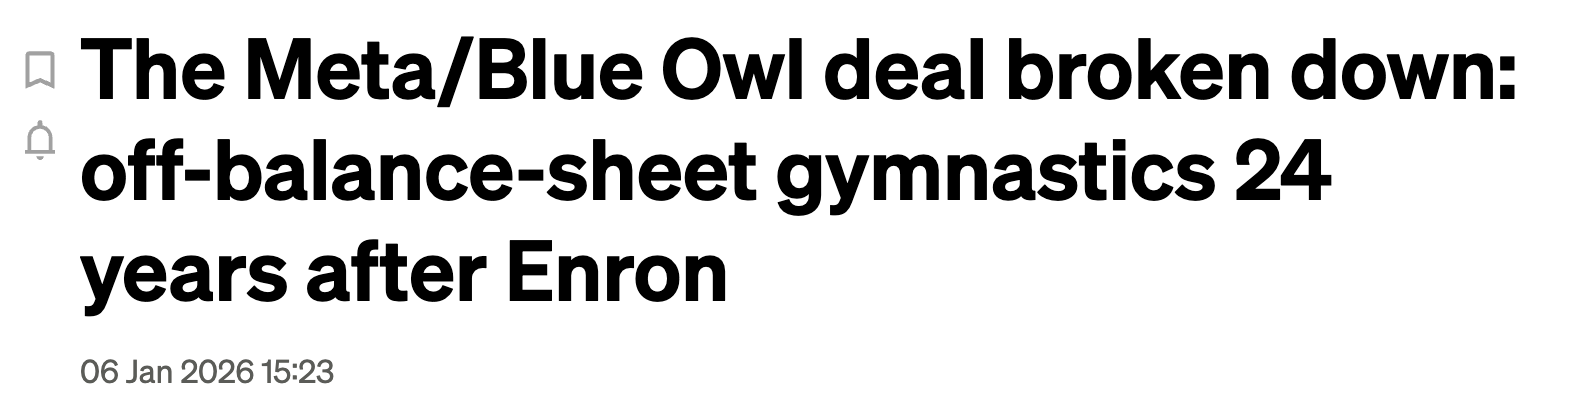
What concerns me more is largely invisible on the balance sheet. Meta’s Hyperion campus is financed through a vehicle called Beignet Investor LLC, which raised roughly $27 billion in private notes from Pimco, BlackRock and Apollo. Blue Owl holds 80%, Meta 20%. Because Meta is a minority partner, that $27 billion never appears as a liability in its accounts. It’s an off-balance sheet liability – another late-cycle symptom?
Meta also provides a residual value guarantee covering the first sixteen years. If the campus is worth less than an agreed threshold when a lease ends, Meta makes up the shortfall in cash. Read that again and ask who bears the asset risk. The debt moved. The risk did not. IFR (International Financing Review), about as sober a credit publication as exists, ran its analysis under the headline “off-balance-sheet gymnastics 24 years after Enron.”
“The contradiction at the heart of Meta’s Hyperion financing is between the bond ratings and Meta’s proposed accounting treatment. If you follow the cash, Beignet’s bond is almost pure Meta exposure. Meta funds the construction risk; Meta’s rent and Meta’s residual value guarantee service the debt; and Meta is the party that suffers if demand for AI computing disappoints.
If Meta ever walks away from the project, the RVG obliges it to write a cheque that, together with whatever the campus (or part thereof) can be sold for, makes bondholders whole. The RVG runs for 16 years and is triggered if Meta fails to renew a lease at expiry, terminates early or defaults under the lease. Any one of these leads to a payment of a “guaranteed minimum value” that is sized so the bond can be repaid, either from the underlying sale proceeds or directly by Meta. The final four years of the bond are not covered by the RVG but by a termination fee equal to the outstanding balance at that point.“ - IFR
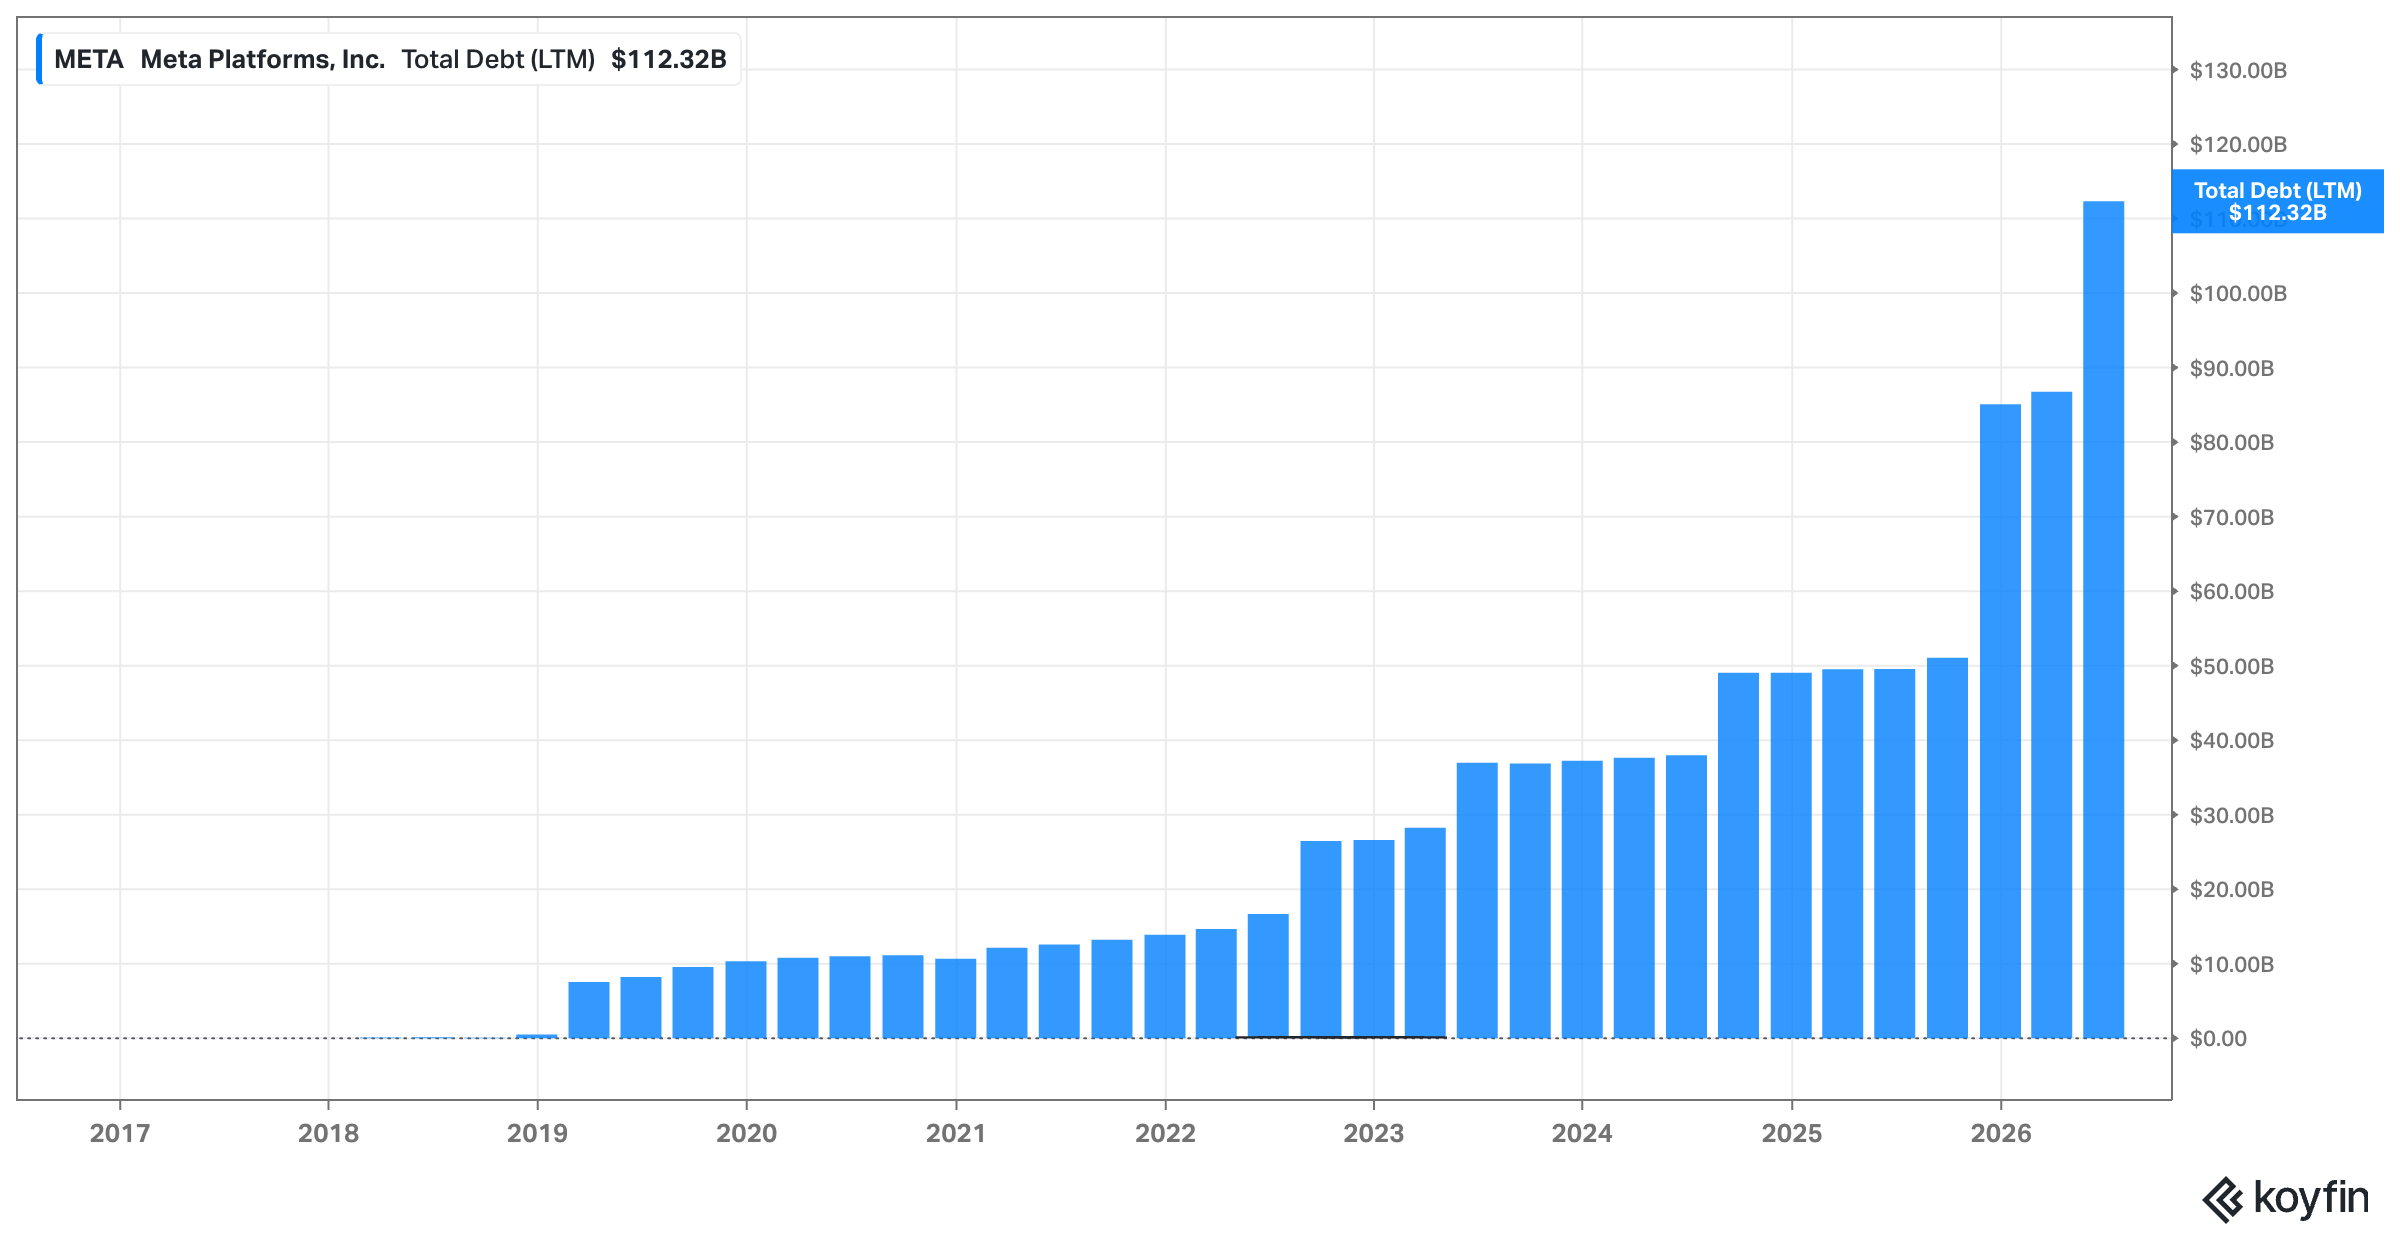
Debt has been trending upward across all Big Tech names …
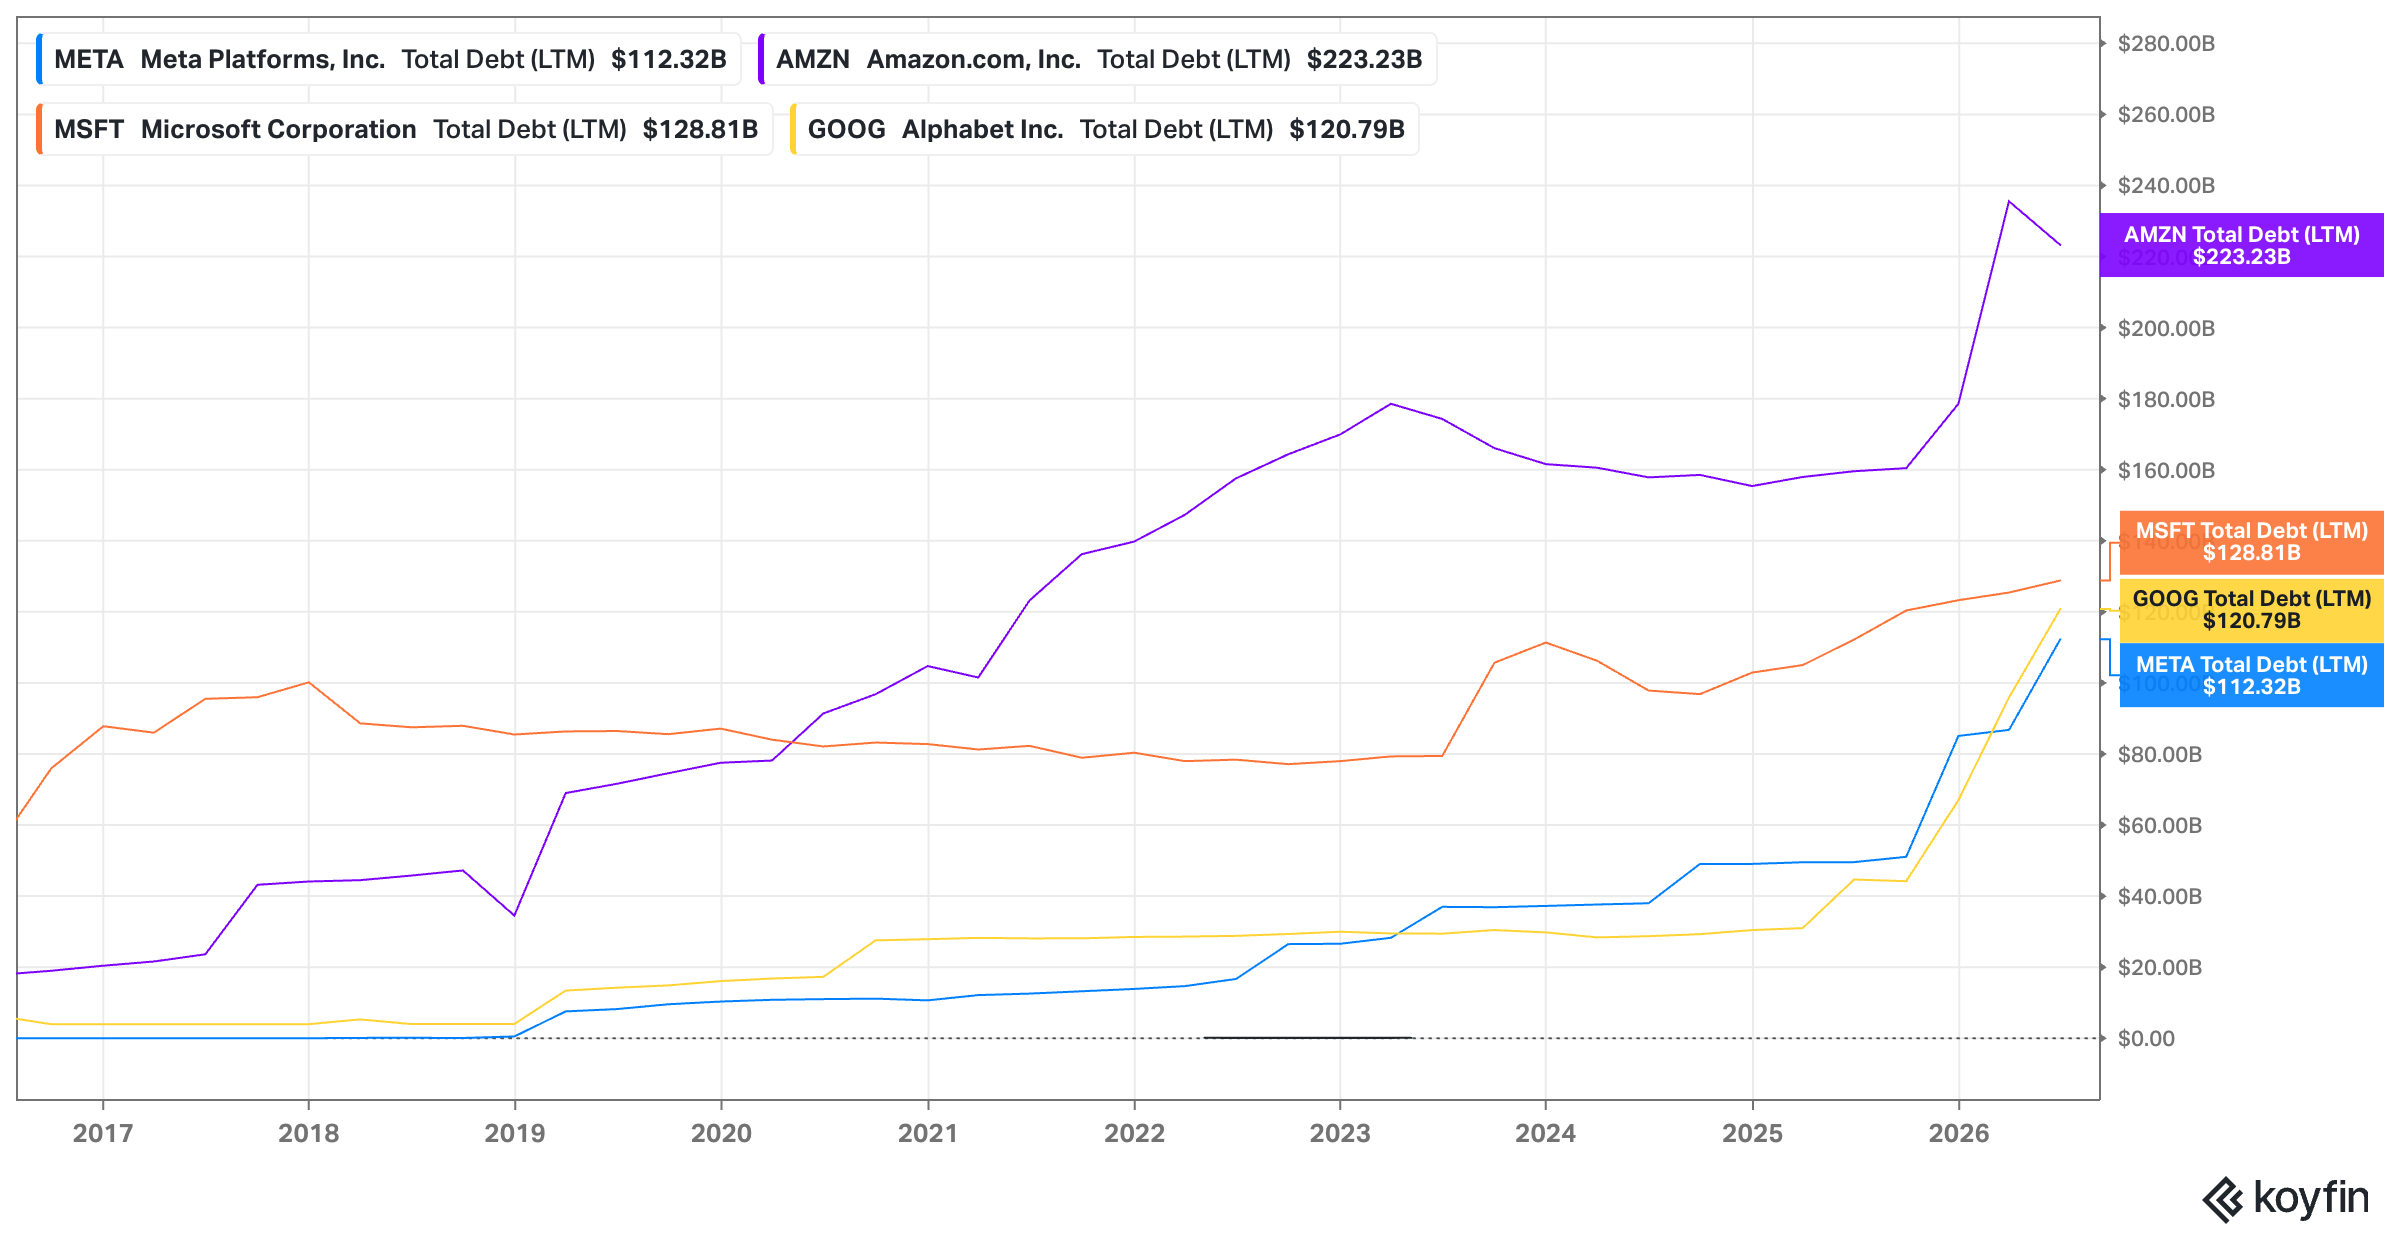
… and Meta stands out to me here as the quality of its balance sheet has deteriorated the most in terms of total debt recently.
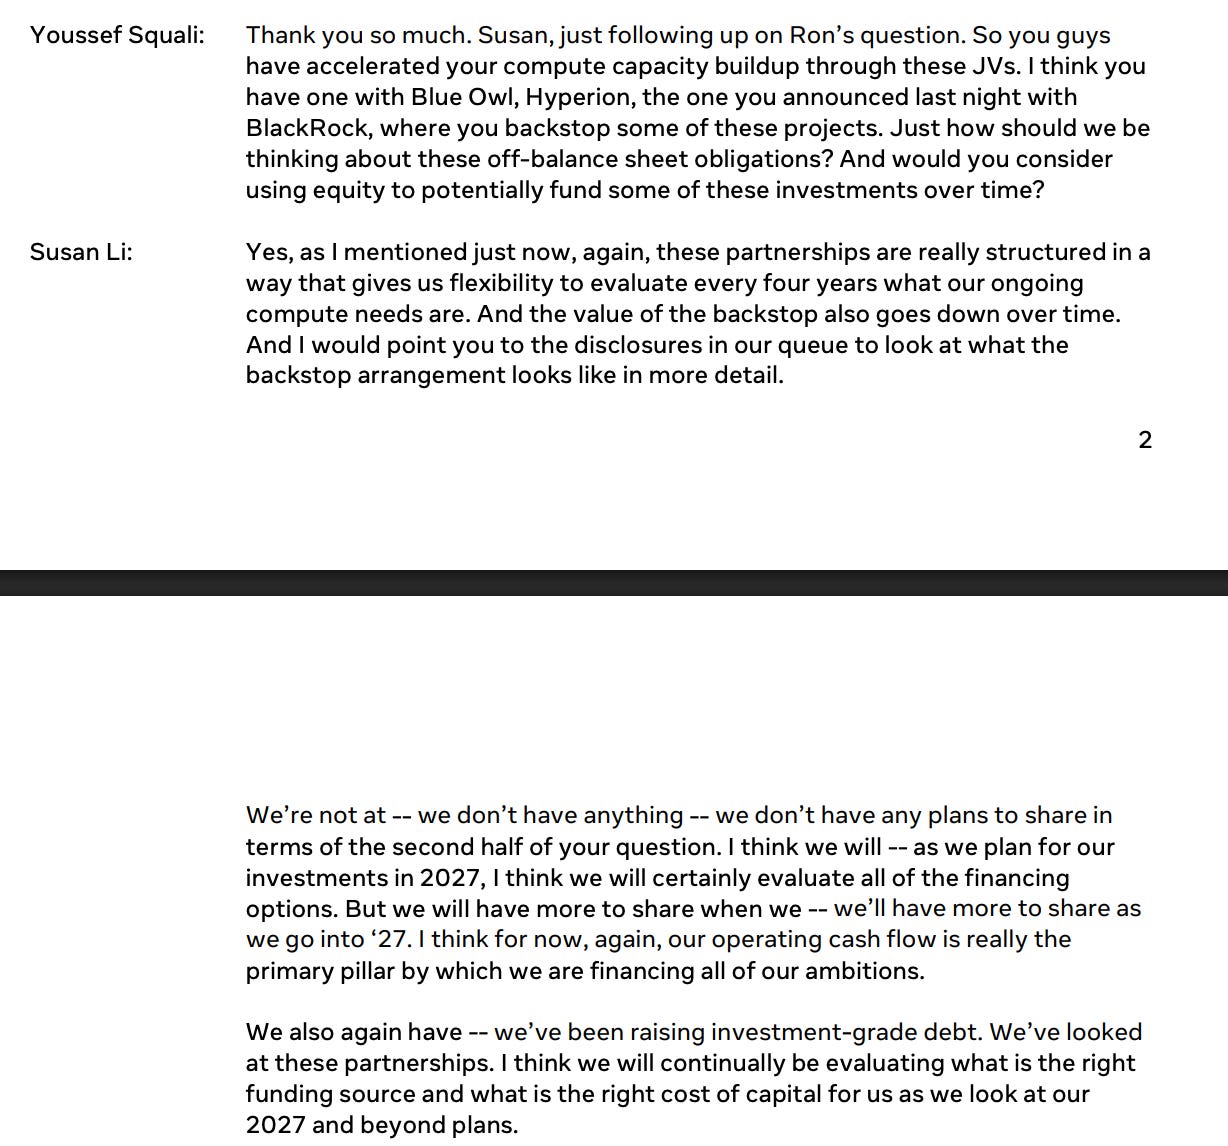
One exchange from Meta’s latest call is also worth your attention. Youssef Squali asked Susan Li directly about the growing pile of off-balance-sheet obligations and whether Meta would consider issuing equity to fund some of this. She pointed him to the disclosures and said they would evaluate all financing options for 2027. She did not rule out equity. A CFO with a comfortable funding picture rules out equity, because doing so is free and reassuring.
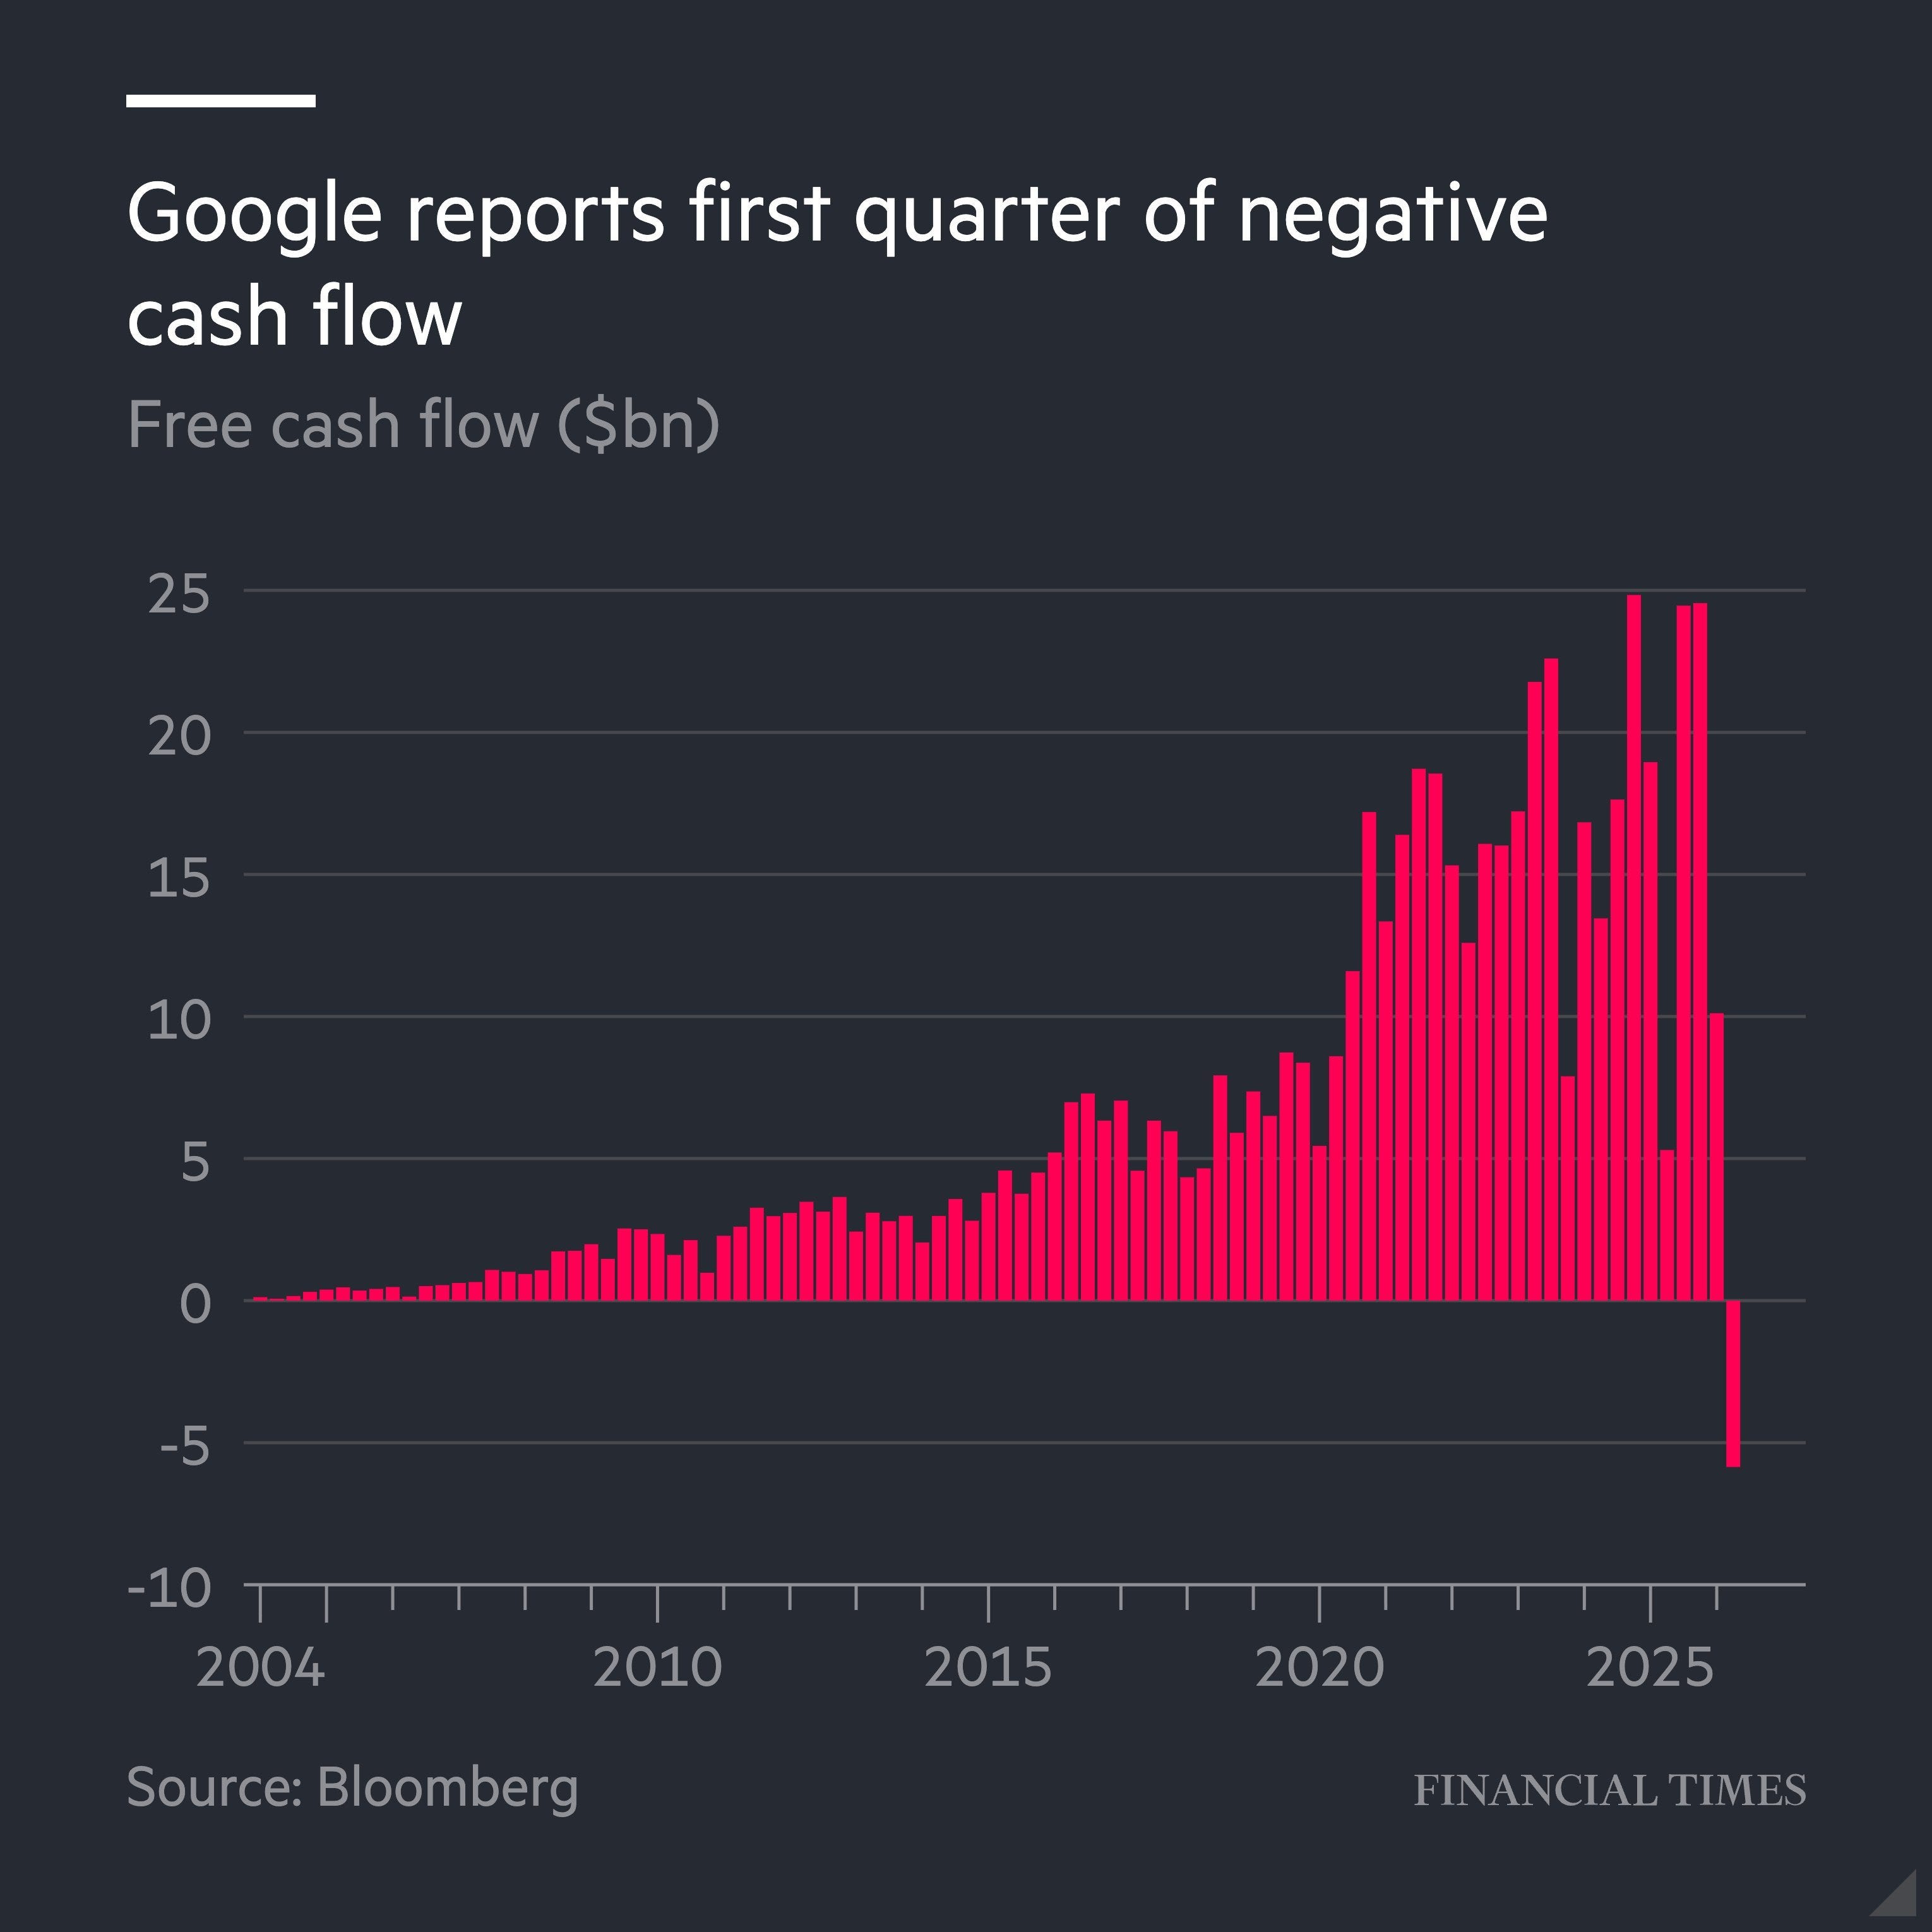
The reason shows up in the cash flow forecasts. Alphabet just reported its first quarter of negative FCF in its history.
Meta’s is expected to turn negative in 2026 and reach around negative $24 billion in 2027. Amazon’s is projected to be negative this year.
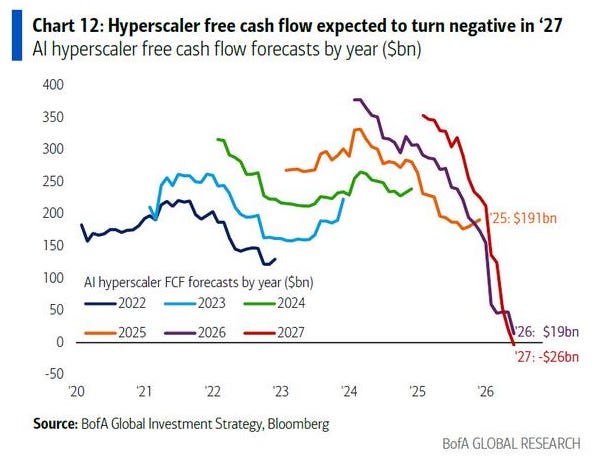
Companies do not borrow at this scale because borrowing is cheap. They borrow because internal cash no longer covers the plan.
4. Reading the Footnotes Instead of the Headline
Microsoft reported in late July and one of the headlines that was picked up by the investing media was a CapEx reduction, with 2026 guidance falling from roughly $190 billion to around $175 billion.
The stock rose after hours and the next trading day. Microsoft added nearly $450 billion in market value on Thursday, the largest one-day gain on record for a company. To be fair, it was a great quarter overall. Some coverage treated the CapEx cut as the first evidence of spending discipline from a hyperscaler.
Nothing was a real cut.
Effective at the start of fiscal 2027, Microsoft is extending the estimated useful life of its data centers and office buildings from 15 years to 25. That lowers annual depreciation and lifts reported earnings on assets it was building anyway. It also changes lease classification, moving future data center leases from finance leases into operating leases, and finance leases count in reported capex while operating leases do not. The $15 billion came out of the line item rather than the budget.
James Emanuel, who flagged this as one of the first in a Substack Note, asked the two questions I have yet to see answered.
Why this?
Why now?
Consider the same quarter’s other disclosures. CapEx including finance leases hit $41 billion, up roughly 70%.
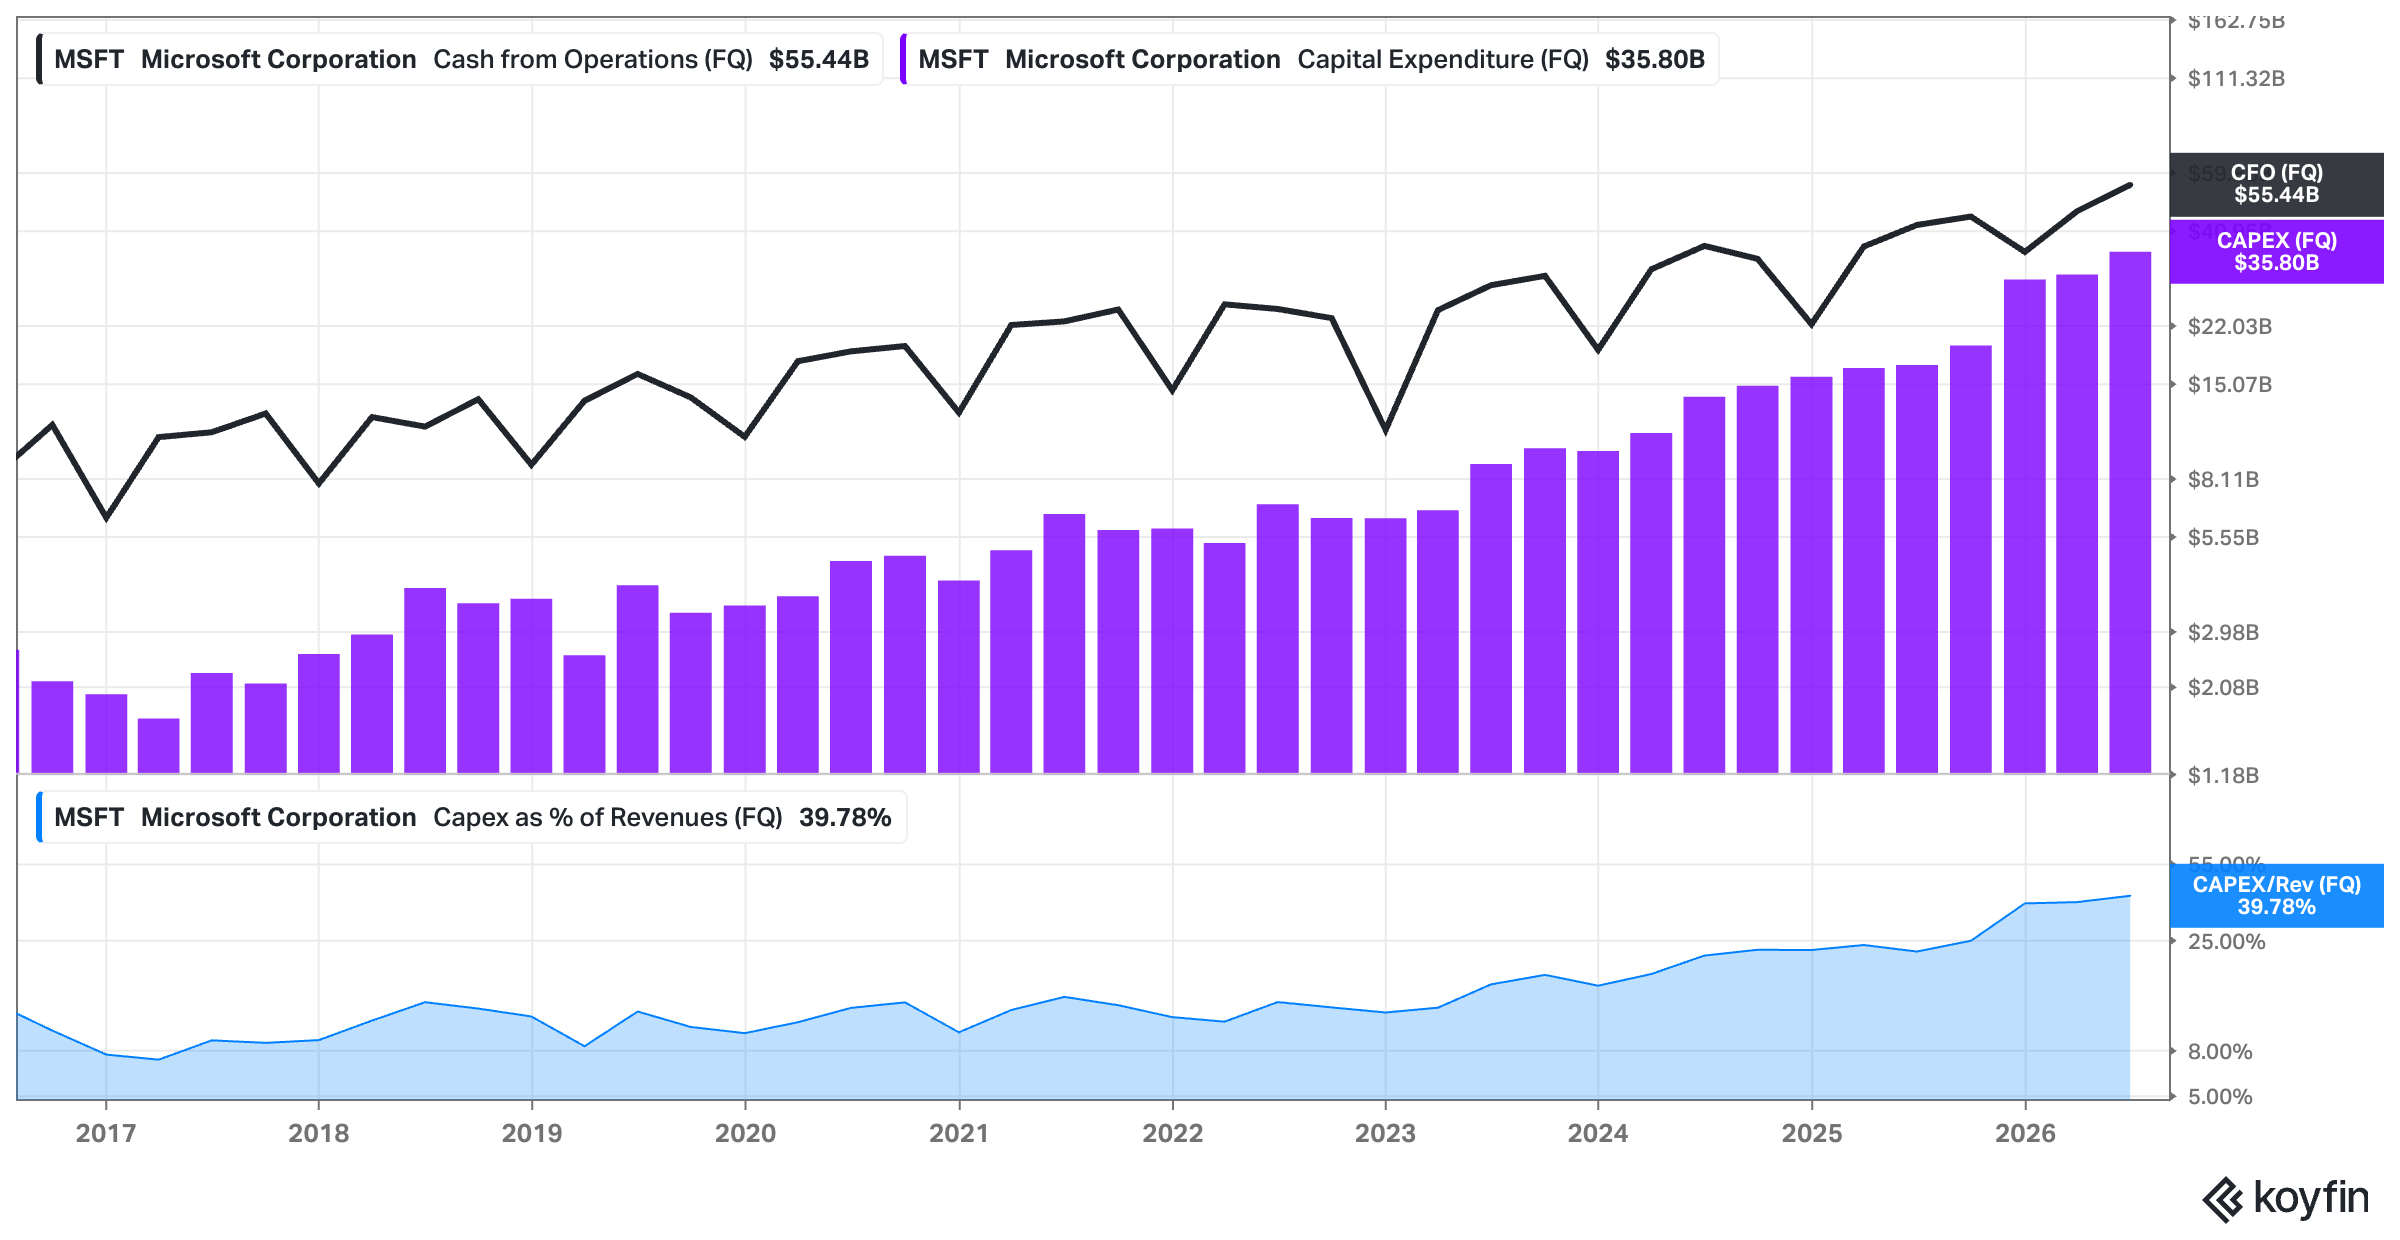
There is sort of a control experiment available. Effective January 2025, Amazon shortened the useful life of a subset of its servers from six years to five, citing the increasing pace of AI development, and accepted a roughly $0.7 billion hit to operating income for it. Servers are not buildings, and I want to be fair about that. Maybe that useful life extension is entirely justified. But when assumptions get adjusted, they mostly get adjusted in the direction that flatters the company and the income statement, and usually when it most needs the “help.”
Hence the practical takeaway, which is the most useful thing in this piece if you own any of these businesses, might be that for hyperscalers, the income statement has become the less informative of the two documents, because accrual accounting hands management wide discretion over depreciation, lease classification and capitalization.
Work from the cash flow statement instead, consider the free cash flow the company actually produces, and then adjust by hand: add back growth investments (maybe also from the income statement; e.g. R&D) and form your own view on how much CapEx is actually maintenance dressed as growth CapEx by comments made by management.
5. Common Sense ROIIC Check – The Arithmetic Nobody Wants To Confront
The four big hyperscalers – Amazon, Microsoft, Alphabet, and Meta – will spend somewhere around $700 billion on capex in 2026. Estimates range from $630 billion to $750 billion depending on definitions (might even be higher after recent guidance updates).
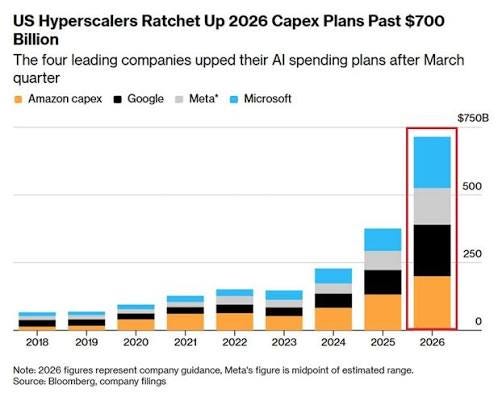
Against that, here is what they earn.
Alphabet made about $244 billion over the last twelve months
Microsoft $133 billion,
Amazon roughly $135 billion,
Meta about $68 billion.
Call it $580 billion combined.
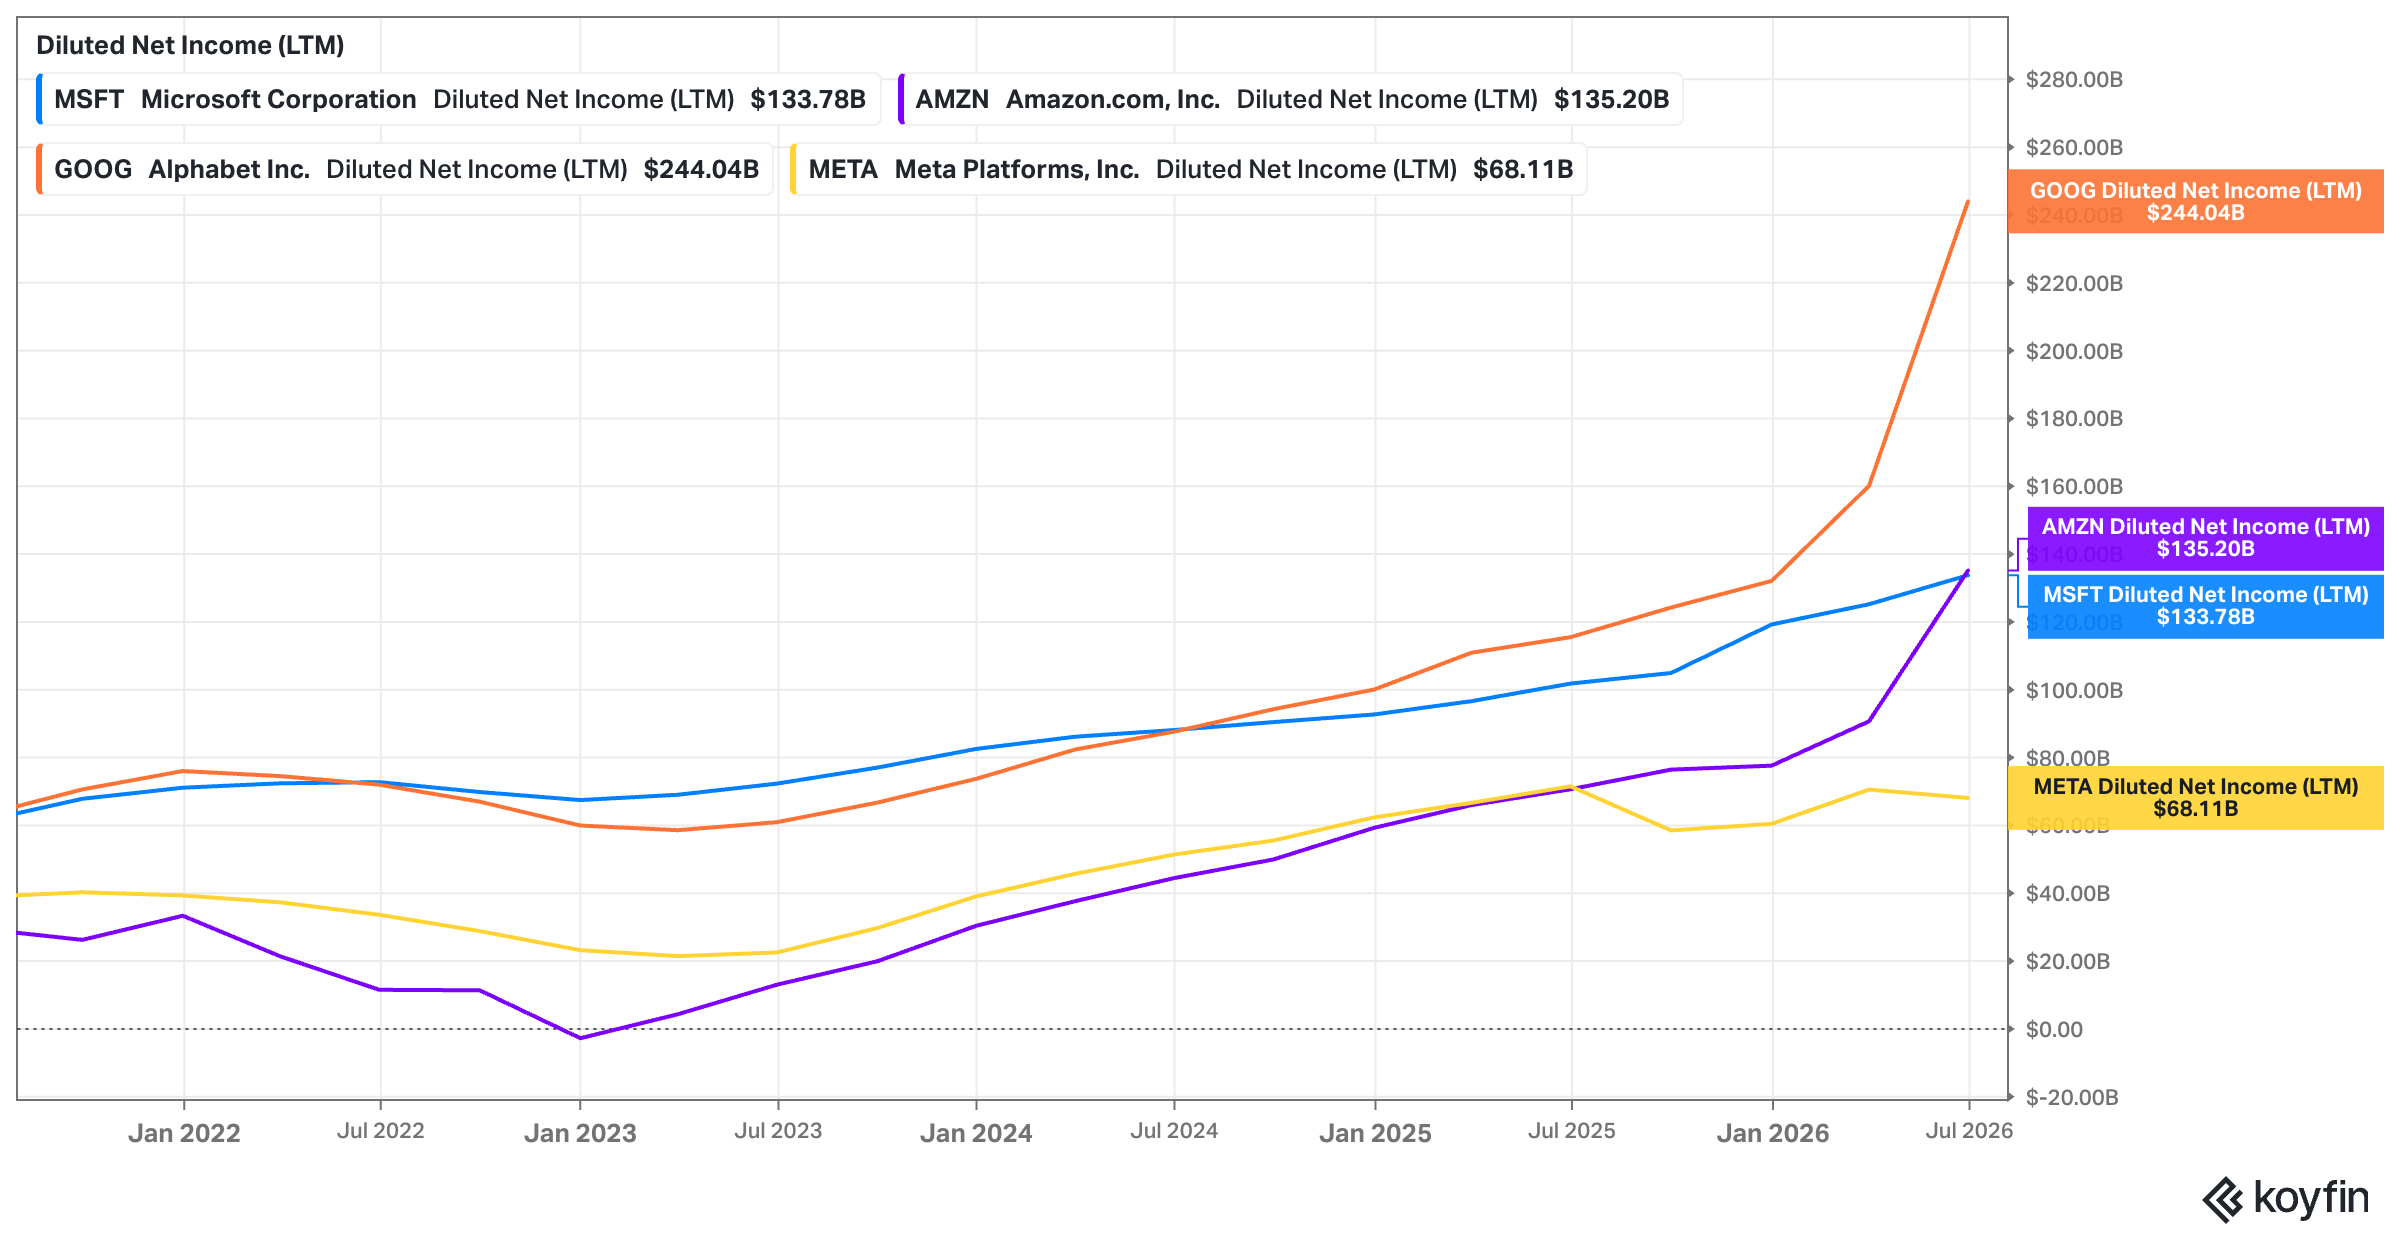
They are spending, in a single year, a little above 1.3x what all four of them earn.
Now run a back-of-the-envelope ROIIC calculation, which almost nobody in financial media seems willing to do out loud. A 15% return on incremental invested capital is a reasonable bar for businesses of this quality. On $700 billion, that requires about $105 billion of additional annual after-tax earnings in perpetuity, so combined profits would need to rise 18% and stay there, purely to justify one year of spending. And 2026 is not a one-off, with roughly $400 billion spent in 2025 and forecasts for 2027 higher still.
Let me be precise about what that actually means, because it is easy to get that wrong. It is a permanent step up in the level of profits. The 2026 spend does not require earnings to compound at 15% a year. But it requires them to be $105 billion higher, forever.
The trouble is that the steps stack!
The roughly $400 billion spent in 2025 needs $60 billion of permanent additional profit.
The 2026 spend needs another $105 billion.
And 2027 estimates from Evercore, Bank of America and Moody’s now sit above $1 trillion, which asks for a further $150 billion. Barclays has Google's 2028 CapEx alone at $500 billion.
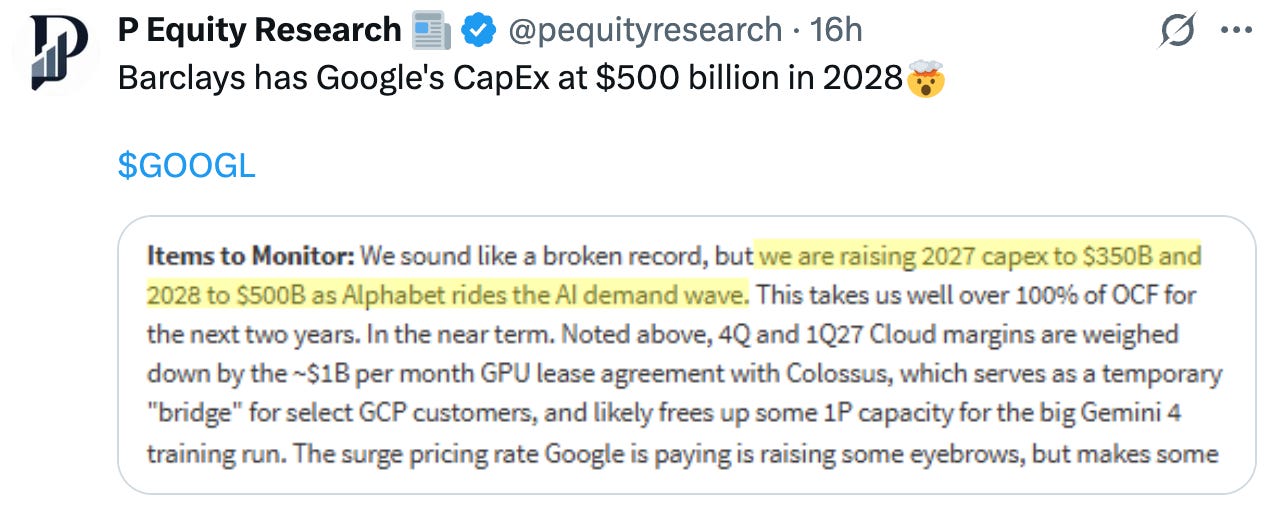
Three years of building, about $2.1 trillion, therefore requires some $315 billion of extra annual profit held in perpetuity.
And that assumes the spending stops in 2027, which nobody expects. Goldman models $5.3 trillion of capex across these four companies from 2025 through 2030. At 15%, that needs roughly $795 billion of incremental annual profit, putting combined earnings around $1.4 trillion.
The entire S&P 500 currently earns something like $2.3 trillion, so four companies would have to generate about half the index’s present profit pool.
There is a cleaner way to see why this might not work as advertised. Sustainable growth equals return on capital multiplied by reinvestment rate. Capex against earnings runs above 100%. But you cannot reinvest more than you earn out of what you earn, and that gap is precisely the bond issuance and the special purpose vehicles you start to see (discussed in #3).
A second framing avoids hurdle rates entirely. Depreciate $2.1 trillion over five years (which is too strict, I admit that, because data centers have a longer useful life than the servers, but let’s run with it for illustrative purposes) and you generate about $420 billion of annual depreciation, which exceeds what all four companies earned in 2025.
Some of that replaces charges rolling off older assets, so treat the figure as directional. The direction is not comforting, though, and it is exactly why the useful-life assumptions in the previous section matter. Lengthening the schedule is the main lever for making the income statement look attractive.
It changes nothing about the cash flow dynamics, though.
Maybe it works. AI is a genuine technology with genuine applications and I have no interest in pretending otherwise. But the burden of proof on that capital is enormous today.
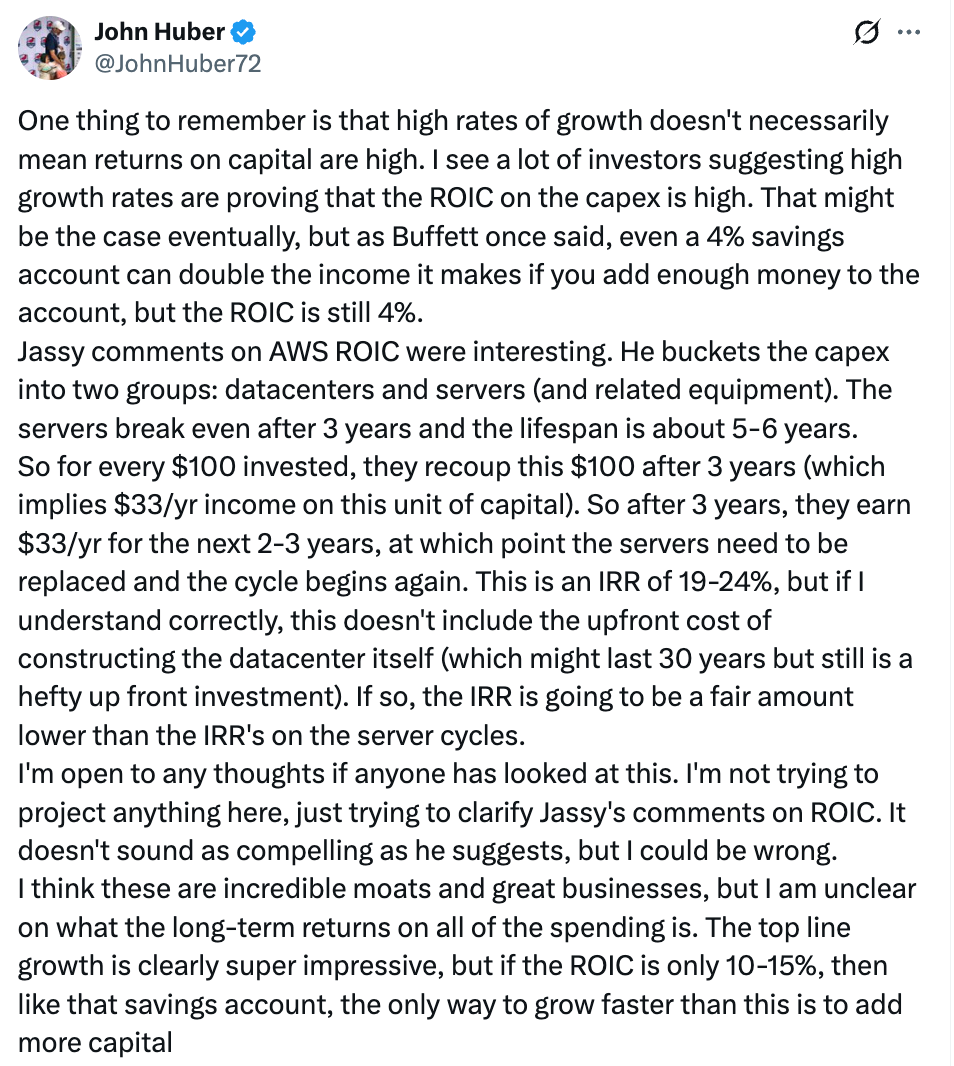
PS: John Huber shared some fantastic thoughts on this as well, adding some additional angles and perspectives to consider (check out his follow-up response in the comments as well):
PSS: I wrote about this before:
Big Tech's $5 Trillion AI Sinkhole?

In today’s tech landscape, we’re witnessing a bizarre, almost ludicrous race among the largest players in the space. Meta, Google, and Amazon seem to be locked in a competition to outspend each other in an attempt to capture the future of the digital economy.
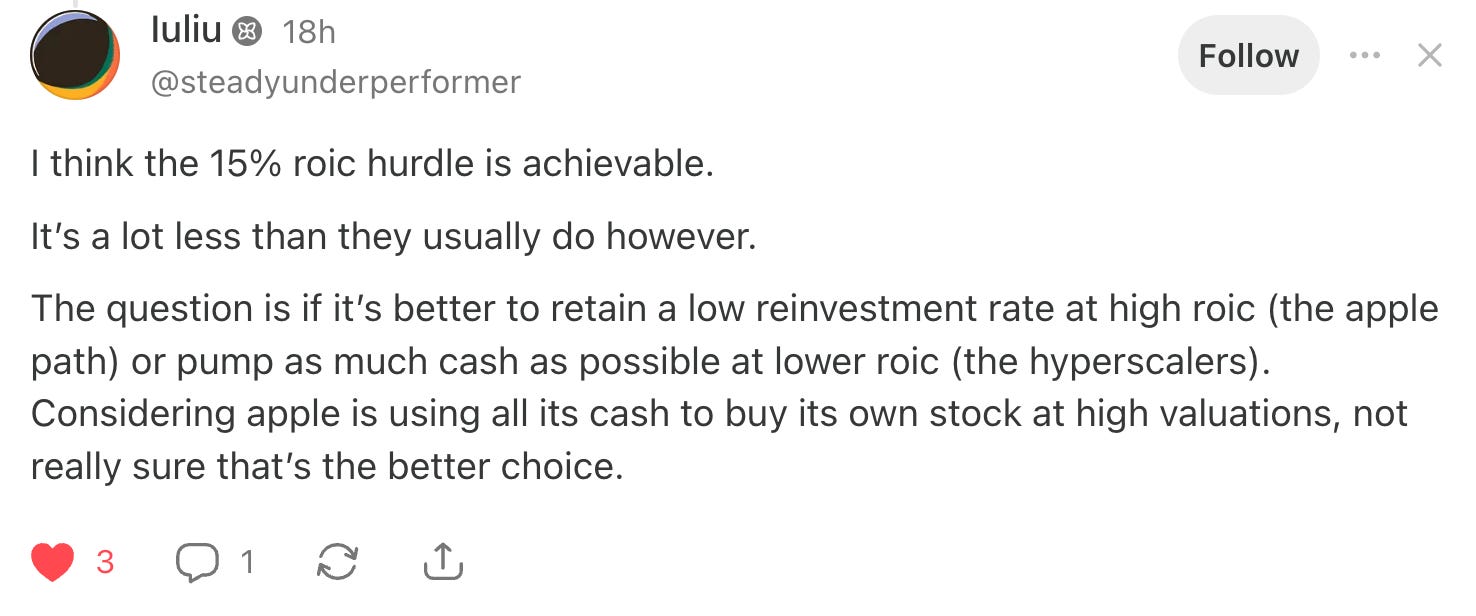
PSSS: An intelligent comment by Iuliu:
6. The Electricity May Not Exist
All of the above assumes the build-out can actually be completed, which is not entirely clear if you look at the physical supply chain.
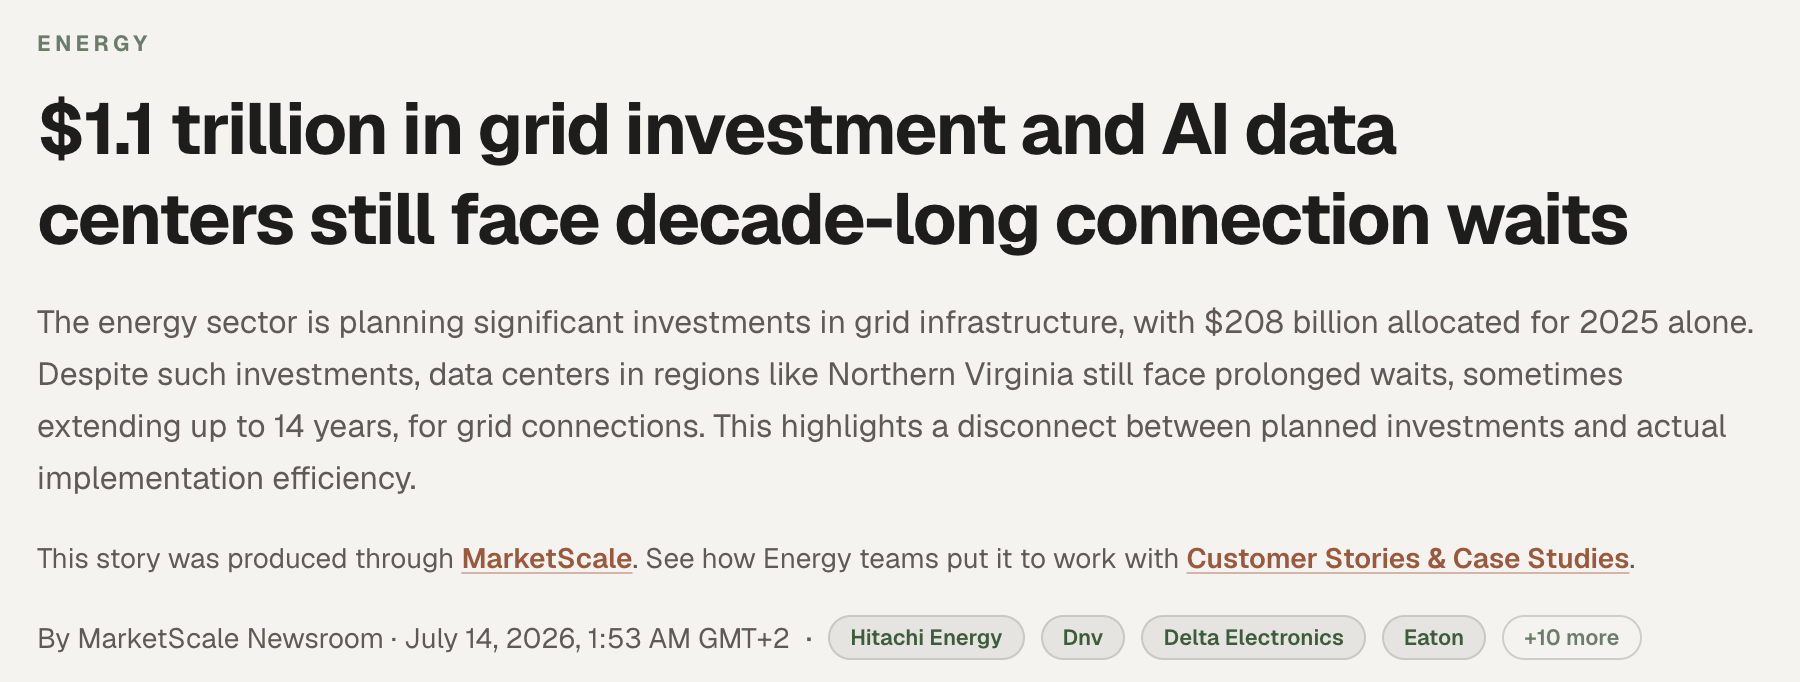
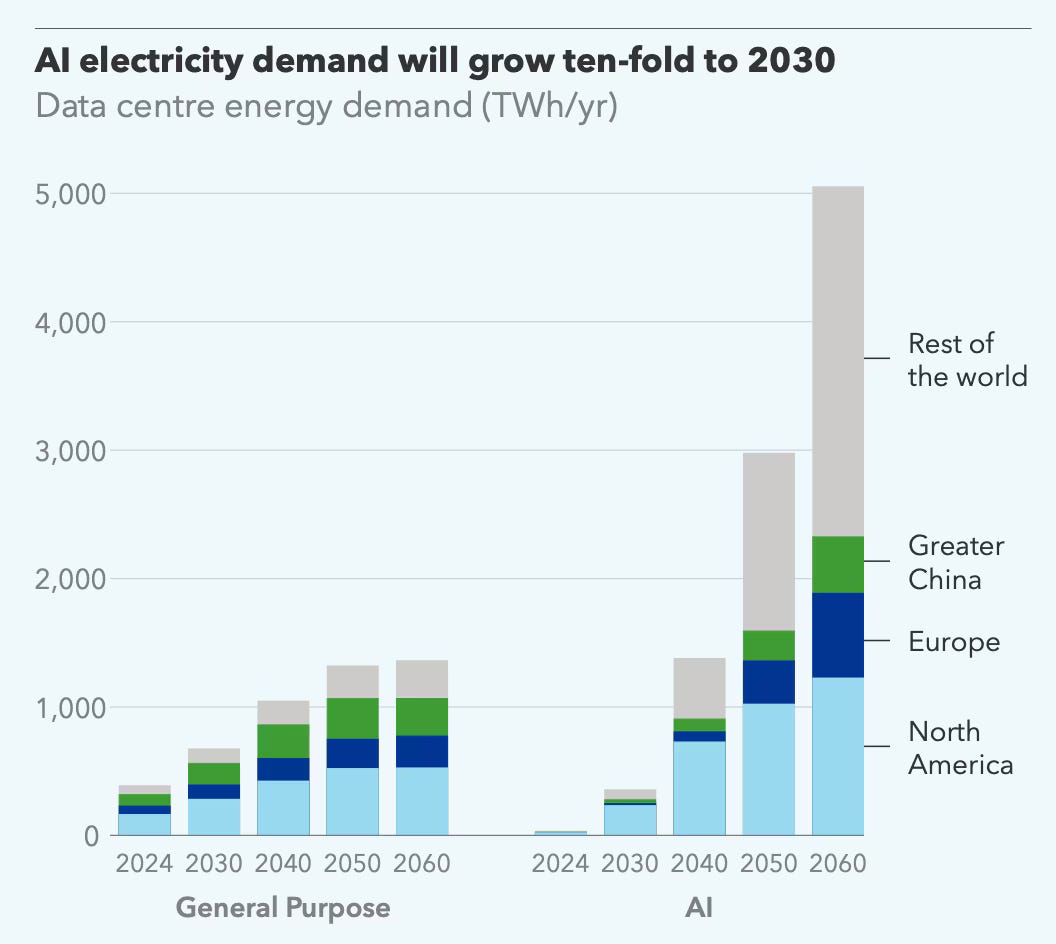
In Northern Virginia, Phoenix, and Dallas, where much of the announced capacity is being sited, waits for a grid connection now run four to seven years (and sometimes even extending up to 14 years).
Substation transformer, a large electrical device that changes voltage levels, transfers power between the grid and consumers, and maintains safe energy flow using electromagnetic induction, lead times have gone from about 140 weeks in 2023 to over 160 weeks today. Gas turbine backlogs at GE Vernova, Siemens Energy and Mitsubishi Power, who between them supply two-thirds of the gas plants under construction worldwide, now stretch as long as eight years. Grid operators are openly saying demand is growing faster than any historical trend they can model against.
Do you see the mismatch?
A GPU can be delivered in weeks. The electricity to run it takes years, and in the worst locations the better part of a decade.
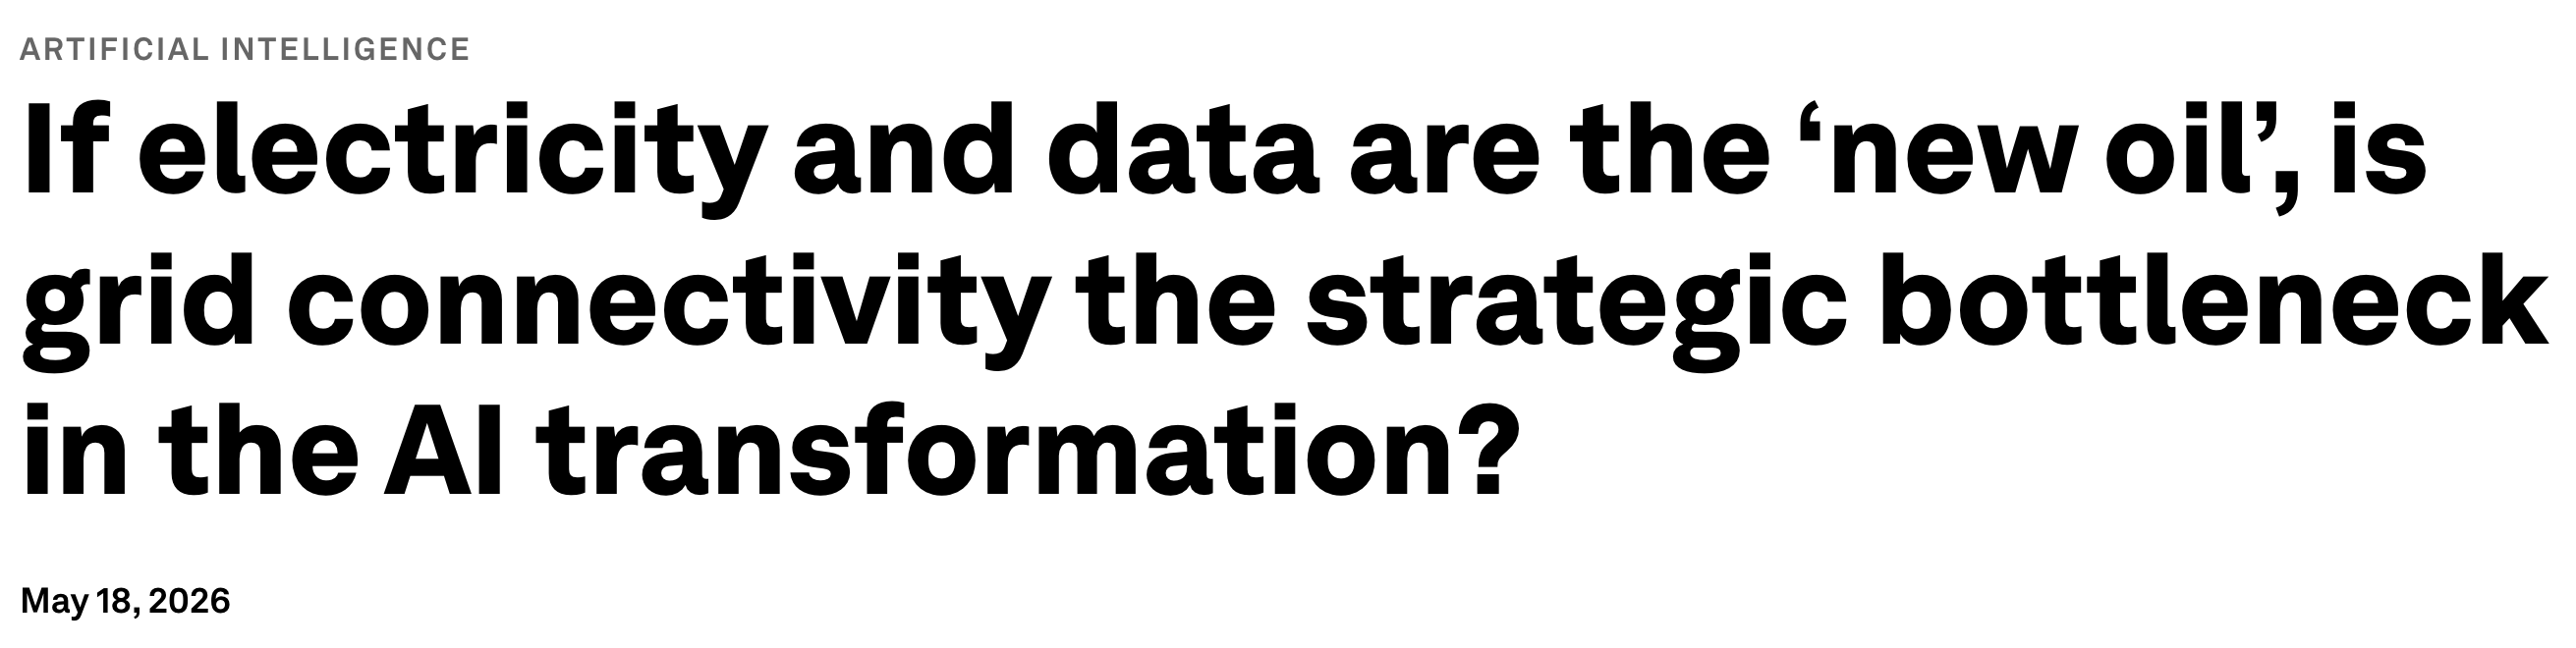
“Artificial intelligence (AI) technology is advancing at an extraordinary pace. At the same time, the computing power used to train frontier AI models has been doubling every five to six months. Unlike the semiconductor scaling that defined previous technological eras, this growth is driven not by shrinking transistors but by deploying ever-larger chip clusters.
Combined with the scale of investment in data and computing infrastructure, this progress is already transforming entire industries. But the energy system must keep pace for progress to continue. This shift from silicon efficiency to physical scale is precisely why grid connectivity has become the binding constraint.“ - weforum
That GPU begins depreciating the day it is finished putting together, on a five or six year schedule, which is shorter (!) than the interconnection wait in three of the largest data center markets in America. Depreciation does not pause while you wait for a transformer.
The politics are turning too. The Economist has asked whether the data center backlash will derail the boom, reporting that opposition has made suitable sites genuinely hard to find, and the environmental argument got harder to wave away once Google and Microsoft both walked back carbon commitments to accommodate the build.
If you go back to sign #6, the hurdle to clear 15% ROIICs in light of these constraints may get harder.
In fairness, delayed is not cancelled, and hyperscalers have flexibility about where they build. Data centers in space are proposed, which are orbital facilities designed to handle energy-intensive computing and AI workloads using continuous solar power and radiative cooling, driven by companies like SpaceX and Blue Origin.
But there is the potential that the returns arrive later than underwritten, and where the asset depreciates whether or not it is plugged in, later is expensive.
7. The Customers Aren’t Getting Their Money’s Worth
Some of the signs above discussed so far concern the supply side.
But none of those concerns matter much if the demand is not genuinely there
So the question that decides this is whether enterprises buying AI services are actually getting a return. And it seems like there is more skepticism these days, in some organizations at least, compared to 12 to 24 months ago.
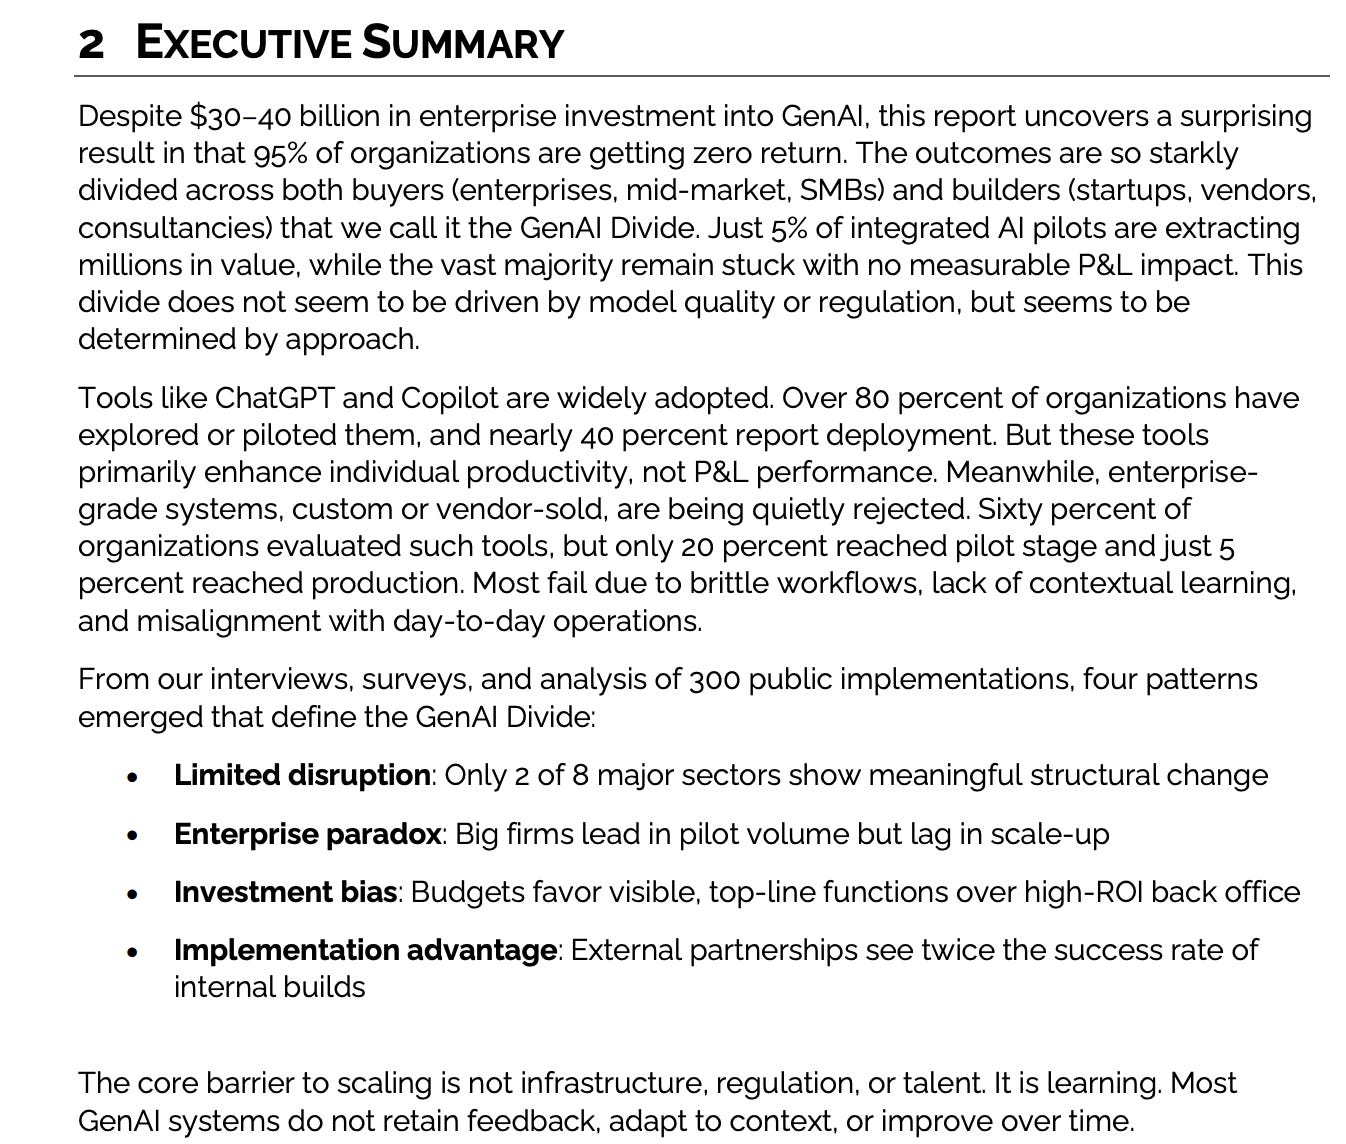
An MIT study drawing on 52 executive interviews, surveys of 153 leaders and analysis of 300 public deployments found that roughly 95% of enterprise generative AI pilots delivered no measurable impact on profit and loss.
“Zero return.”
S&P Global found 42% of companies abandoned most of their AI projects during 2025.
“The percentage of companies abandoning the majority of their AI initiatives before they reach production has surged from 17% to 42% year over year, with organizations on average reporting that 46% of projects are scrapped between proof of concept and broad adoption“
You can quibble with any single study, and you might want to take a look at the underlying methodology, but it seems like there is a growing, serious body of evidence – beyond anecdotes – pointing towards similar findings
The case study of Ford may be brought up here too, just because it might even make you laugh out loud …
WHAT WERE THEY THINKING?
The company pulled experienced staff off quality control and replaced them with AI, and has since been recalling those workers because the AI was less concerned about quality than the people were.
One anecdote, granted, though the kind that tends to appear at the front of a trend.
There is arguably a structural reason so much of this went ahead, and it has little to do with clear and visible ROIC thresholds being hit. Many large enterprises piled in partly because they believed their own investors expected to see it. Announcing an AI initiative, and declining to announce one was expensive from a reputational point of view or may negatively affect stock prices of publicly listed firms. That produces enormous spending never underwritten to a return, which is the first spending to go when budgets tighten.
Two more details worth highlighting:
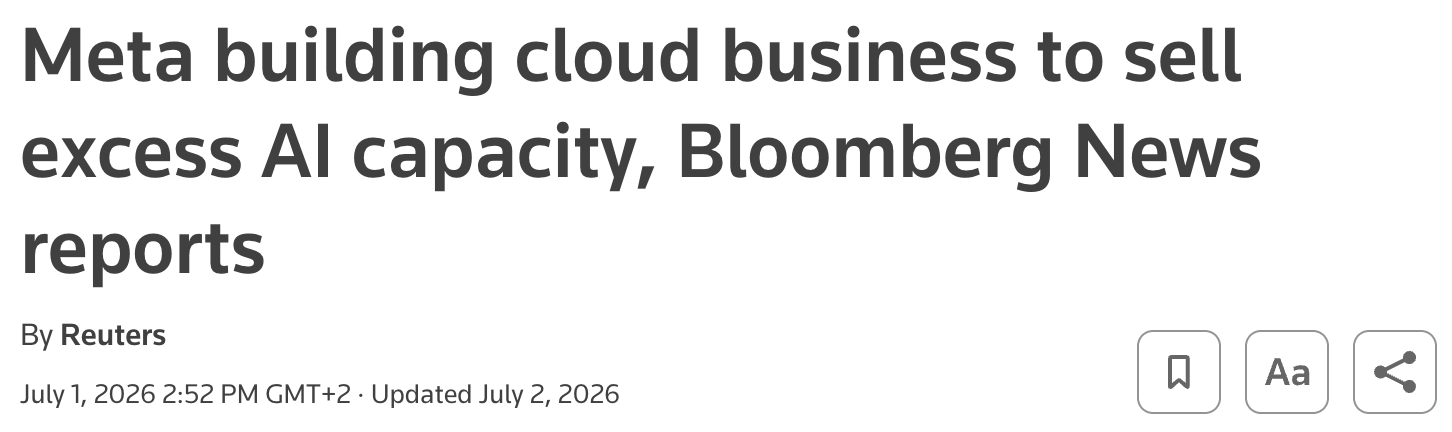
Some operators have started selling excess AI capacity into the secondary market, which is hard to square with demand exceeding supply by the margins implied in the capex plans.
And the industry charges for usage rather than outcomes, so a clumsy implementation that burns tokens produces more revenue than an efficient one. A meaningful portion of AI revenue therefore measures how wastefully the technology is being applied, and compresses as customers improve.
8. Common Sense Test #2 – This Time: Valuation
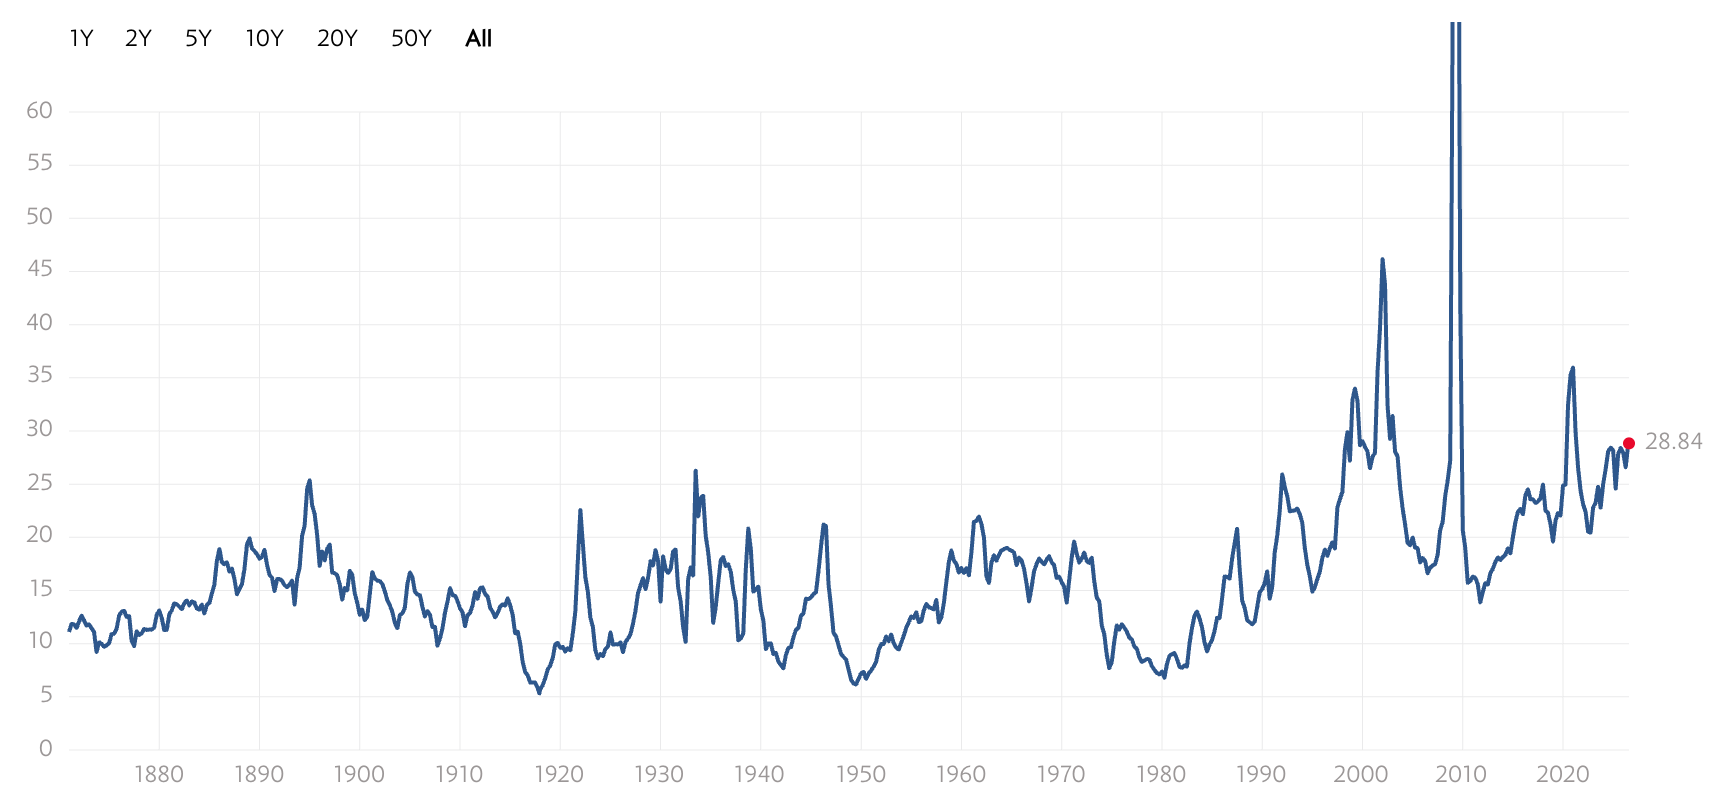
The Shiller CAPE stands at an almost record high of 40.9x as I write this …
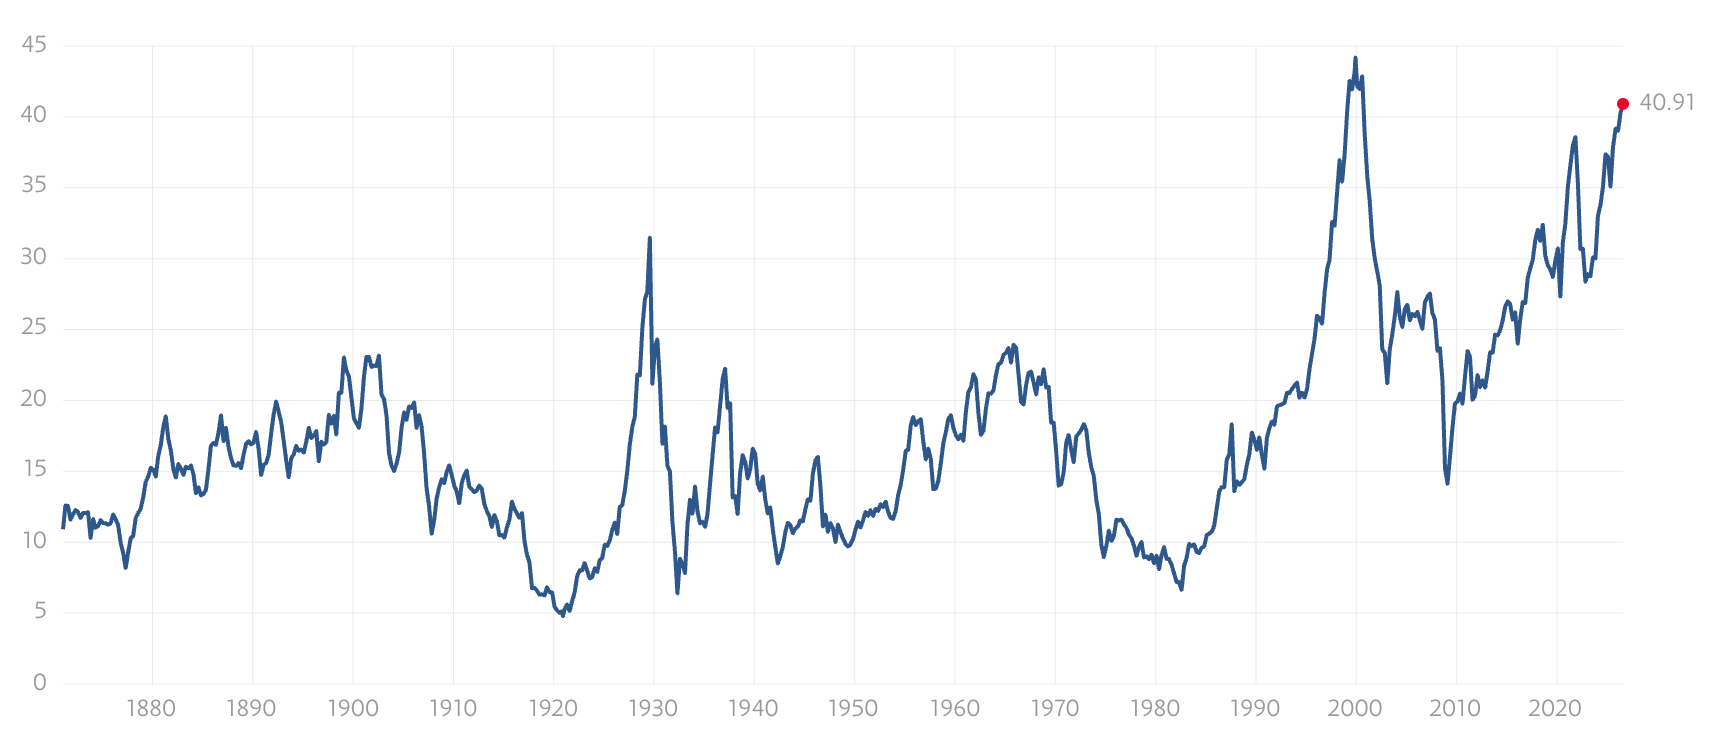
…, against an all-time record of 44.2x in December 1999 and a long-run median near 16 (16.1x).
Nvidia, Microsoft, Amazon, Meta, Broadcom, and Google – six names – alone represent almost 28% of the index.
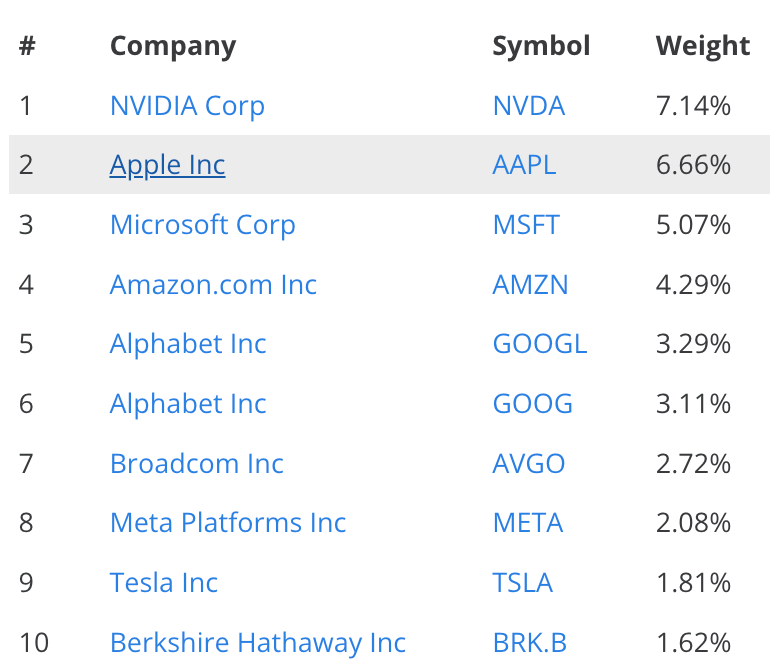
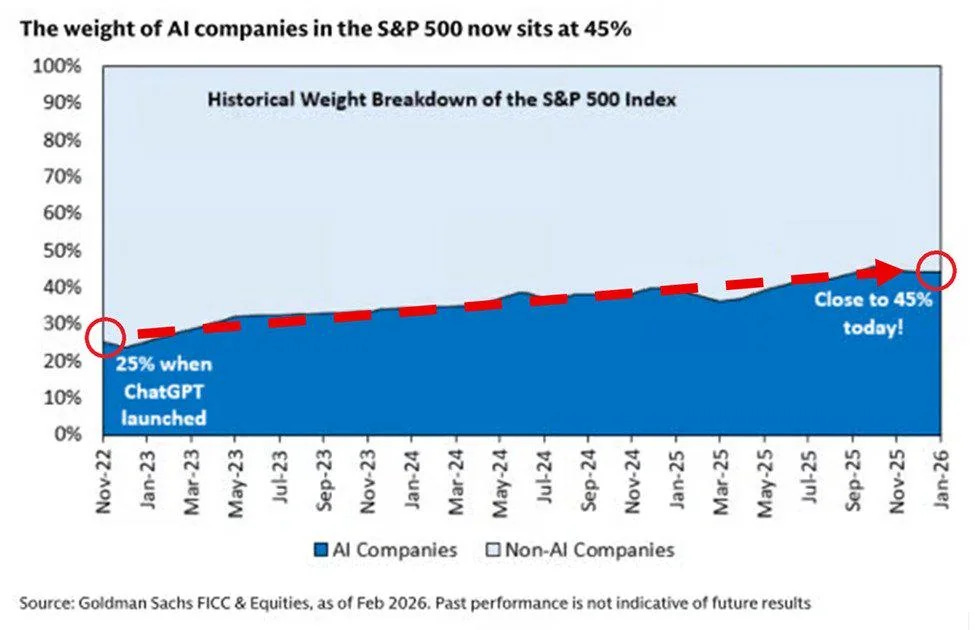
According to Goldman, as of three months ago, “AI companies” make up 45% of the index (probably a rather broad definition to be fair).
Back to valuation … Again, there is one prior period in the history of the series at these levels: late 1999 into early 2000. Exactly one!
That is not a timing signal, as I outlined in my last piece referenced above (I’ll insert the lovely illustration again here), and I will keep saying so.
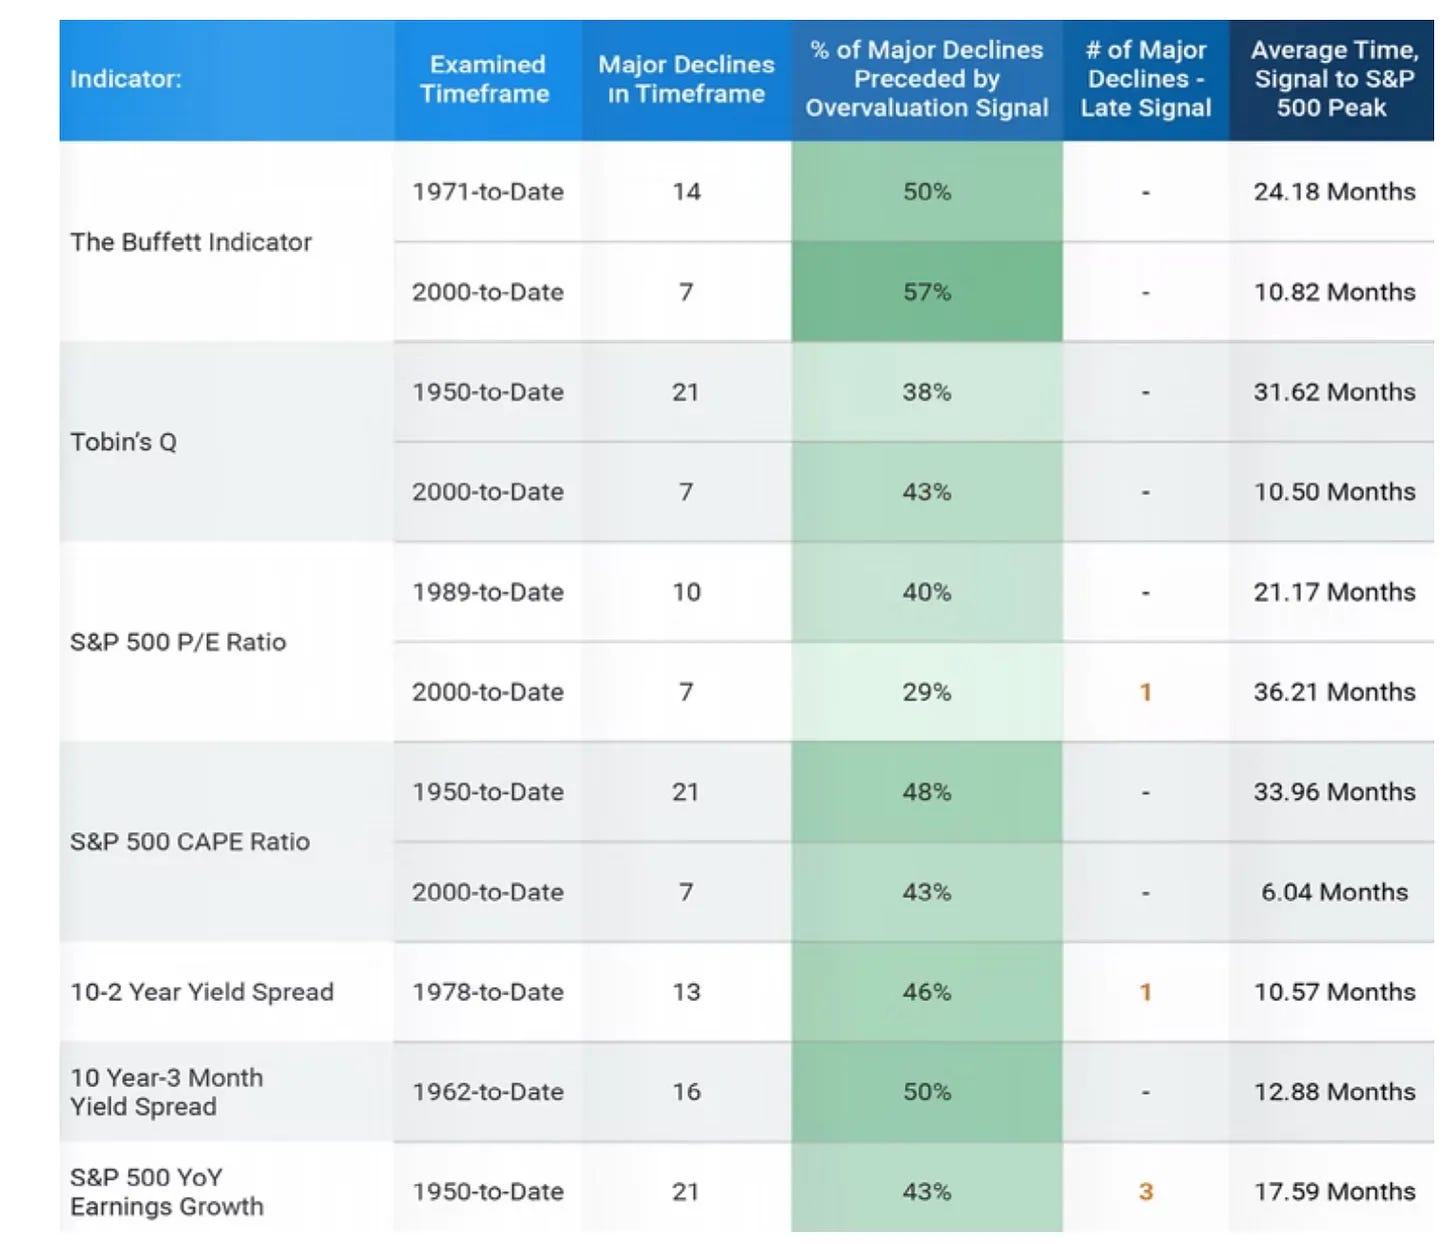
“… of |the] seven leading indicators studied, none have consistently predicted major market declines dating back to 1950. Even the most consistent indicators provided a warning signal for only about half of major declines. “ [note: A major decline in this study was defined as a decline of 10% or greater from the S&P 500’s most recent all-time high]
Anyone who went to cash on CAPE in 2015 – when it reached almsot 27x (way above the median) has been thoroughly punished.
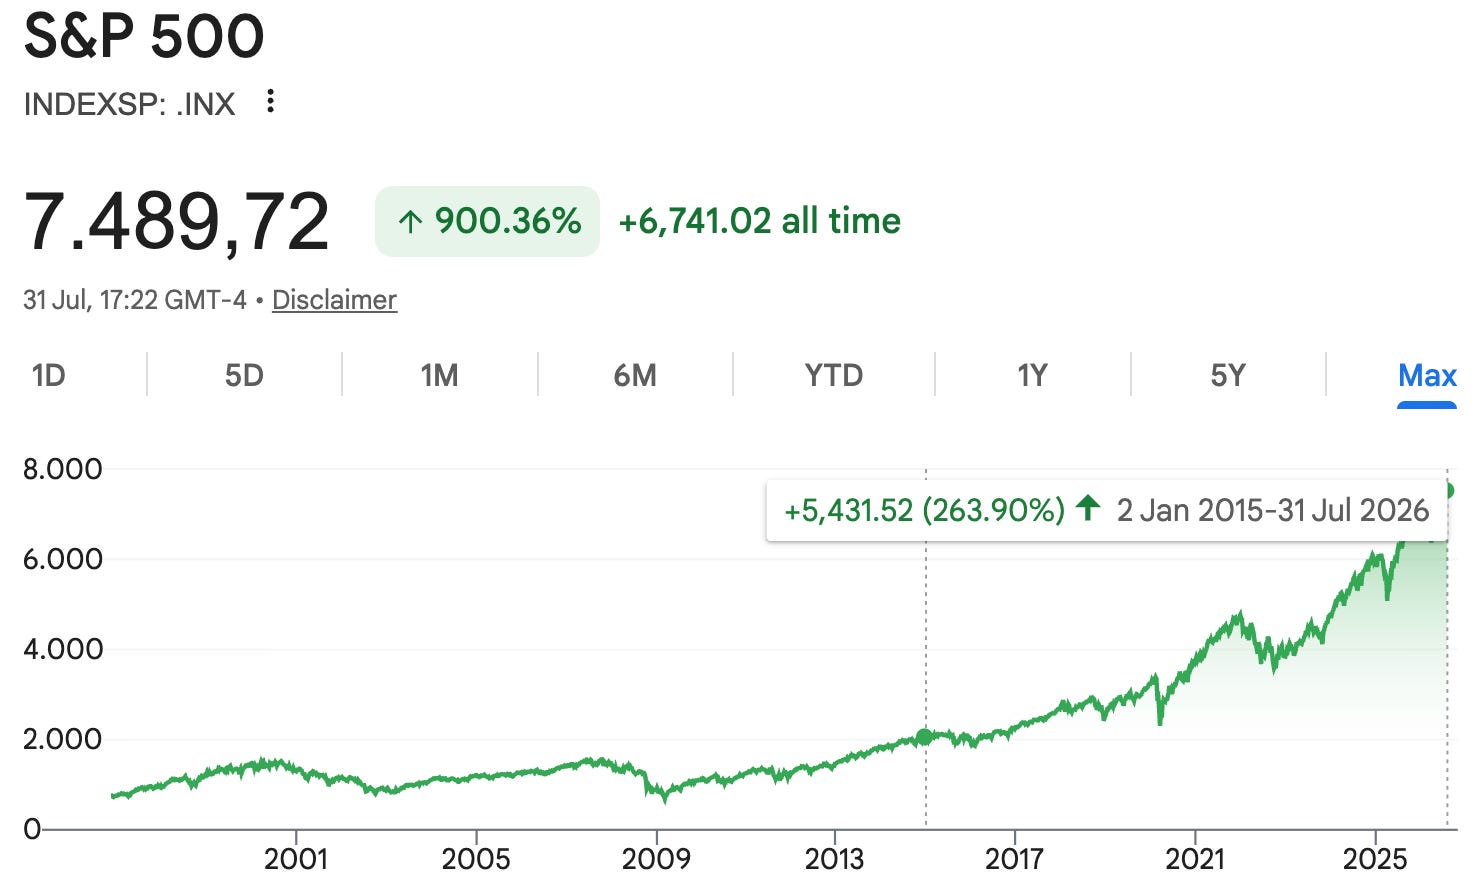
I still believe, however, that starting valuation matters for the subsequent long-term returns. And I’ll admit that in the current environment you might have to shift your definition of “long-term” to 20 years+ because the high starting valuations from 2015 didn’t stop the S&P from performing incredibly well over the subsequent 10-11 years.
Of course, you could bring up some structural changes that justify higher multiples for US stocks – multiples are just a shorthand after all –, and I wrote about it in the piece linked below (different margin and growth profiles, outdated accounting standards, the composition of the index, global diversification, etc.); I recommend reading it to come to a balanced, well-informed view yourself.
The S&P 500: Not As Overvalued As You Might Think?

Headlines are rife with warnings about the "wildly overvalued" state of the US stock market, often pointing to historical averages and lofty metrics to support these claims.
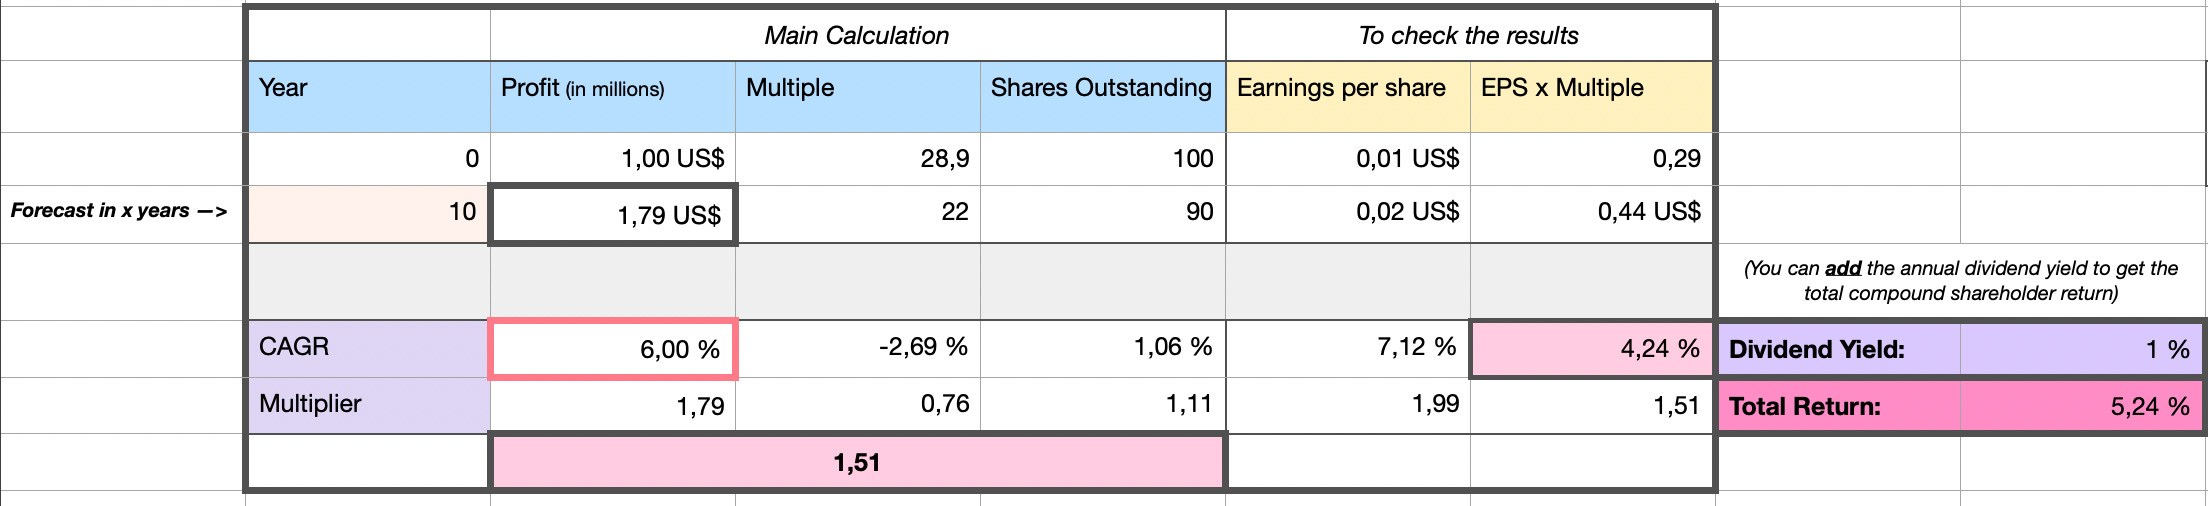
Nonetheless, let me run a simple valuation exercise here, an exercise that Dirt Cheap Stocks used in his piece already, and one of the valuation approaches I favor myself.
You are currently buying the S&P at roughly 28.9x earnings with a dividend yield near 1%.
Want 10% a year for a decade? (roughly in line with the S&P’s long-term returns) Earnings have to compound at about 9%, and the multiple has to still be 28x times when you sell (a multiple well above the historical median; but as outlined in the write-up I linked above, that may be justified too). Long-run S&P earnings growth has been around 6% to 6.5%, so the bull case needs a permanent step-change in the earnings growth rate of the largest economy on earth while the most expensive multiple in twenty-six years does not compress at all.
To be fair, a 28x multiple translates into a 3.5% yield. Deduct 1% required to pay out the dividend (largely in line with the aggregate dividend payout ratio for the S&P 500 Index being approximately 30.5% right now), and that leaves you with 2.5% to buy back shares (that’s the absolute ceiling) and boost EPS. Historically, the 2-2.5% may be gross buybacks (before SBC effects), and only half of it is a net reduction in shares (1-1.25%).
But what if the multiple ever drops? If over a ten-year time frame (note: the longer your time horizon, the more negligible the impact of multiple changes), the multiple reverts back to the low 20s, earnings compound at 6%, an annual share reduction of around 1% (net) plus the dividend yield of 1%, and you end up with annual returns of about 5% compounded.
I’ll spare you the math for lower exit multiples.
But hey, if AI keeps progressing at the current pace, we all will never have to work again, right?

Final Thoughts
I should be straightforward about my record. I have thought this market expensive for some time, and being expensive has not stopped it going up. I have no idea whether this turns in two months or two years or ten years. I would have been reasonably confident about multiple mean reversion over a 10-15 year time frame a few years ago. Today, I’m not anymore.
Still, none of this changes how I invest. I prefer buying asset-light companies, trading at cheap normalized multiples, with clear growth drivers and structural tailwinds and a great deal of visibility in terms of ROIIC and reinvestment rates.
Also, look again at how this started. Aschenbrenner was substantially right about the direction of AI infrastructure, and being right did not save him, because he had built a position that required the market to agree with him on a schedule.
That thread runs through all eight signs: Circular financing, off-balance-sheet structures, stretched depreciation schedules, record margin balances, capital committed against a grid that cannot deliver, possibly for seven years or more. To me it seems like they too, in a way, shorten the time you have to be proven correct.
The “whispers” this time are in footnotes, lease classifications and interconnection queues, harder to hear than Ferraris in Seoul (reference to my initial piece; which you might want to read next).
Navigating the Froth: 6 Alternative Signs of a Market Top

Look at the surface numbers, and the stock market seems absolutely bulletproof. The S&P 500 closed out 2024 up roughly 25%, carried that momentum through another positive year in 2025 (roughly +18%), and is already sitting on an 11% gain year-to-date in 2026.
What is visible gets priced immediately. What requires reading between the lines, connecting the dots, some intuition and common sense, may not.
Disclaimer: The analysis presented in this blog may be flawed and/or critical information may have been overlooked. The content provided should be considered an educational resource and should not be construed as individualized investment advice, nor as a recommendation to buy or sell specific securities. I may own some of the securities discussed. The stocks, funds, and assets discussed are examples only and may not be appropriate for your individual circumstances. It is the responsibility of the reader to do their own due diligence before investing in any index fund, ETF, asset, or stock mentioned or before making any sell decisions. Also double-check if the comments made are accurate. You should always consult with a financial advisor before purchasing a specific stock and making decisions regarding your portfolio.
excellent read, very detailed and thorough, great points, thanks for your efforts!
Wow, what a great piece of writing - really enjoyed it! Thanks, René 🙌🏻