

Headlines are rife with warnings about the "wildly overvalued" state of the US stock market, often pointing to historical averages and lofty metrics to support these claims.

For many, the S&P 500’s current valuation suggests we’re on the brink of disappointing returns.
But a deeper look may reveal a more nuanced story.
In this post, I’ll explain why the S&P 500 might not be as overvalued as it seems—and why comparing today’s market to the past can be misleading.
Are Valuation Multiples Telling the Full Story?
At a glance, the data paints a sobering picture. As of today, the S&P 500’s price-to-earnings (P/E) ratio hovers around 30, nearly double its historical mean of 16.

If you base your assessment solely on this, it’s easy to conclude the market is overpriced.
However, valuation metrics like P/E ratios are just one piece of the puzzle. They’re a shorthand for deeper valuation work, not a comprehensive analysis.
To truly understand the market’s valuation, we need to dig into the factors driving these multiples.
Are they inflated by speculative exuberance (that may be partly true), or is there a structural reason why the S&P 500 deserves its current premium?
Free Cash Flow Margins: A Fundamental Transformation
One of the most compelling pieces of evidence comes from a chart featured in a recent J.P. Morgan report. It highlights the dramatic improvement in free cash flow (FCF) margins among the 10 largest companies in the S&P 500.
In the 1970s and 1980s, FCF margins for these companies were below 10%.
Today, the same group boasts margins exceeding 25%.

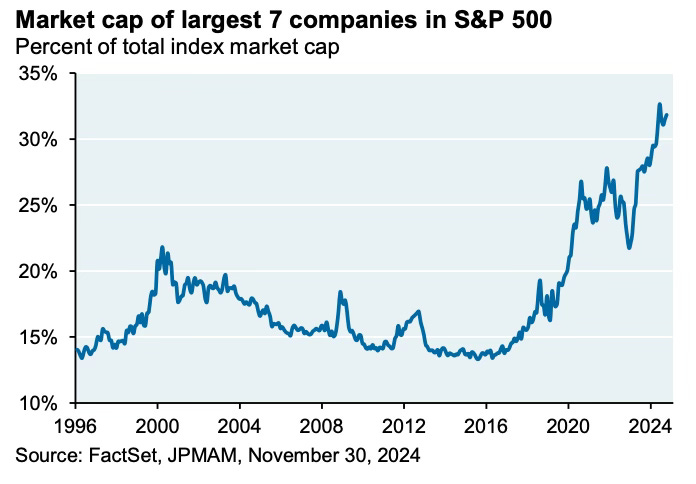
Importantly, the ten largest companies of the S&P 500 represent a much larger weight of the index than they did in the past.
The changes in profitability speak volumes about the structural changes in the quality of the businesses dominating US stock indices.
Companies like Visa (60% FCF margin), Microsoft, and Meta (30%-40% range) have set a new standard for profitability and business efficiency.

Why Free Cash Flow Margins Matter
Free cash flow is the lifeblood of any business—it’s the cash left over after all expenses, including capital expenditures, have been accounted for.
“As a young(er) investment analyst, I once met with the CFO of a large US West Coast bank. I was anxious beforehand, it is not easy for a young man to hold his own with a senior executive of any business, let alone one as opaque as a bank. I forget which question I asked, no doubt it was cloaked in the latest investment buzzwords of the day but, at any rate, it was so overly complicated that it elicited the following response, ‘Look, son, at the end of the day it is all about cash-in, and cash-out’. Oh dear! Well, the put down could have been worse, and probably deserved to be worse. That was a lesson learnt: keep it simple, it is all about cash-in, and cash-out.” - Nick Sleep