

In today’s tech landscape, we’re witnessing a bizarre, almost ludicrous race among the largest players in the space. Meta, Google, and Amazon seem to be locked in a competition to outspend each other in an attempt to capture the future of the digital economy.
At first glance, it feels like a never-ending game of who can burn through the most cash, with no real question of whether the math behind these moves adds up.
To give you a sense of the scale, consider this:
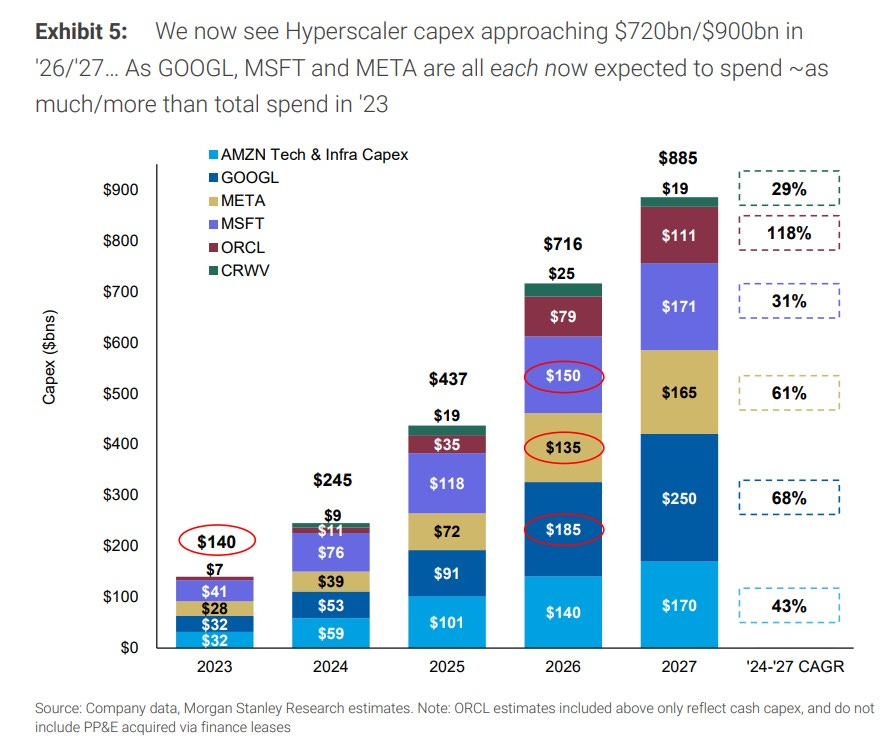
In 2026, Meta’s projected CapEx is expected to surge between $115 billion and $135 billion, easily surpassing initial estimates.
Google, not to be outdone, followed with an aggressive $175 billion to $185 billion, leaving estimates in the dust.
And now Amazon, aiming for a $200 billion spend, is preparing to outpace even the most bullish predictions ($146 billion).
To put it in perspective, we’re talking about numbers so large that they rival the entire GDP of many sizeable countries.
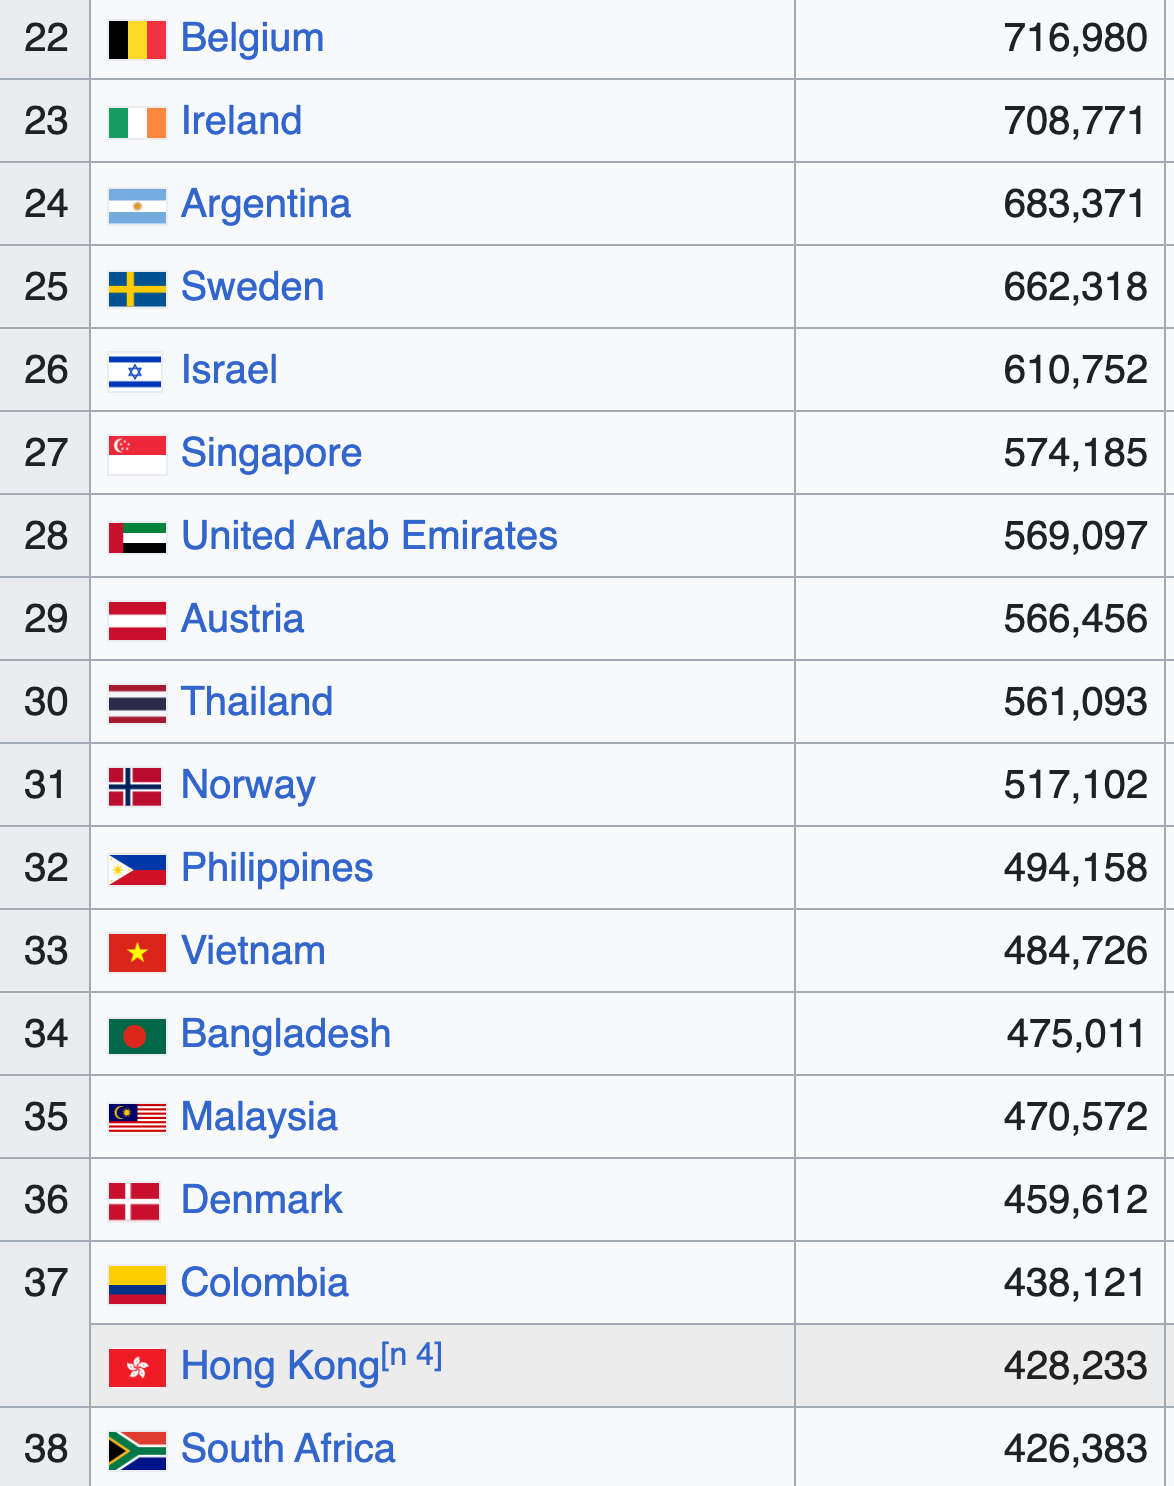
For comparison, Germany’s entire stimulus plan over the next 12 years is €500 billion, which averages to about €40 billion annually. Yet, here we have Google alone, set to spend more than the entire global mining sector (roughly $100 billion annually) – one of the most capital-intensive industries on Earth – in just one year.
“According to McKinsey analysis, growth capital expenditures for new supplies of metals and minerals, driven by traditional demand and powered by the energy transition, could require $1 trillion over the next ten years.” - McKinsey
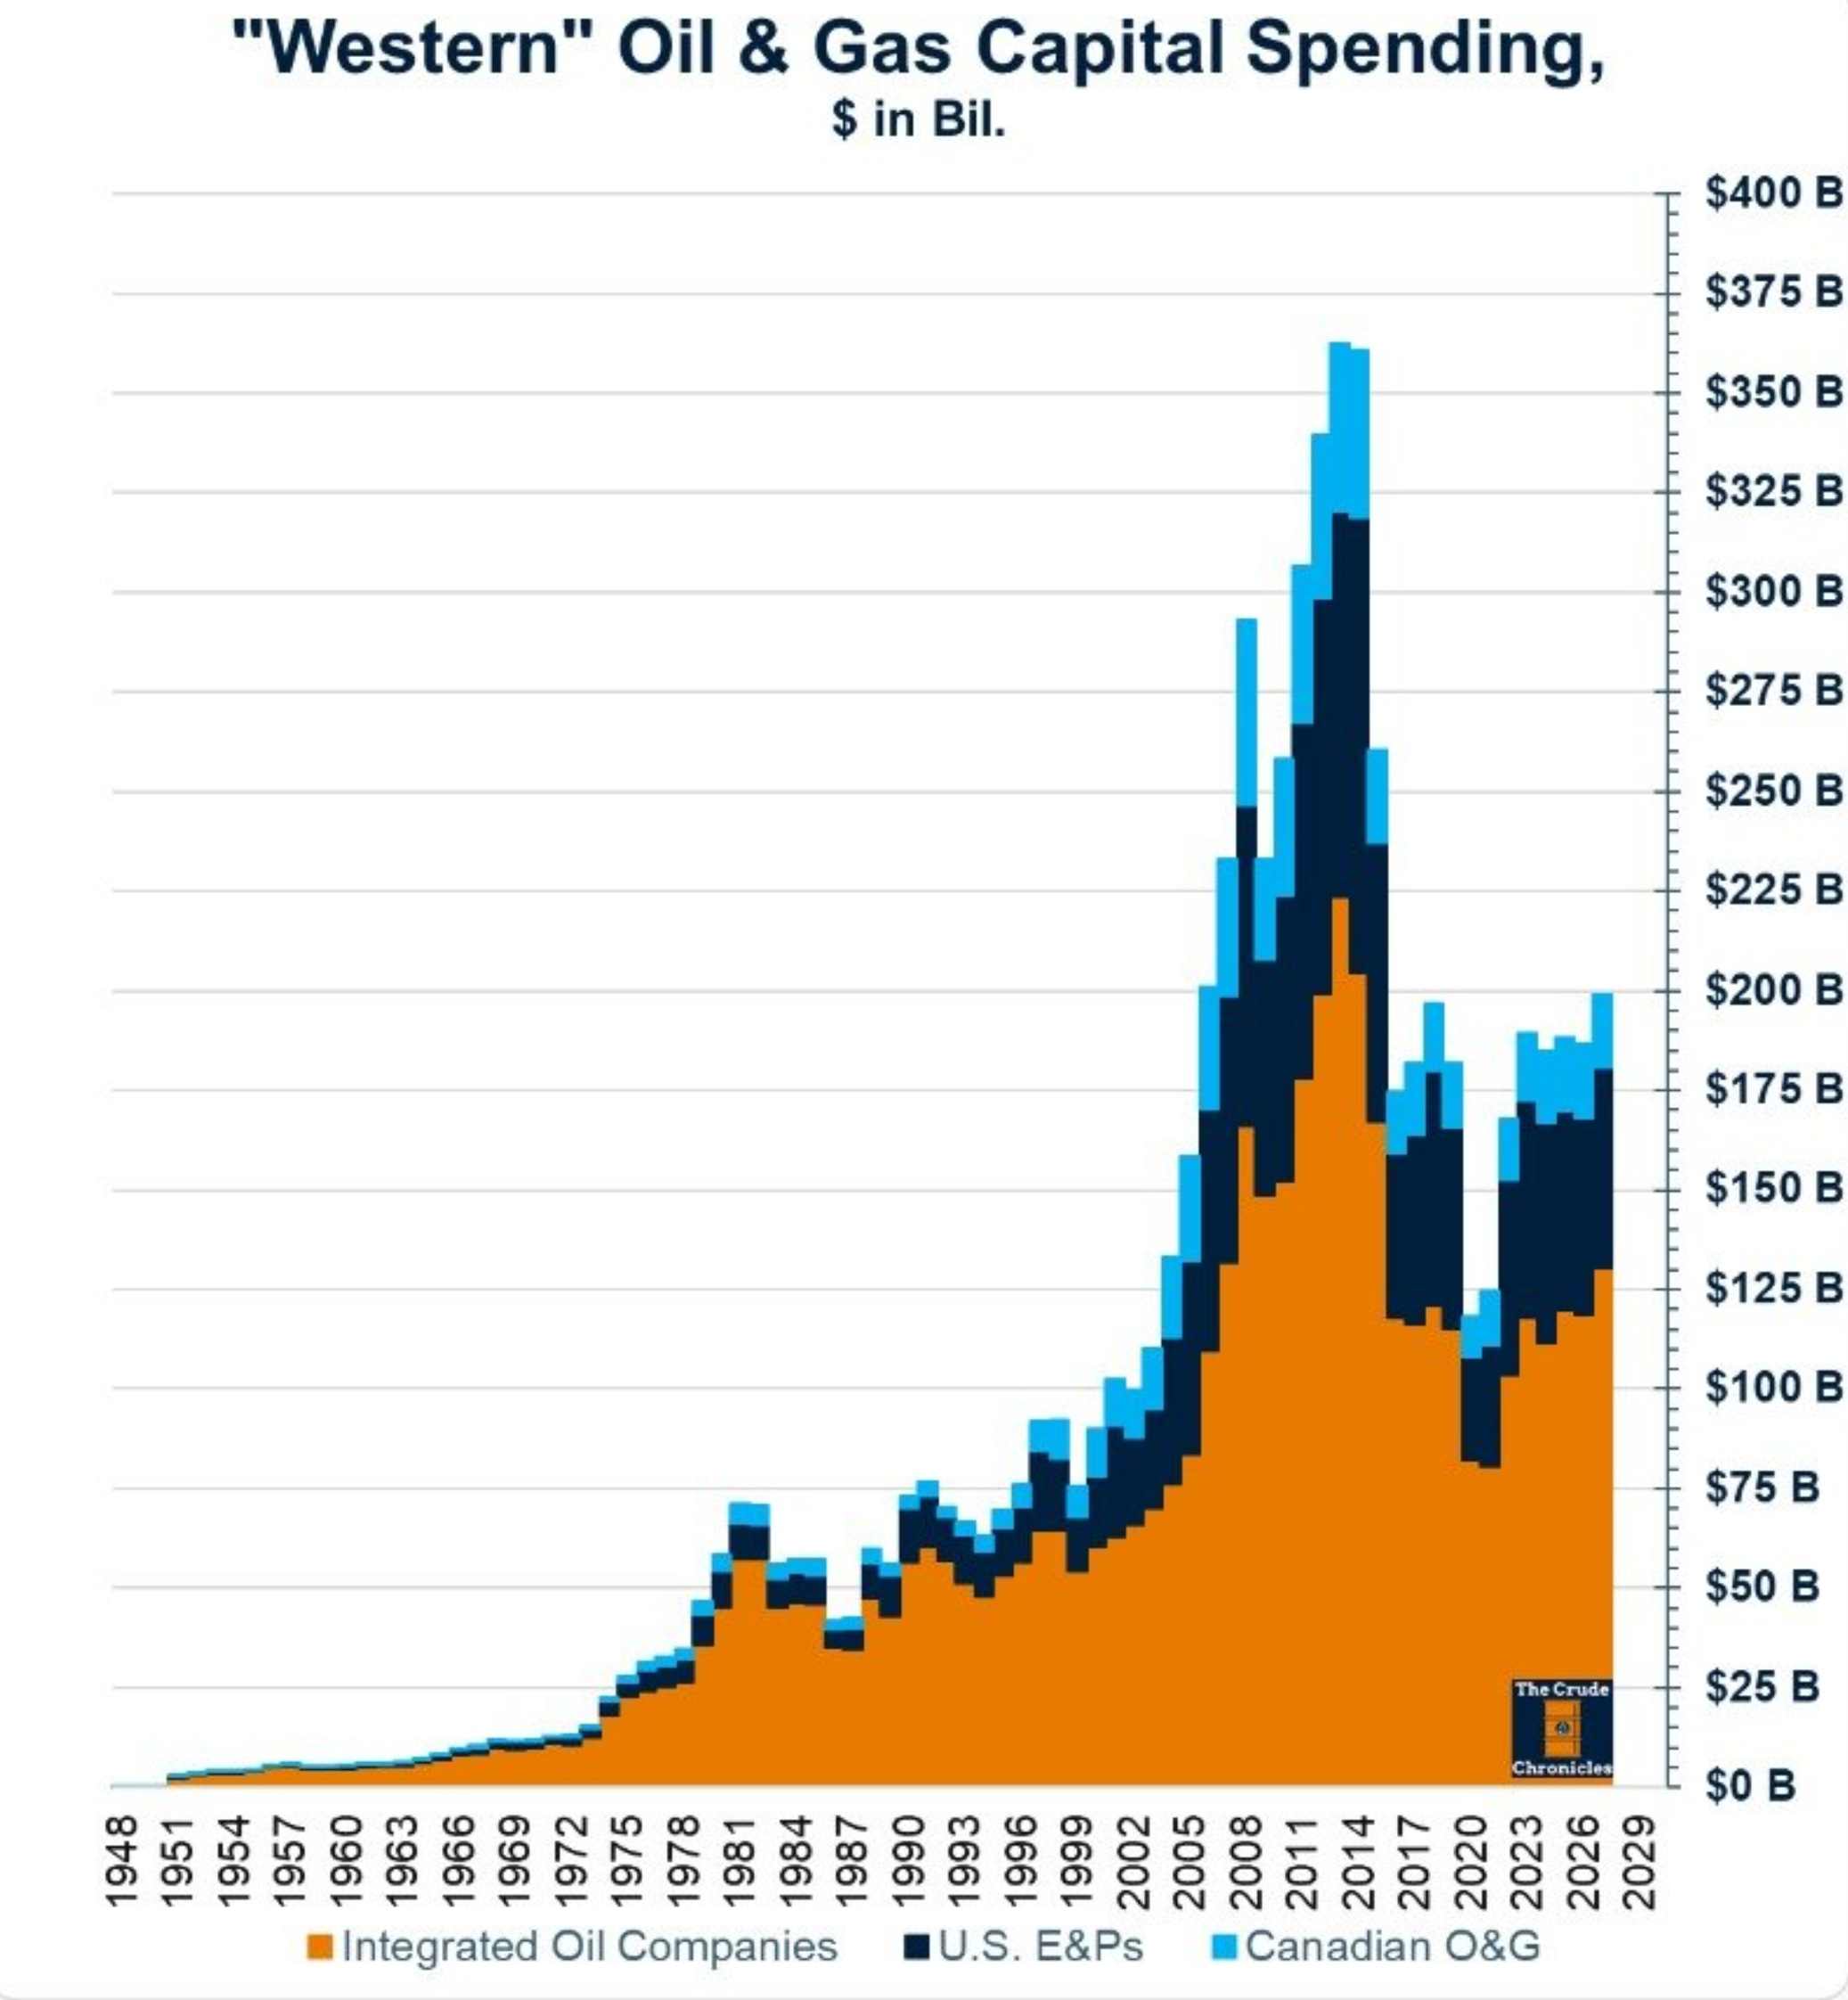
In fact, Google’s $180 billion spend in 2026 is roughly equivalent to the combined capital expenditures of all Western oil and gas companies in recent years, as shown in the attached chart.
This kind of massive spending is almost unprecedented in the corporate world.
You don’t have to take my word for it – just look at the numbers from Morgan Stanley Research in the chart below. The capital expenditures of major tech firms like Amazon, Google, Meta, and Microsoft are climbing at a pace that would seem unsustainable under normal circumstances. And there are no signs of slowing down.

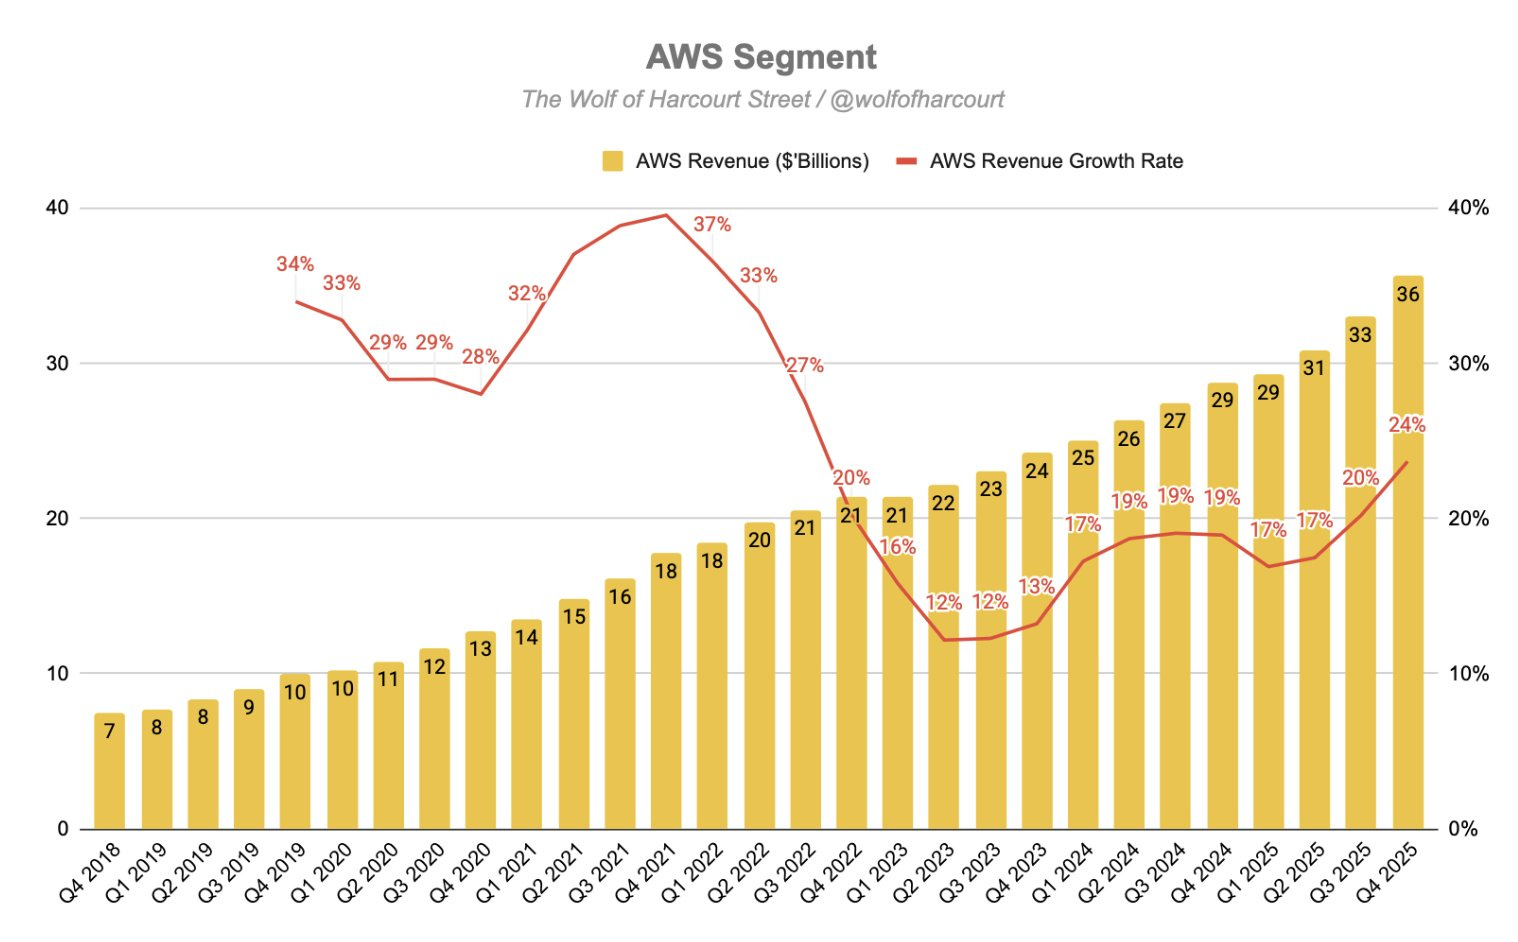
But here’s the kicker – while these numbers are wild, there is growth behind them. Google’s cloud division is growing at an incredible 48%, Meta has just seen a reacceleration in its revenue, and Amazon’s business is humming along at full steam – according to math by Wolf of Harcourt Street AWS’s revenue growth accelerated to 24%.
The question this post will attempt to answer is:
What kind of incremental profit growth do these companies need to achieve in order for this massive spend to make sense?
Unpacking the Numbers: How Much Does It Take to Achieve Meaningful ROIIC?
The figures we’re working with – $5.39 trillion in combined CapEx and R&D investments over the next five years – require more than just a cursory glance. To get to the heart of whether this massive spend will generate meaningful returns, we must dig deep into the components that make up this staggering number and understand the assumptions baked into it.
At the foundation of these numbers are two main drivers: Capital Expenditures (CapEx) and Research and Development (R&D) expenses. Together, they constitute the bulk of the planned investment over the coming years, and both categories are pivotal in shaping how these tech giants will position themselves for future growth.
First, let’s break down CapEx. For 2025–2029, the projected CapEx figures are eye-popping:
2025: $437 billion
2026: $716 billion
2027: $885 billion
For 2028–2029, I simply assumed CapEx to hit $1 trillion each year (this is assuming a significant slowdown in CapEx growth; consider that CapEx almost doubles between 2025 (actual) and 2027 estimates)
The goal here is not precision. It’s just to use common sense and some basic assumptions to get a feel for the outcome required for this massive CapEx cycle to make sense.
Tiho Brkan shared this anecdote with me this morning, which may help to illustrate where we are trying to go with this post:
“This is how I would do valuation. Simple, common sense. At one point in 1999, Coke’s valuation reached levels which required every adult in the world to drink a bathtub of Coke per day. And somehow, Munger convinced Buffett not to sell. It just not possible! Buffett later expressed deep regret of not selling“
Back to our CapEx figures: These numbers represent not just a hefty spending spree but also a clear growth strategy. In particular, Google, Meta, and Amazon’s investments are tied to expanding cloud infrastructure, AI advancements, and the pursuit of future-forward technologies like Augmented Reality (AR) in the case of Meta.
It’s important to note that 100% of this CapEx is assumed to be growth-related. Again, I’m highly simplifying things here as it makes my math more straightforward. This assumption is crucial because it emphasizes the strategic intent behind this spend: these companies are pouring money into infrastructure and services that will ideally drive future cash flows. If you believe a good portion of this spend is in fact maintenance spend, you also must assume that these businesses are becoming structurally less profitable.
That said, these expenditures come with inherent risks. CapEx is a long-term investment, and it could take years to see returns. The pressure on these companies to deliver profitable growth from their investment is monumental.
If we combine all the CapEx numbers for 2025 through 2029, we arrive at a cumulative total of $4.038 trillion. That’s no small amount. Not at all!
But to understand the scope, it’s essential to compare it to other global benchmarks. As mentioned earlier, Google’s planned $180 billion CapEx for 2026 would exceed the combined capital expenditures of all Western oil & gas companies. Google’s one-year spend could match or surpass the entire global mining sector’s annual CapEx.
Now, in today’s day and age, a significant portion of growth investments appears on the income statement. Investment into intangible investments. So I figured, I’d be wise to add R&D investments to the mix, which add another layer of complexity and uncertainty to these figures. Over the next five years, we see major companies like Meta, Microsoft, Amazon, Google, and Oracle together investing heavily in R&D.
The trailing R&D figures for each company are as follows:
Meta: $57 billion
Microsoft: $33 billion
Amazon: $108 billion
Google: $61 billion
Oracle: $10.7 billion
Coreweave: $264 million
Summing these up, we get a total R&D expenditure of $269 billion in the most recent trailing year. When we multiply this by 5 – again, I’d expect this figure to grow exponentially over the five years, but I want to keep it simple stupid here, and also add a layer of conservatism –, considering the five-year horizon, we end up with an estimated $1.35 trillion spent on research and development over the next five years.
Adding this to the earlier CapEx figure, we now have a total combined growth investment of $5.39 trillion (CapEx: $4.038 trillion + R&D: $1.35 trillion).
Understanding the ROIIC Targets: What’s Required for Profitability?
At this stage, the next question is simple: what do these companies need to achieve in terms of incremental profit growth to make this $5.39 trillion investment worthwhile? This is where the concept of Return on Incremental Invested Capital (ROIIC) comes into play.
ROIIC is an important metric for understanding the effectiveness of incremental investments – how much incremental operating cash flow (OCF) a company can generate relative to its new investments. I was using operating cash flow here to make the task a little more straightforward for me.
Now, to begin assessing this, let’s establish a clear baseline by looking at the operating cash flow (OCF) values for these companies at the end of 2024, which represent the starting point for our calculations. Here’s a snapshot of the OCF from each company:
Coreweave (CRWV): $2.61 billion
Amazon (AMZN): $112.71 billion
Oracle (ORCL): $20.29 billion
Microsoft (MSFT): $122.14 billion
Meta (META): $82.74 billion
Google (GOOG): $105.10 billion
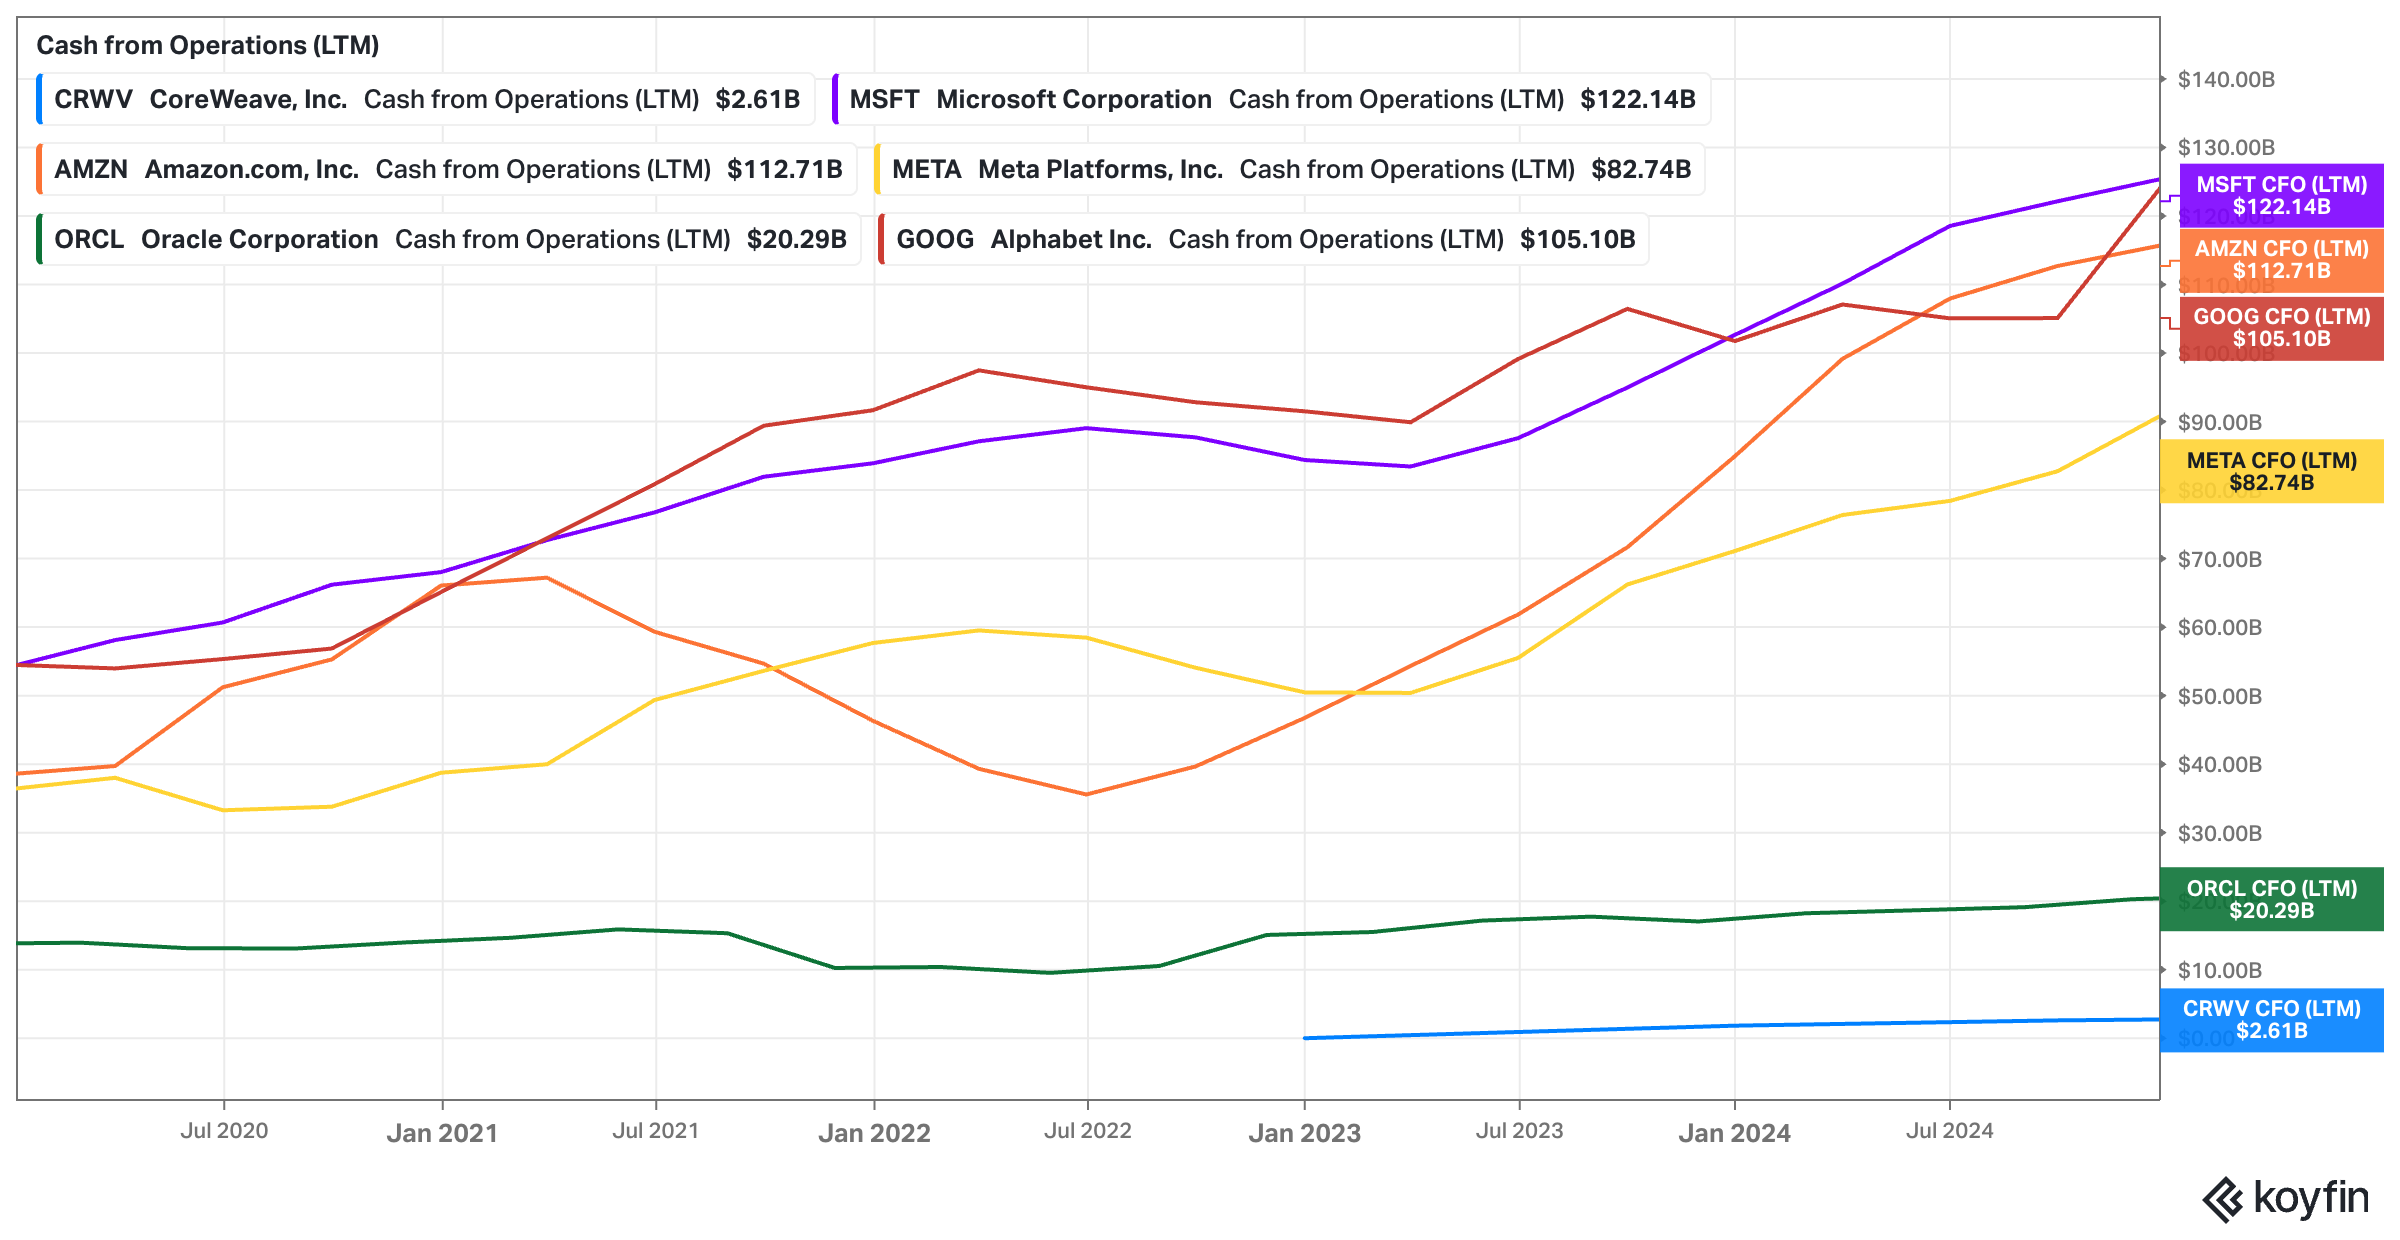
When we sum these up, we get a total operating cash flow of $446 billion for the end of 2024. This is the baseline operating cash flow we’ll use to understand the incremental growth needed to support the massive $5.39 trillion investment in CapEx and R&D over the next five years.
So, let’s dig deeper into the numbers needed to hit ROIIC targets of 10%, 15%, and 20%.
For a 10% ROIIC, the incremental OCF gain required to meet this target is $539 billion, bringing the total OCF to $985 billion by 2029. This is the baseline target for success, but it’s also the minimum required to justify this level of spending.
If we were to distribute this $539 billion increase evenly across the five years, it would imply an annual OCF increase of $107.8 billion per year.
For a 15% ROIIC, the incremental OCF gain required jumps to $809 billion, which would increase the total OCF to $1.255 trillion by the end of 2029. This higher ROIIC target reflects the growing expectations of investors as these companies ramp up their investments.
Distributing the $809 billion increase evenly across the five years would require an annual OCF increase of $161.8 billion per year.
For a 20% ROIIC, the level of success these companies need to achieve becomes even more aggressive. The incremental OCF required would be $1.079 trillion, pushing the total OCF to $1.525 trillion by 2029. Achieving this ROIIC would be indicative of world-class execution and growth, particularly considering the large scale of these investments.
In this case, the annual OCF increase would need to be $215.8 billion per year to meet the $1.079 trillion incremental OCF target.
Just in case I may be missing something here, please let me know if my math if off or if I made any crucial mistakes. Again, this is less about precision and more about getting a feel for the incremental profit growth requires for the math to make sense.
What This Means for Investors: Is 10% ROIIC Achievable? What Does 20% Mean for the Future?
These numbers point to a simple yet difficult reality: for these companies to justify such a massive scale of CapEx and R&D spending, they need to see huge growth in their (operating) cash flow. While the investments are clearly intended to fuel growth in critical areas like cloud infrastructure and AI, the risks associated with these bets are significant. The potential rewards are there – especially given the accelerating demand for cloud services, AI capabilities, and next-gen digital services (it seems like we are clearly supply-constrained still (!)) but the road to achieving these lofty ROIIC targets is fraught with challenges.
At the end of the day, the question isn’t whether the math “works” today, but whether these companies can continue to execute at a scale that matches their ambitious plans. The $5.39 trillion investment is no small feat – and while the potential for long-term success is significant, these companies will need to grow at a rapid pace to deliver on their promises.
Again, just to provide some context, as we look at the net income figures for the six companies in question, we can see a snapshot of their current and projected earnings power:
Coreweave (CRWV): -$766.65 million
Amazon (AMZN): $77.67 billion
Microsoft (MSFT): $119.26 billion
Meta (META): $60.46 billion
Google (GOOG): $132.17 billion
Oracle (ORCL): $15.43 billion
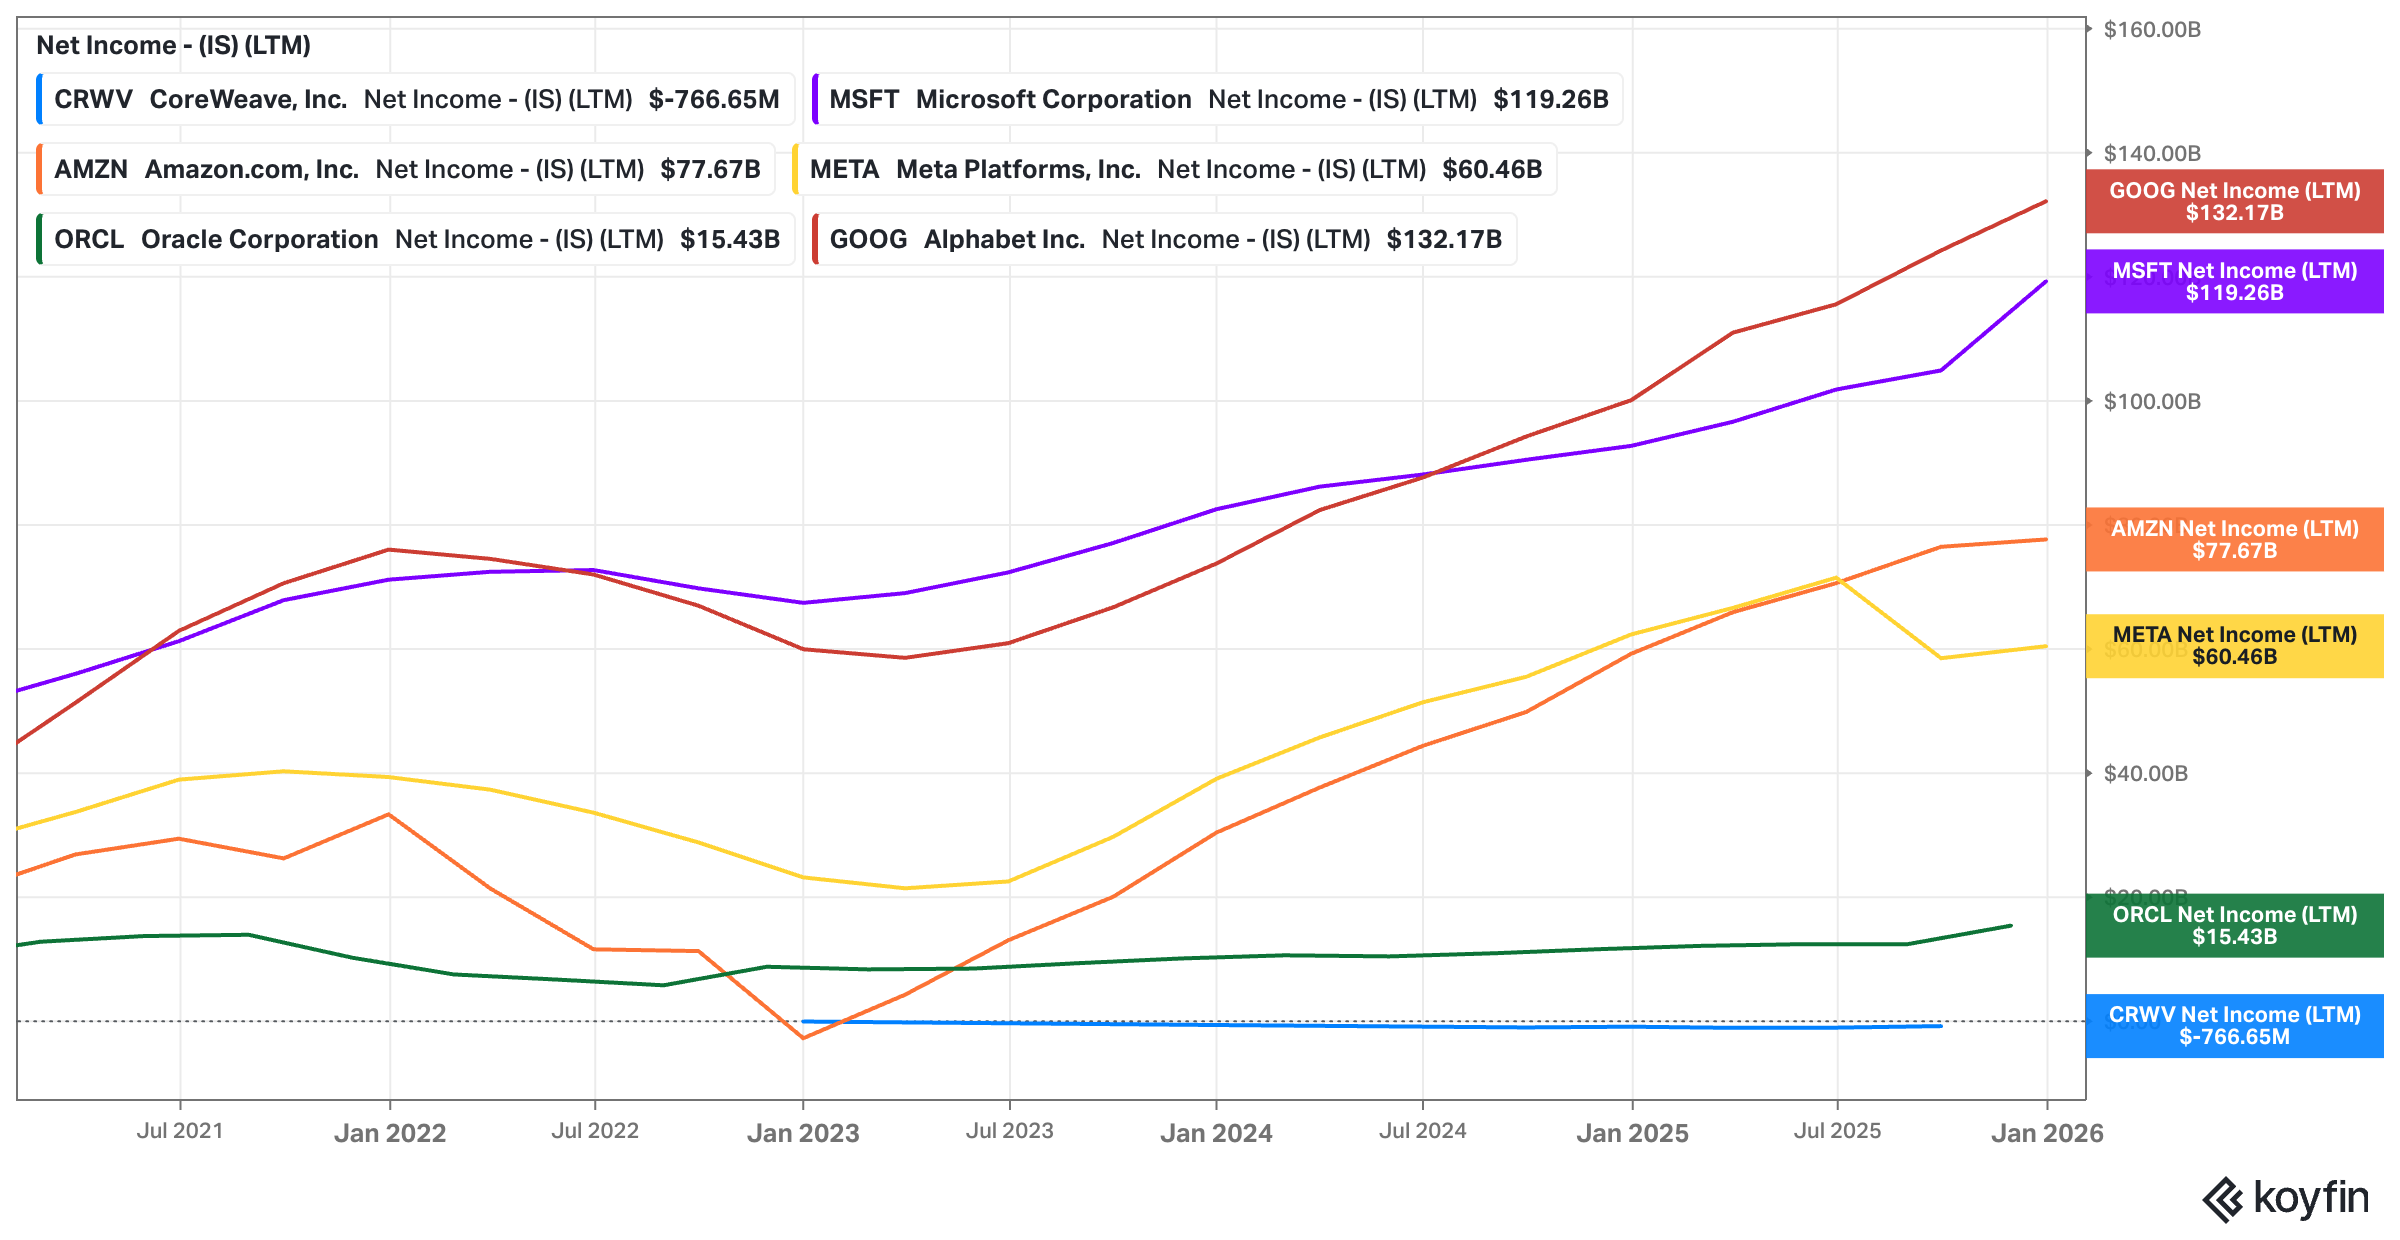
These companies have a combined total net income of $439.13 billion, which, when compared to the overall S&P 500’s net income of $2.3 trillion for 2025, already represents a relatively large portion of the S&P’s earnings power already.
One important metric that should not be overlooked is the growth in operating cash flow. As of early 2025, these six tech giants collectively generated around $446 billion in OCF.
Fast forward around one year, and that figure increases to $604.52 billion.
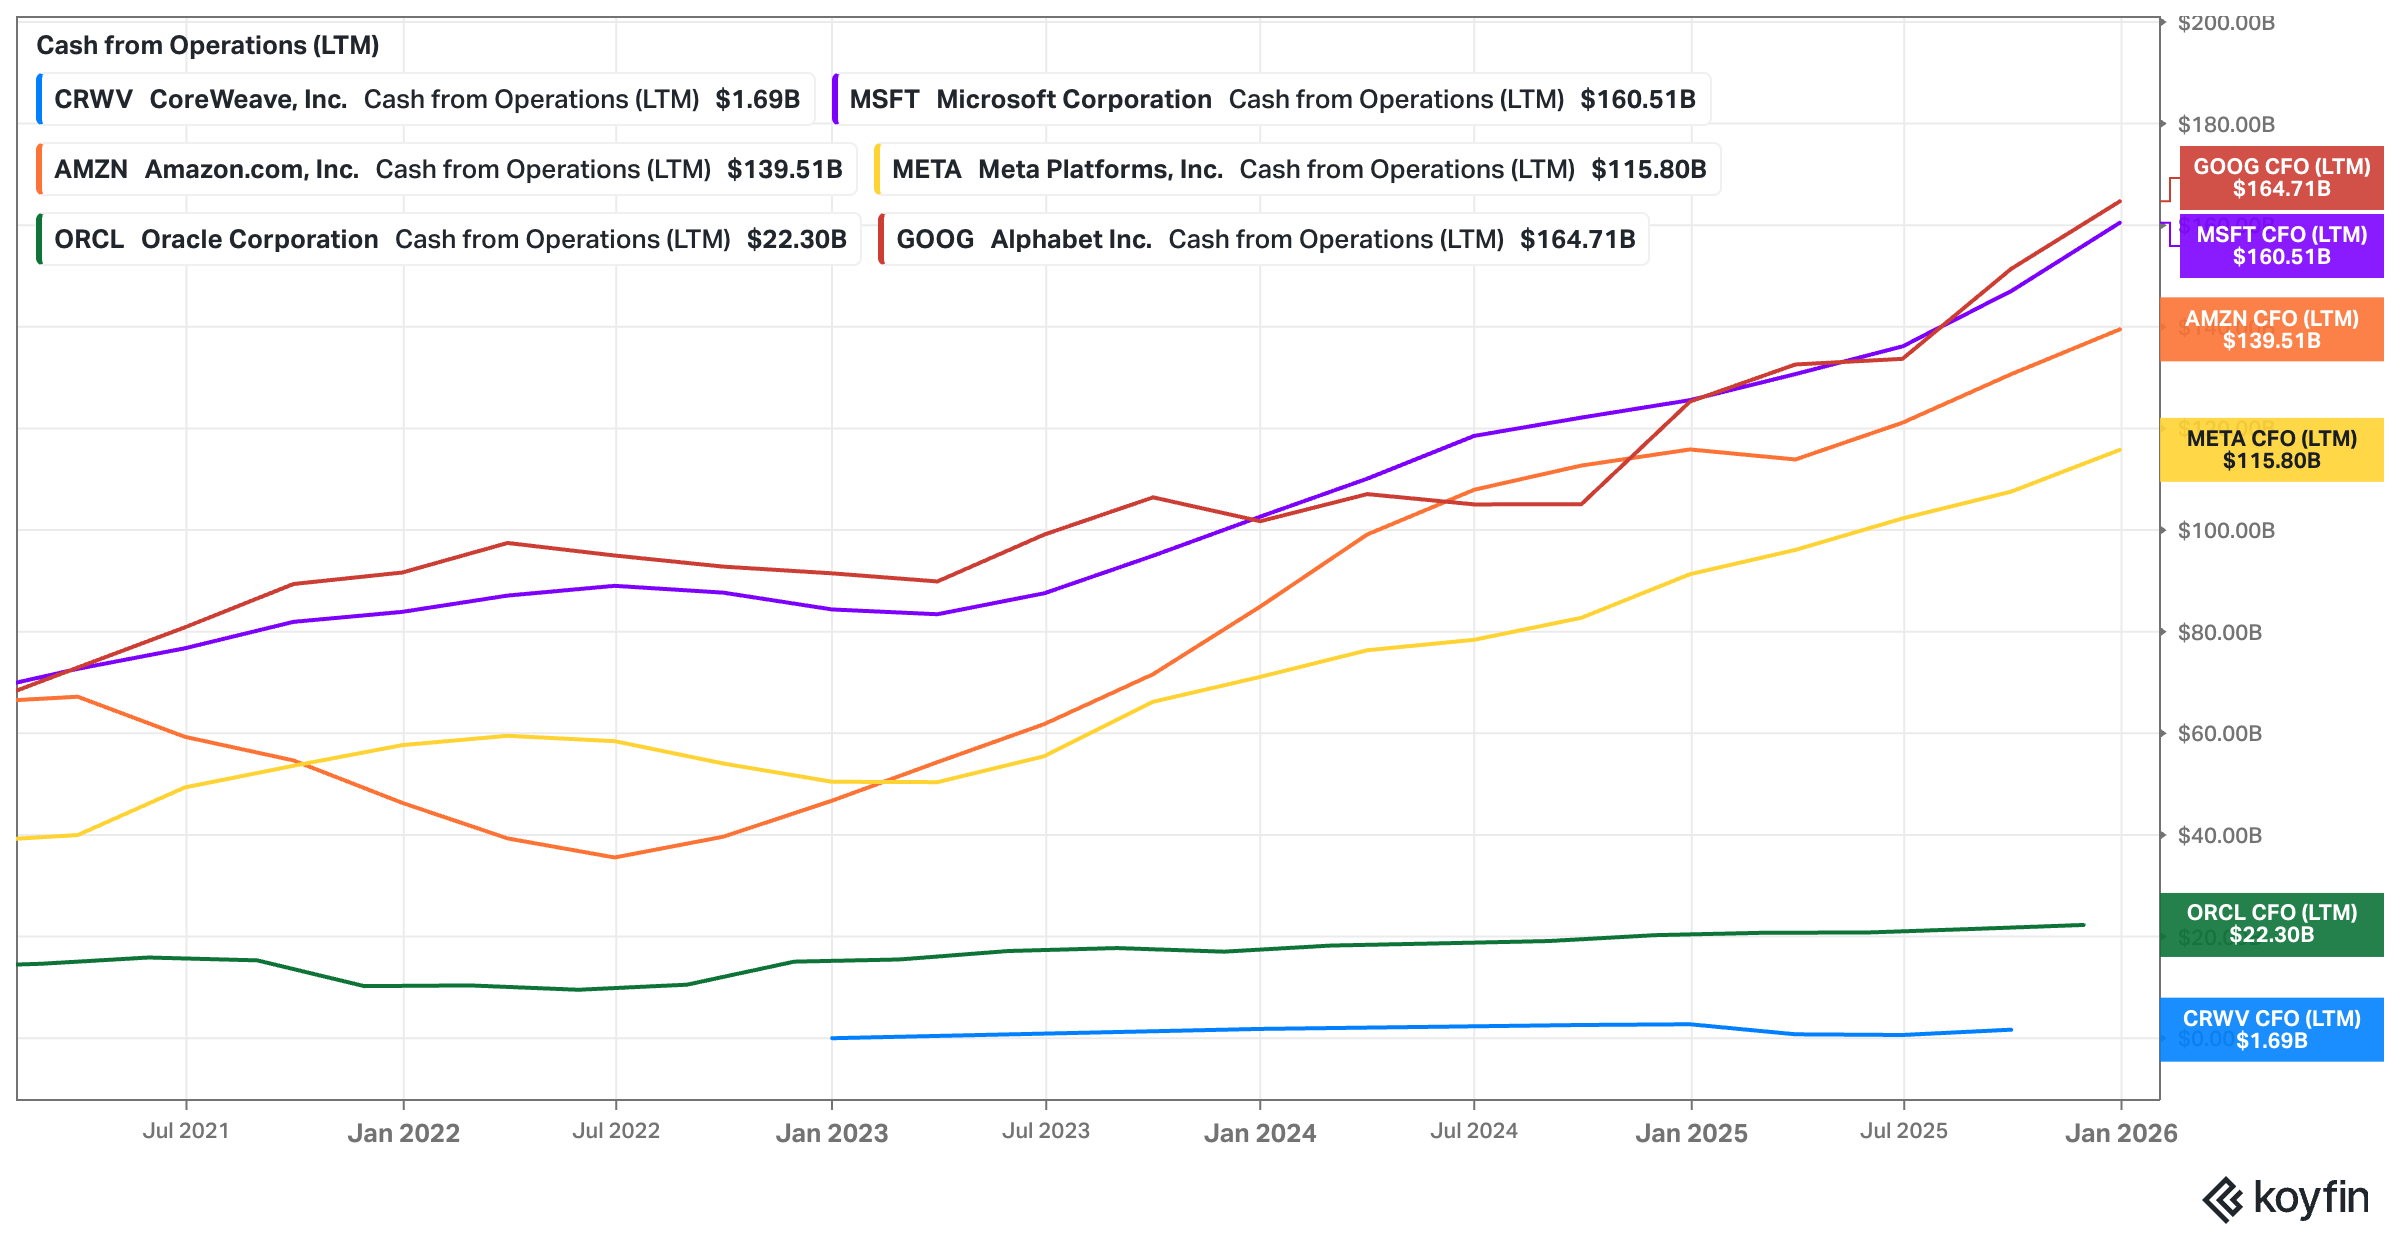
This $158.52 billion increase in OCF in just one year is a critical data point for investors. It shows that, despite the massive CapEx and R&D outlays, these companies can generate significant incremental cash flow. Enough to clear our 10% and 15% hurdles – so far.
It demonstrates that they have the ability to scale their operations rapidly to meet demand, particularly in high-growth areas like cloud computing, AI, and digital services. This is crucial for understanding the feasibility of their projected investments.
When we connect this OCF growth to the $5.39 trillion in combined CapEx and R&D spending, it helps put the numbers into context. While the spending is staggering, it’s clear that these companies are not only spending aggressively but also managing to generate substantial cash flow from their existing operations.
The question remains, though:
Can this momentum continue? Will the growth in OCF keep pace with the increasing scale of their investments, or will they hit a plateau?
John Huber’s perspective provides an interesting take on what could happen next. He suggests that hyperscalers like Meta, Google, and Amazon might soon slow down their pace of CapEx spending (which we also assumed in our estimates fwiw) – perhaps sooner than the market expects. These companies may not be able to sustain such aggressive investments forever, particularly if their growth rate begins to decelerate.
If CapEx does slow down, free cash flow (FCF) would likely increase as the companies begin to reach capacity in their investments. The market could interpret this shift as a sign of slower growth, which might initially weigh on their stock prices. However, this could also create a buying opportunity for long-term investors, as valuations would drop, and FCF would rise.
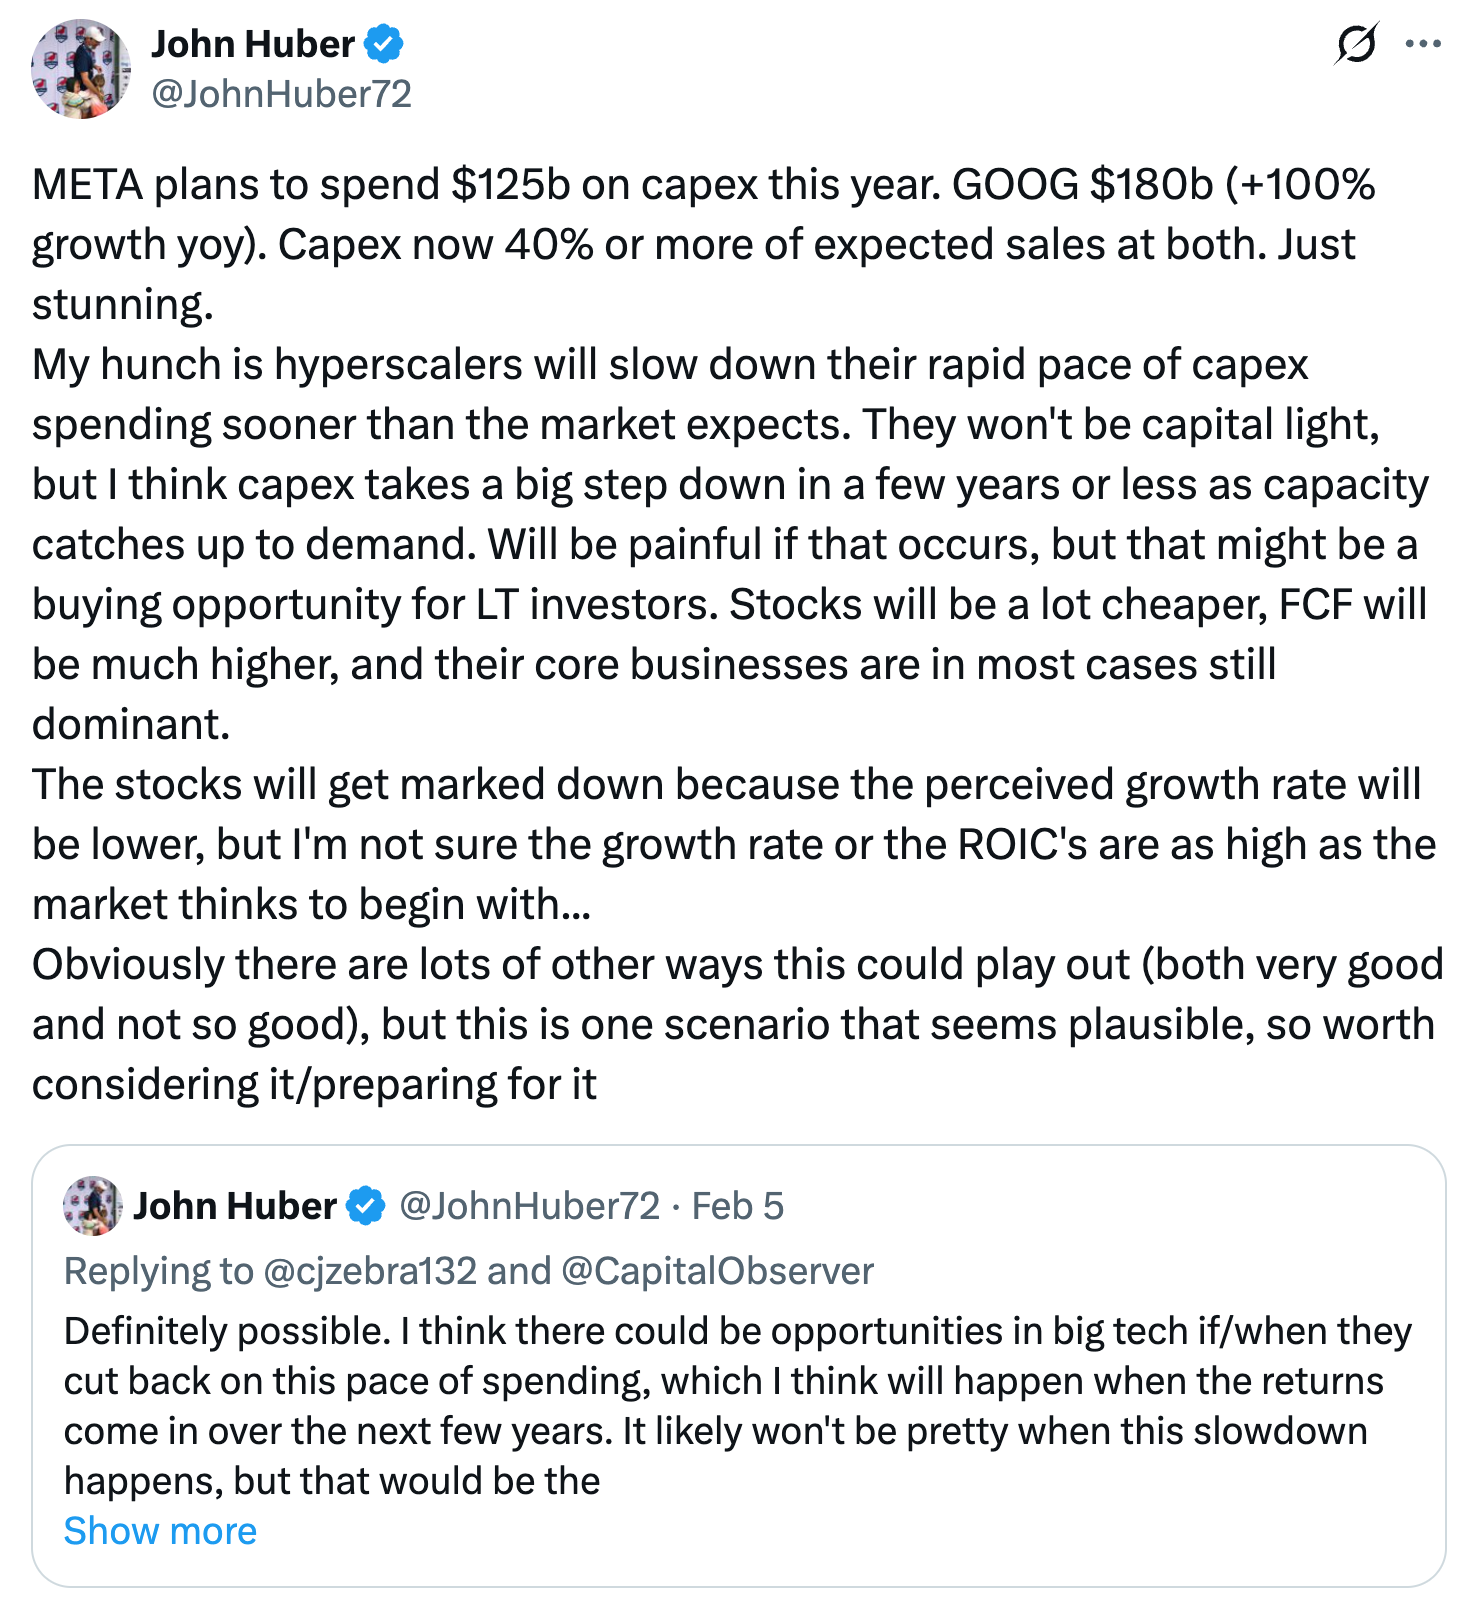
In this scenario, these companies could still dominate their sectors, but investors would need to be prepared for a period of slower perceived growth. The trade-off would be a more efficient use of capital, with higher returns on investment over time.
Preparing for the Future: What Should Investors Expect?
Given the immense scale of these companies’ investments, the key question for investors is whether the returns will materialize as expected. The significant growth in OCF over the past year suggests that it’s possible for these companies to continue generating strong cash flow. But with projections of such massive investments, the road ahead may not be as smooth as it seems.
What happens when the pace of CapEx slows down? Will these companies continue to generate high returns on incremental investments, or will the market mark them down because of lower growth expectations?
The next five years will be critical. The $5.39 trillion in CapEx and R&D spending is a bold bet on the future, but the real question remains: Can they achieve the incremental cash flow growth needed to justify this spend? If they can, the rewards could be immense. If not, the impact on stock prices could be significant.
As always, the balance between growth, investment, and profitability will determine the fate of these companies – and the opportunity for investors.
Extraordinary CAPEX spending has become a defining feature of the hyperscalers, but treating them as a homogeneous group misses the point. Not all capital is being deployed with the same discipline, focus, or likelihood of generating acceptable returns.
Meta is the clearest example of capital misallocation. Over recent years it has burned tens of billions annually on moonshot projects, most notably the Metaverse, a strategy so central it prompted a corporate rebrand. Framed generously, this spending looks speculative; more realistically, it shows little prospect of producing meaningful returns any time soon, if ever. From a shareholder perspective, it is difficult to justify this scale of investment relative to the visibility of outcomes.
Amazon’s CAPEX profile looks fundamentally different. Its spending is targeted and diversified across a collection of businesses with exceptional long-term potential. AWS remains the market leader in cloud infrastructure and is effectively a toll booth on the AI revolution. It is now generating roughly $170bn in annual revenue and growing at around 24%, implying a doubling in under three years and a potential quadrupling within five. Importantly, AWS operates at materially higher margins than Amazon’s retail business, driving steady expansion in group profitability.
As Andy Jassy noted on the most recent earnings call, demand is so strong that the primary constraint is not customers, but the speed at which Amazon can bring new capacity online. He frames this as investing ahead of what the filings show as a strong, contracted and pipeline demand environment, rather than a speculative spend. He highlights that AWS can still run at very high operating margins (around the mid‑30s) even while they are ramping this capex, implying that incremental scale on this base should be extremely profitable over time.
Beyond AWS, Amazon is building a portfolio of high-optionality businesses. Project Kuiper aims to compete with SpaceX in low-earth orbit satellites. Zoox is developing purpose-built autonomous vehicles rather than retrofitting consumer cars, as seen with Tesla and Waymo. Advertising continues to scale rapidly with very attractive margins. Amazon’s in-house semiconductor business is producing chips that management claims are around 40% more price-performant than NVIDIA’s offerings, and these chips are already being used by Anthropic to train the Claude large language model. Viewed this way, Amazon is less a single company and more a federation of businesses operating under one capital allocation framework.
Seen through that lens, Amazon’s projected $200bn CAPEX spend in 2026 appears far less alarming. Spread across multiple profitable and fast-growing subsidiaries, with clear demand signals and immediate utilization, the odds of achieving attractive incremental returns look materially higher than headline numbers alone would suggest.
A further distortion emerges when comparing CAPEX across large tech companies without adjusting for stock-based compensation. Many firms are effectively spending enormous sums each year simply to offset dilution. This is often buried in footnotes rather than highlighted in GAAP summaries. Alphabet’s most recent earnings report shows nearly $48bn spent on offsetting stock-based compensation and paying associated taxes upon vesting (don't look at the SBC numbers in the cash flow from operations section - that is a fiction - a market value at the time of issuance, not the real value at the time of vesting). The capital used for this purpose produces no return for outside shareholders; it is a direct transfer of wealth to insiders and employees.
Amazon stands out here as well. It does not repurchase shares to mask dilution, so its cost of issuing stock based comp is far lower than its peers and its capital allocation is more transparent. Once you adjust for these differences, Amazon’s investment profile looks meaningfully superior to many peers.
Stock-based compensation also distorts cash flow metrics. Most companies add it back as a non-cash expense, inflating cash flow from operations. As Charlie Munger famously remarked, if employee remuneration is not a cash expense, what exactly is it? Without significant adjustments, free cash flow figures become misleading, particularly when SBC is large and persistent.
In that context, the scary CAPEX forecasts for 2026 cannot be assessed through simplistic, side-by-side GAAP comparisons. The reality is far more nuanced, and the quality of capital allocation matters more than the absolute dollars being spent.
My view is that some hyperscalers will ultimately burn enormous amounts of capital and generate poor returns, with Meta being the most obvious candidate based on recent history. Others, particularly Amazon, may be entering a rare window where unprecedented scale can be achieved with genuinely accretive economics by riding the AI wave at exactly the right moment.
Jassy has repeatedly emphasized that AWS is deploying new AI and core infrastructure capacity as fast as it can be installed, with utilization effectively immediate. He has described this environment as an “extraordinary opportunity” for AWS to scale. Taken seriously, that framing suggests today’s CAPEX surge may prove far more productive than markets currently assume.
Food for thought.
I'm interested in a dedicated analysis of Meta. I've been using their ad platform and find it much better than Google ads. If capex spending flattens out and its ad business keep performing well with an AI background even if their other AI agent, wearable tech doesn't do well, this could be a powerful story. It's tough when Zuckerberg keeps betting the farm over and over again.