

You can read a good chunk of this article entirely for free. If you find value in this research, consider becoming a Premium Member for less than €1/day to support my workd and unlock our full archive and join our growing circle of investors (I highly recommend checking out “The Library” to see what’s inside; you can find it right on the homepage).
Why join the community, you may ask? Our library is fast approaching 70 comprehensive deep dives, providing institutional-level research on some of the world’s most fascinating businesses. Most recently, we’ve dissected companies like Mercado Libre ($MELI), Grab Holdings ($GRAB), Fair Isaac ($FICO), and Topicus.com ($TOI).
As a member, you get:
Complete Access: Every deep dive in our library (65+ and counting). The most thorough analyses you will be able to get your hands on (including downloadable models).
Slide Decks: Every deep dive now comes with a companion slide deck. It’s the whole argument in compressed form – the hypothesis, the business, the competitive position, the valuation, and the case against – for the days when you don’t have an hour to spare but still want the shape of the thing. Paid subscribers get both, the long piece and the deck.
More Content: Company updates; powerful valuation spreadsheets, frameworks, and processes; regular portfolio updates (insights into my investing decisions); market commentary; etc.
The WhatsApp Community: Real-time discussion and networking with like-minded investors.
Digital Investing Conferences: About three times a year, we also hold digital conferences where members present and share stock ideas, and discuss broader themes, and we’d love for you to join in!
Incredible Value: Full access to all of this for less than 1€/day.
If you want to see the level of research we provide before committing, the following deep dives are, for instance, free to read (access them via The Library):
InPost ($INPST) - generated an IRR of >400% as an acquisition offer emerged 2-3 months post write-up
DigitalOcean ($DOCN) - up 5x in less than a year post write-up release
I could write a book about discounted cash flow analysis. The variations, the sequence of steps, how you arrive at each input and what each input actually means, why a margin of safety belongs in the process at all, why thinking in ranges beats thinking in points.
I realize that I sometimes struggle to keep my posts concise. There is always more I want to hand over than one post can carry, and the result tends to be bloated enough that nobody gets through it.
So I am going to be narrow here. One problem. At least I will try.

A DCF is artificial by construction, and that artificiality is spread unevenly across the model. Some of it does no damage at all. Some of it costs you money without ever announcing itself, and the expensive part tends to be the part investors spend the least time on.
If you buy quality and hold for growth, as I do, this matters more to you than to almost anyone else, for reasons I will get to.
In yesterday’s write-up on Wise, I put it this way:
“Investors like straight lines. We build models in spreadsheets where each column is slightly larger than the one to its left, and something in the presentation of that arithmetic persuades us that reality will cooperate. It rarely does. You might forecast a topline CAGR of 13% over the next four years. A 1% margin expansion each year. The reality looks different. Maybe 18% next year, followed by 7% the year after. Real businesses sprint, stall, take a step backward, hit an obstacle nobody modelled, and then sprint again. What separates a temporary setback from a broken thesis is not the size of the stumble. It is whether the destination changed.”
Wise Can’t Catch a Break! ... And Remains the Most Misunderstood Company in the Market

You can read this article entirely for free. If you find value in this research, consider becoming a Premium Member for less than €1/day to support my work and unlock our full archive and join our growing circle of investors (I highly recommend checking out “The Library” to see what’s inside; you can find it right on the homepage).
I wrote that about a business, Wise, and not about a theoretical model. Yet, the same complaint applies to DCF models. Most DCF spreadsheets I’ve seen move in straight lines. Three growth stages. Constant Growth. Simple.
As a result, every DCF ever built describes a company that does not exist, growing in a manner no company has ever grown, before settling into a maturity no company has ever settled into on schedule.
That sounds like a devastating criticism. It mostly is not, and working out where the criticism stops being harmless and starts costing you money is the point of this piece.
Before I get there, we need to be clear about what a DCF does at the far end, because there is more than one way to finish one.
Every model needs an ending …
A DCF says something simple. A business is worth the cash it will hand its owners over its life, discounted back to today at a rate reflecting what else you could do with the money and how uncertain the cash is.
Clean idea, right?
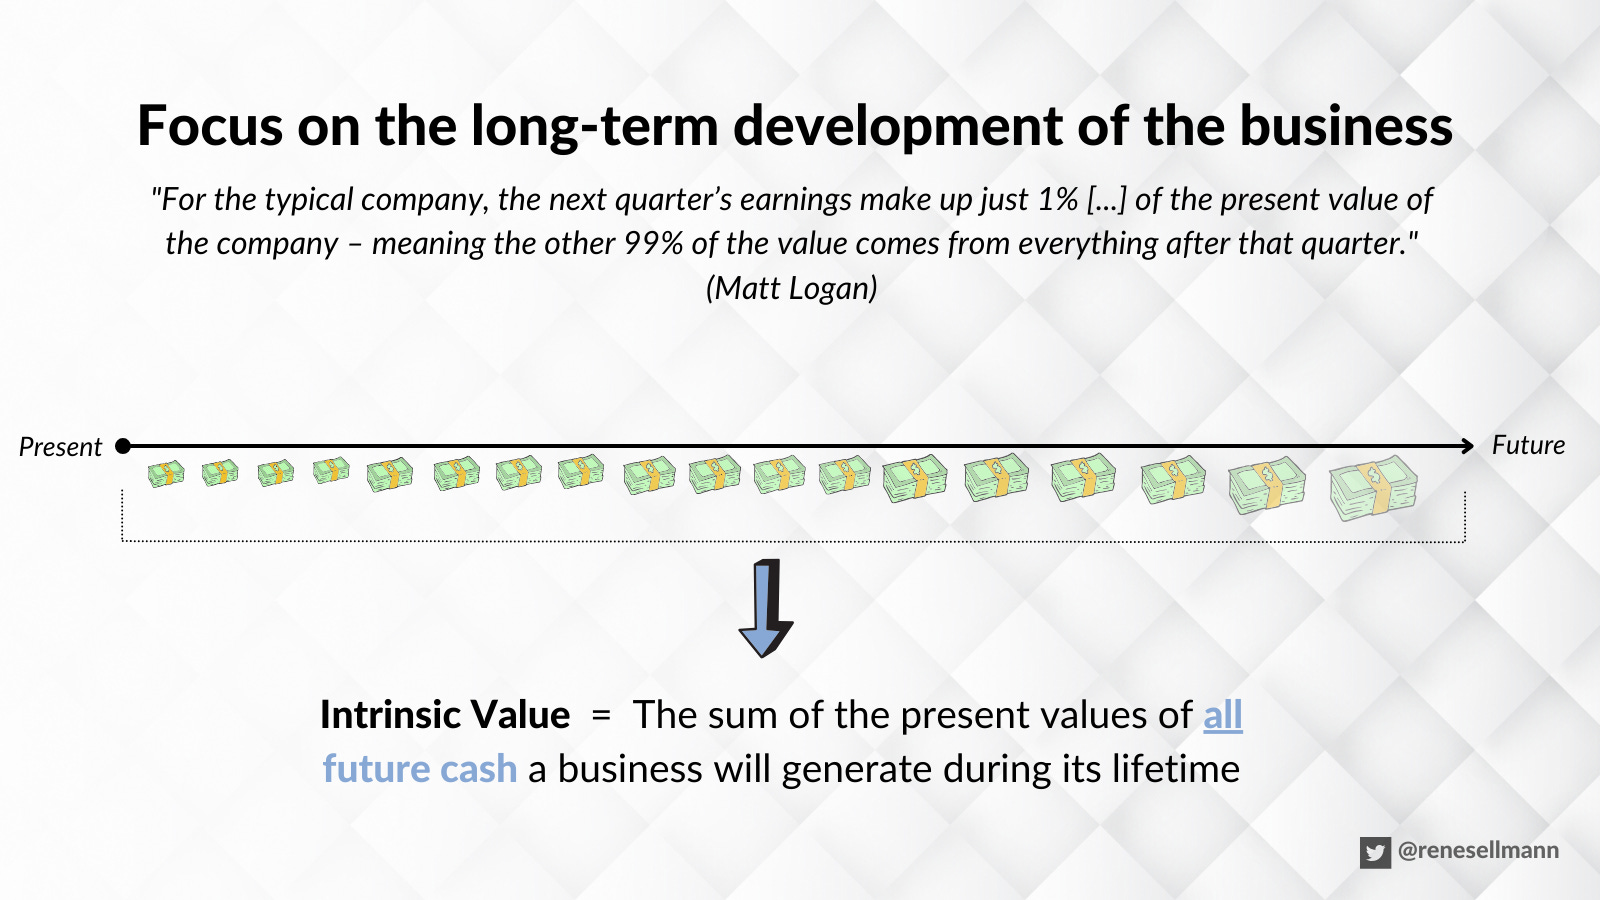
The trouble arrives because businesses do not have a known life, and neither you nor I can forecast a cash flow in year 47. So the model gets split in two. There is an explicit forecast period, where you determine the growth the company will grow at, and there is everything after that, compressed into a single figure called the terminal value.
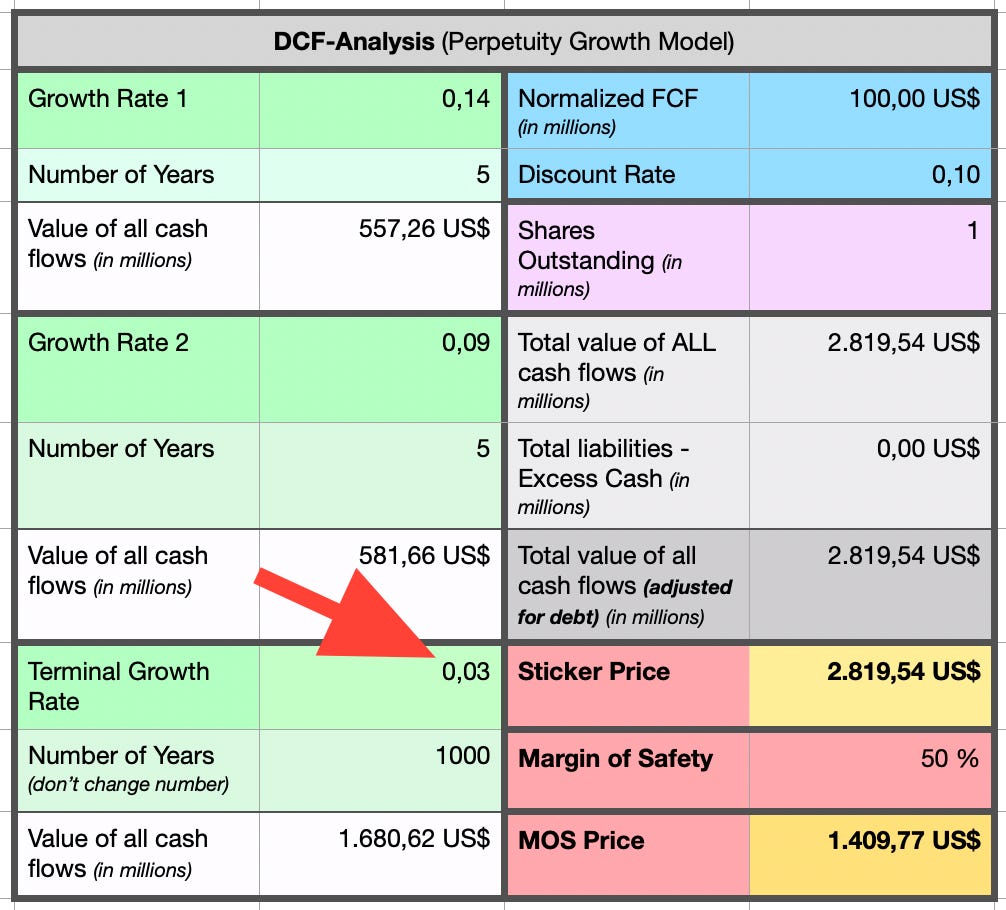
In my own framework, the explicit period runs ten years, broken into two stages. Years one through five get one growth rate, years six through ten get a lower one. A high-quality business might get 14% in the first stage and 9% in the second. Then the model has to end, and here the conventions diverge.
The first approach is the perpetuity growth model. You assume that after the explicit period the business grows at a constant rate forever, and you value that stream. Most investors settle somewhere between 2% and 3% for that growth rate, roughly in line with long-run inflation.
The second approach is the terminal multiple, or exit multiple. Rather than assuming perpetual growth, you take the final year’s earnings, EBITDA, or free cash flow and apply a multiple to it, generally drawn from where comparable businesses trade today or from what acquirers have recently paid.
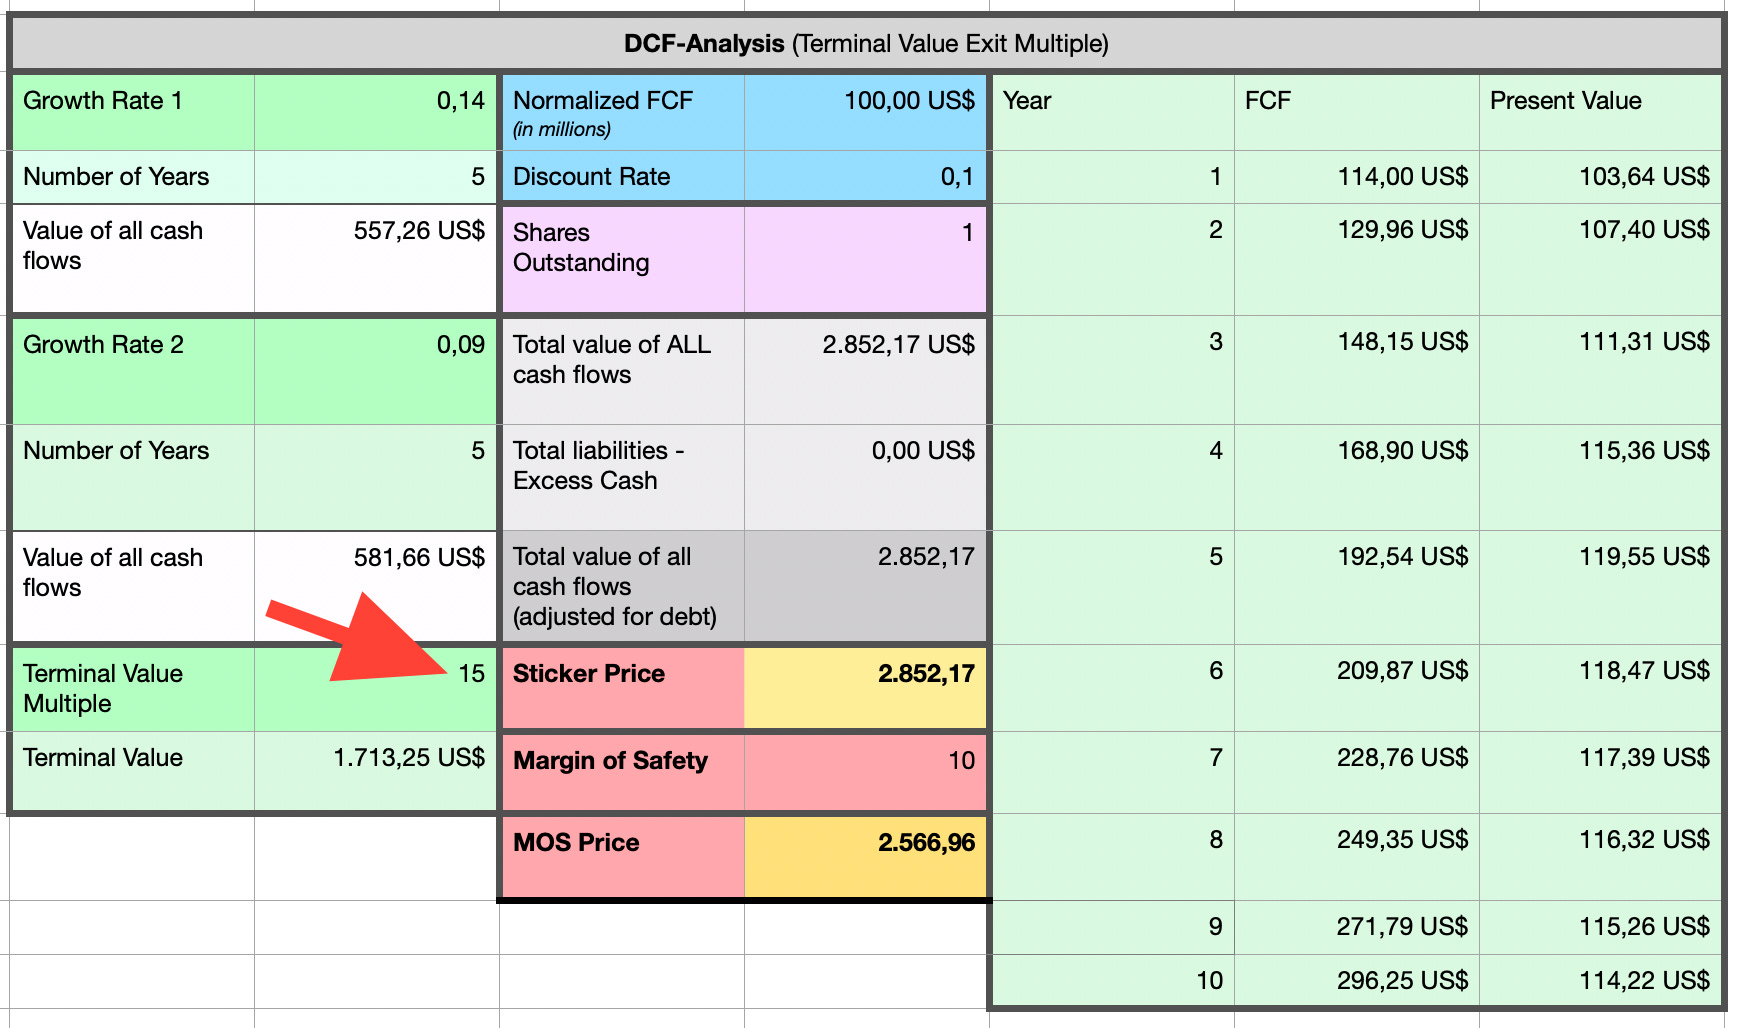
Sell-side models lean on this heavily, and so does most private equity work, for the reasonable reason that those models are usually built around an eventual exit. If you intend to sell the asset in year ten, asking what a buyer will pay is the reasonable question to ask.
For someone buying a listed compounder with no intention of selling, that approach carries a problem baked into it. You are importing a relative valuation into an absolute one. The multiple comes from the market, so you have outsourced the most important assumption in your model to the same market whose pricing you were trying to assess independently. When the market is enthusiastic, your terminal value inflates. When it is miserable, your terminal value collapses, and your DCF obligingly tells you the business is worth less, which inverts what an intrinsic valuation is for.
There is a second, subtler flaw: The multiple you observe today attaches to a business at today’s stage of maturity. Some investors apply it to the same business ten years older, ten years further into its S-curve, with a growth rate that by their own model has already stepped down twice. A business growing 9% does not deserve the multiple of a business growing 20%, and yet analysts routinely lift the current multiple and drop it into year ten unchanged.
Problematic.
None of this makes exit multiples useless. It makes them a different tool answering a different question, and it makes the two methods most valuable when you run them against each other. This is the practical habit worth building, and it takes about ninety seconds.
Whatever perpetuity growth rate you chose, compare it to the value of a reasonable terminal multiple, and consider the multiple you have implicitly assigned to your terminal cash flow.
Then reverse it. Take whatever exit multiple you find defensible, and solve for the perpetual growth rate it implies. If your 3% terminal growth turns out to imply a 14 times free cash flow multiple on a business you have argued will still be earning premium returns in 2036, you have learned something.
If your 20 times exit multiple implies 5% perpetual growth, you have learned something too, something somewhat alarming, because you just asserted that this company outgrows the economy until the end of time.
Questionable.
Both methods embed a claim about forever. The perpetuity model states its claim openly and invites you to argue with it. The exit multiple hides the same claim inside a number that take a second to jot down in your spreadsheet.
Neither is more rigorous. One is more honest about what it is doing, which is why I use it.
It’s all fiction!
Of course, the used compounded growth rate - take the 14% for years one to five mentioned above - does not necessarily imply that the business grows at that rate every year. It claims where the business ends up after five years.
A company need not deliver 14% to the decimal in each of the first five years for a 14% first-stage assumption to describe its trajectory accurately.
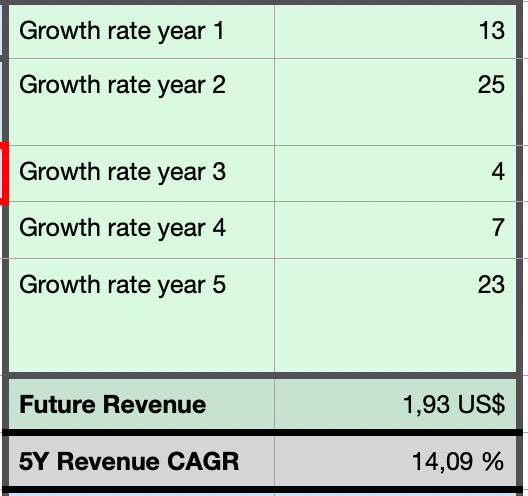
A path of 13%, then 25%, then 4%, then 7%, then 23% compounds to 14.09% over five years, and that’s likely a more accurate description of how a business behaves. A strong year, an air pocket, a recovery, then a new product or a new market starts contributing.
The spreadsheet column reading 14% five times in a row and the messy path arrive at the same place.
So what exactly is the complaint?
Every model is a simplification. The question worth asking is which simplifications cost you money, and this particular one costs you less than its obvious wrongness suggests.
Three flaws are worth highlighting:
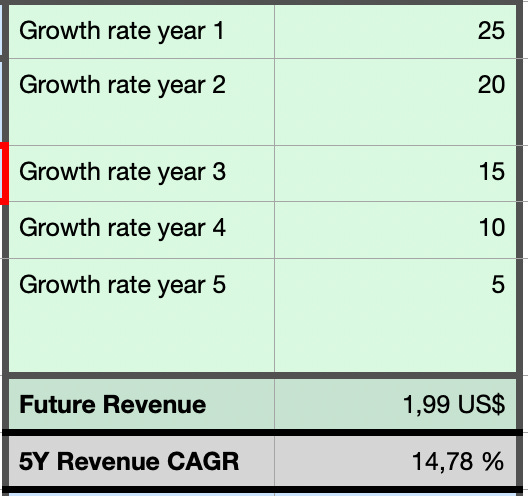
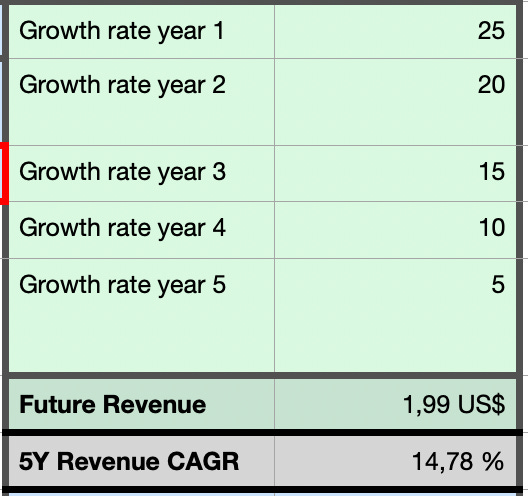
The first is arithmetic. Discounting cash flows cares about the order in which cash arrives – as future cash is less valuable in a DCF due to the time value of money –, so two paths with identical compound growth rates and identical ending cash flows are worth slightly different amounts today. Take a business generating $100 in free cash flow, a 10% discount rate, and two five-year paths. The front-loaded path grows 25%, 20%, 15%, 10%, 5%. The back-loaded path runs the same sequence in reverse. Both turn $100 in earnings power in year zero to $199 in year five, and both compound at an identical rate. Strictly speaking, the front-loaded path is worth more than the back-loaded one, though. It doesn’t make a major difference – somewhere in the vicinity of 3-4% – but it is something worth acknowledging, though, hardly worth agonising over.
The second is that reinvestment does not follow a smooth line either. A business accelerating from 6% to 24% growth is most likely reinvesting (more) aggressively, funding working capital ahead of shipments, and often committing capital a year or two (or more) before the increased earnings power shows up. Its cash conversion in that sprint year will be worse than a smooth DCF model implies, sometimes considerably worse, and its conversion in the stall year afterwards will look better than it deserves. Your model shows a placid ramp, which you rarely encounter in the real world. I’m going to reference the example of Alphabet again, as it serves the purpose of illustration very well right now.
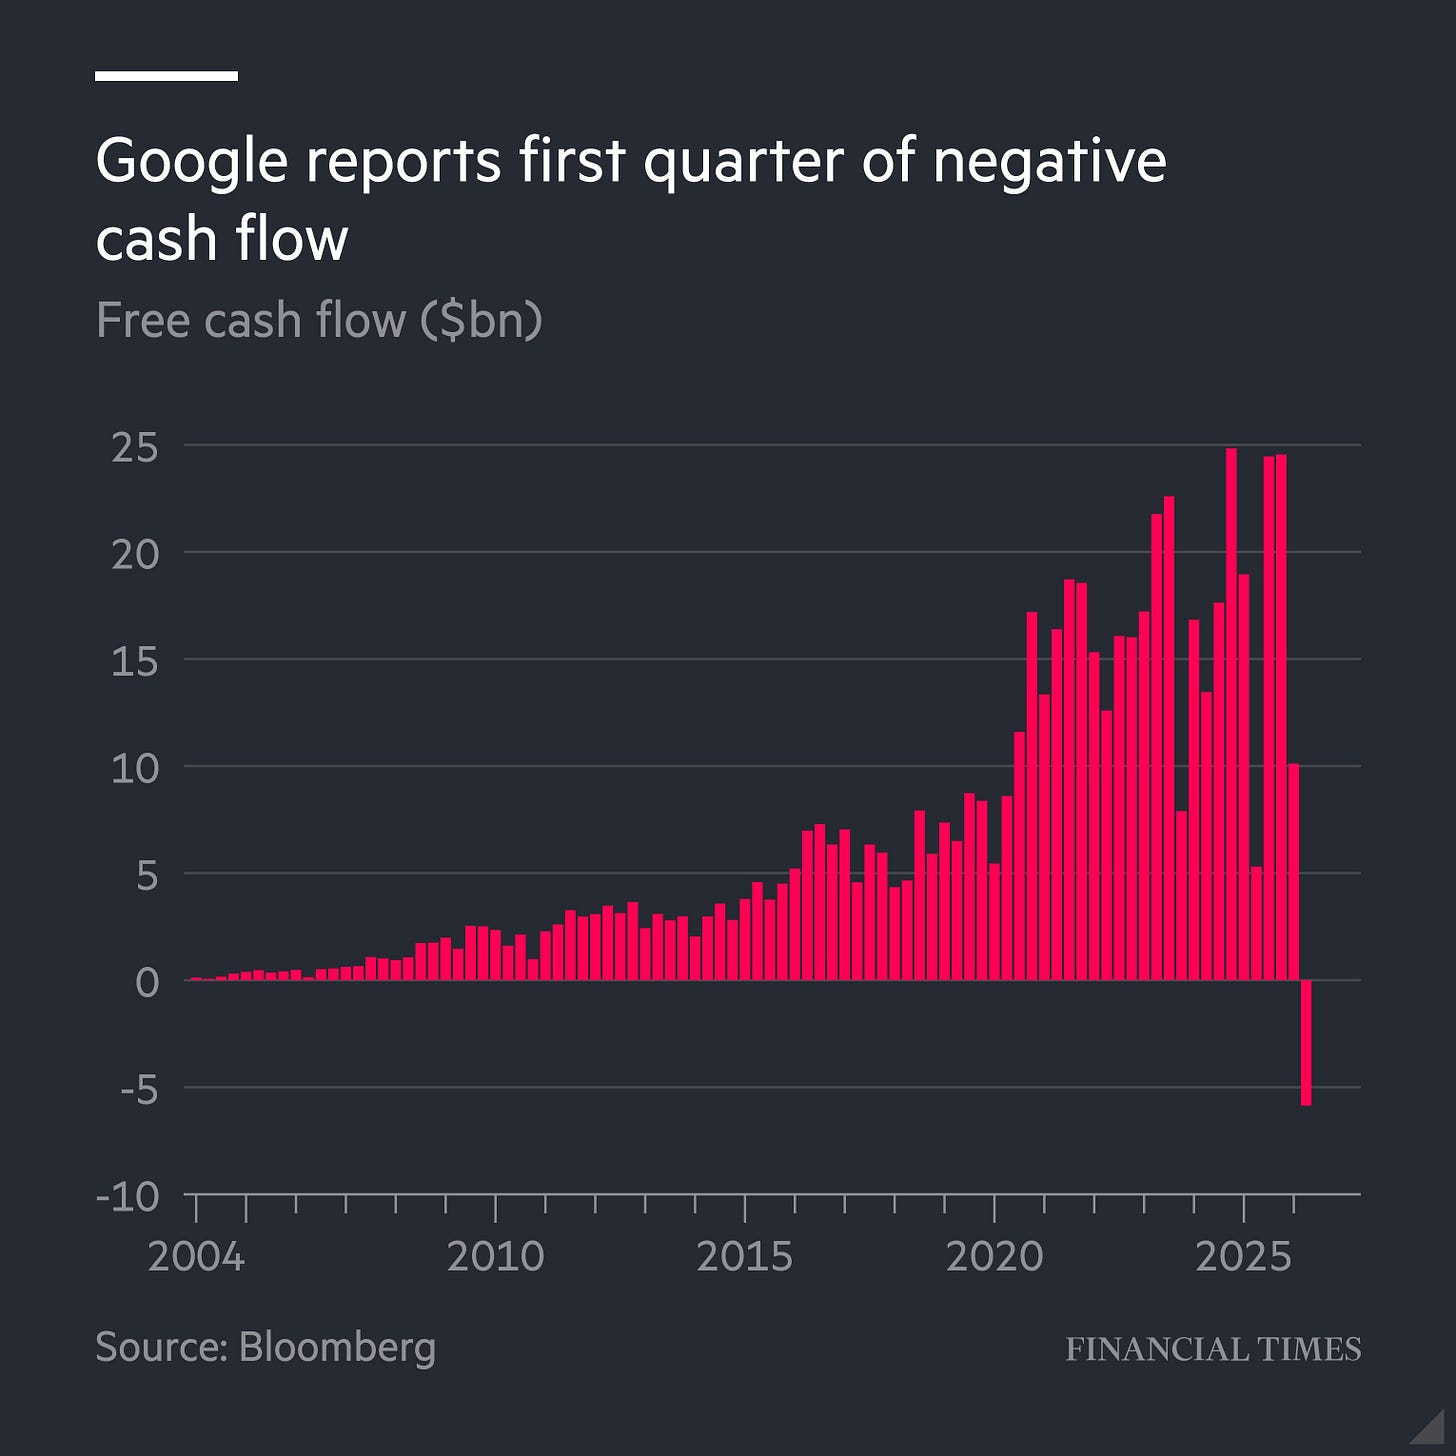
The company lives through a sequence where the cash generated in 2026 bears little resemblance to the cash generated the year before. For a business with a strong internal cash generation and a strong balance sheet this is not that relevant. For a business funding growth externally, the sprint years are when often new equity gets issued.
Thirdly, the straight line approach of DCFs may train your brain and thinking about your hypothesis in a suboptimal way. An inexperienced investor may look at a column of numbers rising by a consistent percentage, and may start to treat any deviation as evidence that something has broken. The company guides down for a quarter, the organic growth number prints 7% against your 13%, and the model in your head says the thesis is broken. However, in my view, and we discussed this in yesterday’s Wise piece, what separates a temporary setback from a broken thesis is whether the destination changed. A model built out of smooth increments has no room for a temporary stumble. It cannot represent one, so when a stumble arrives you have nothing in your framework to compare it against, and you improvise under pressure.
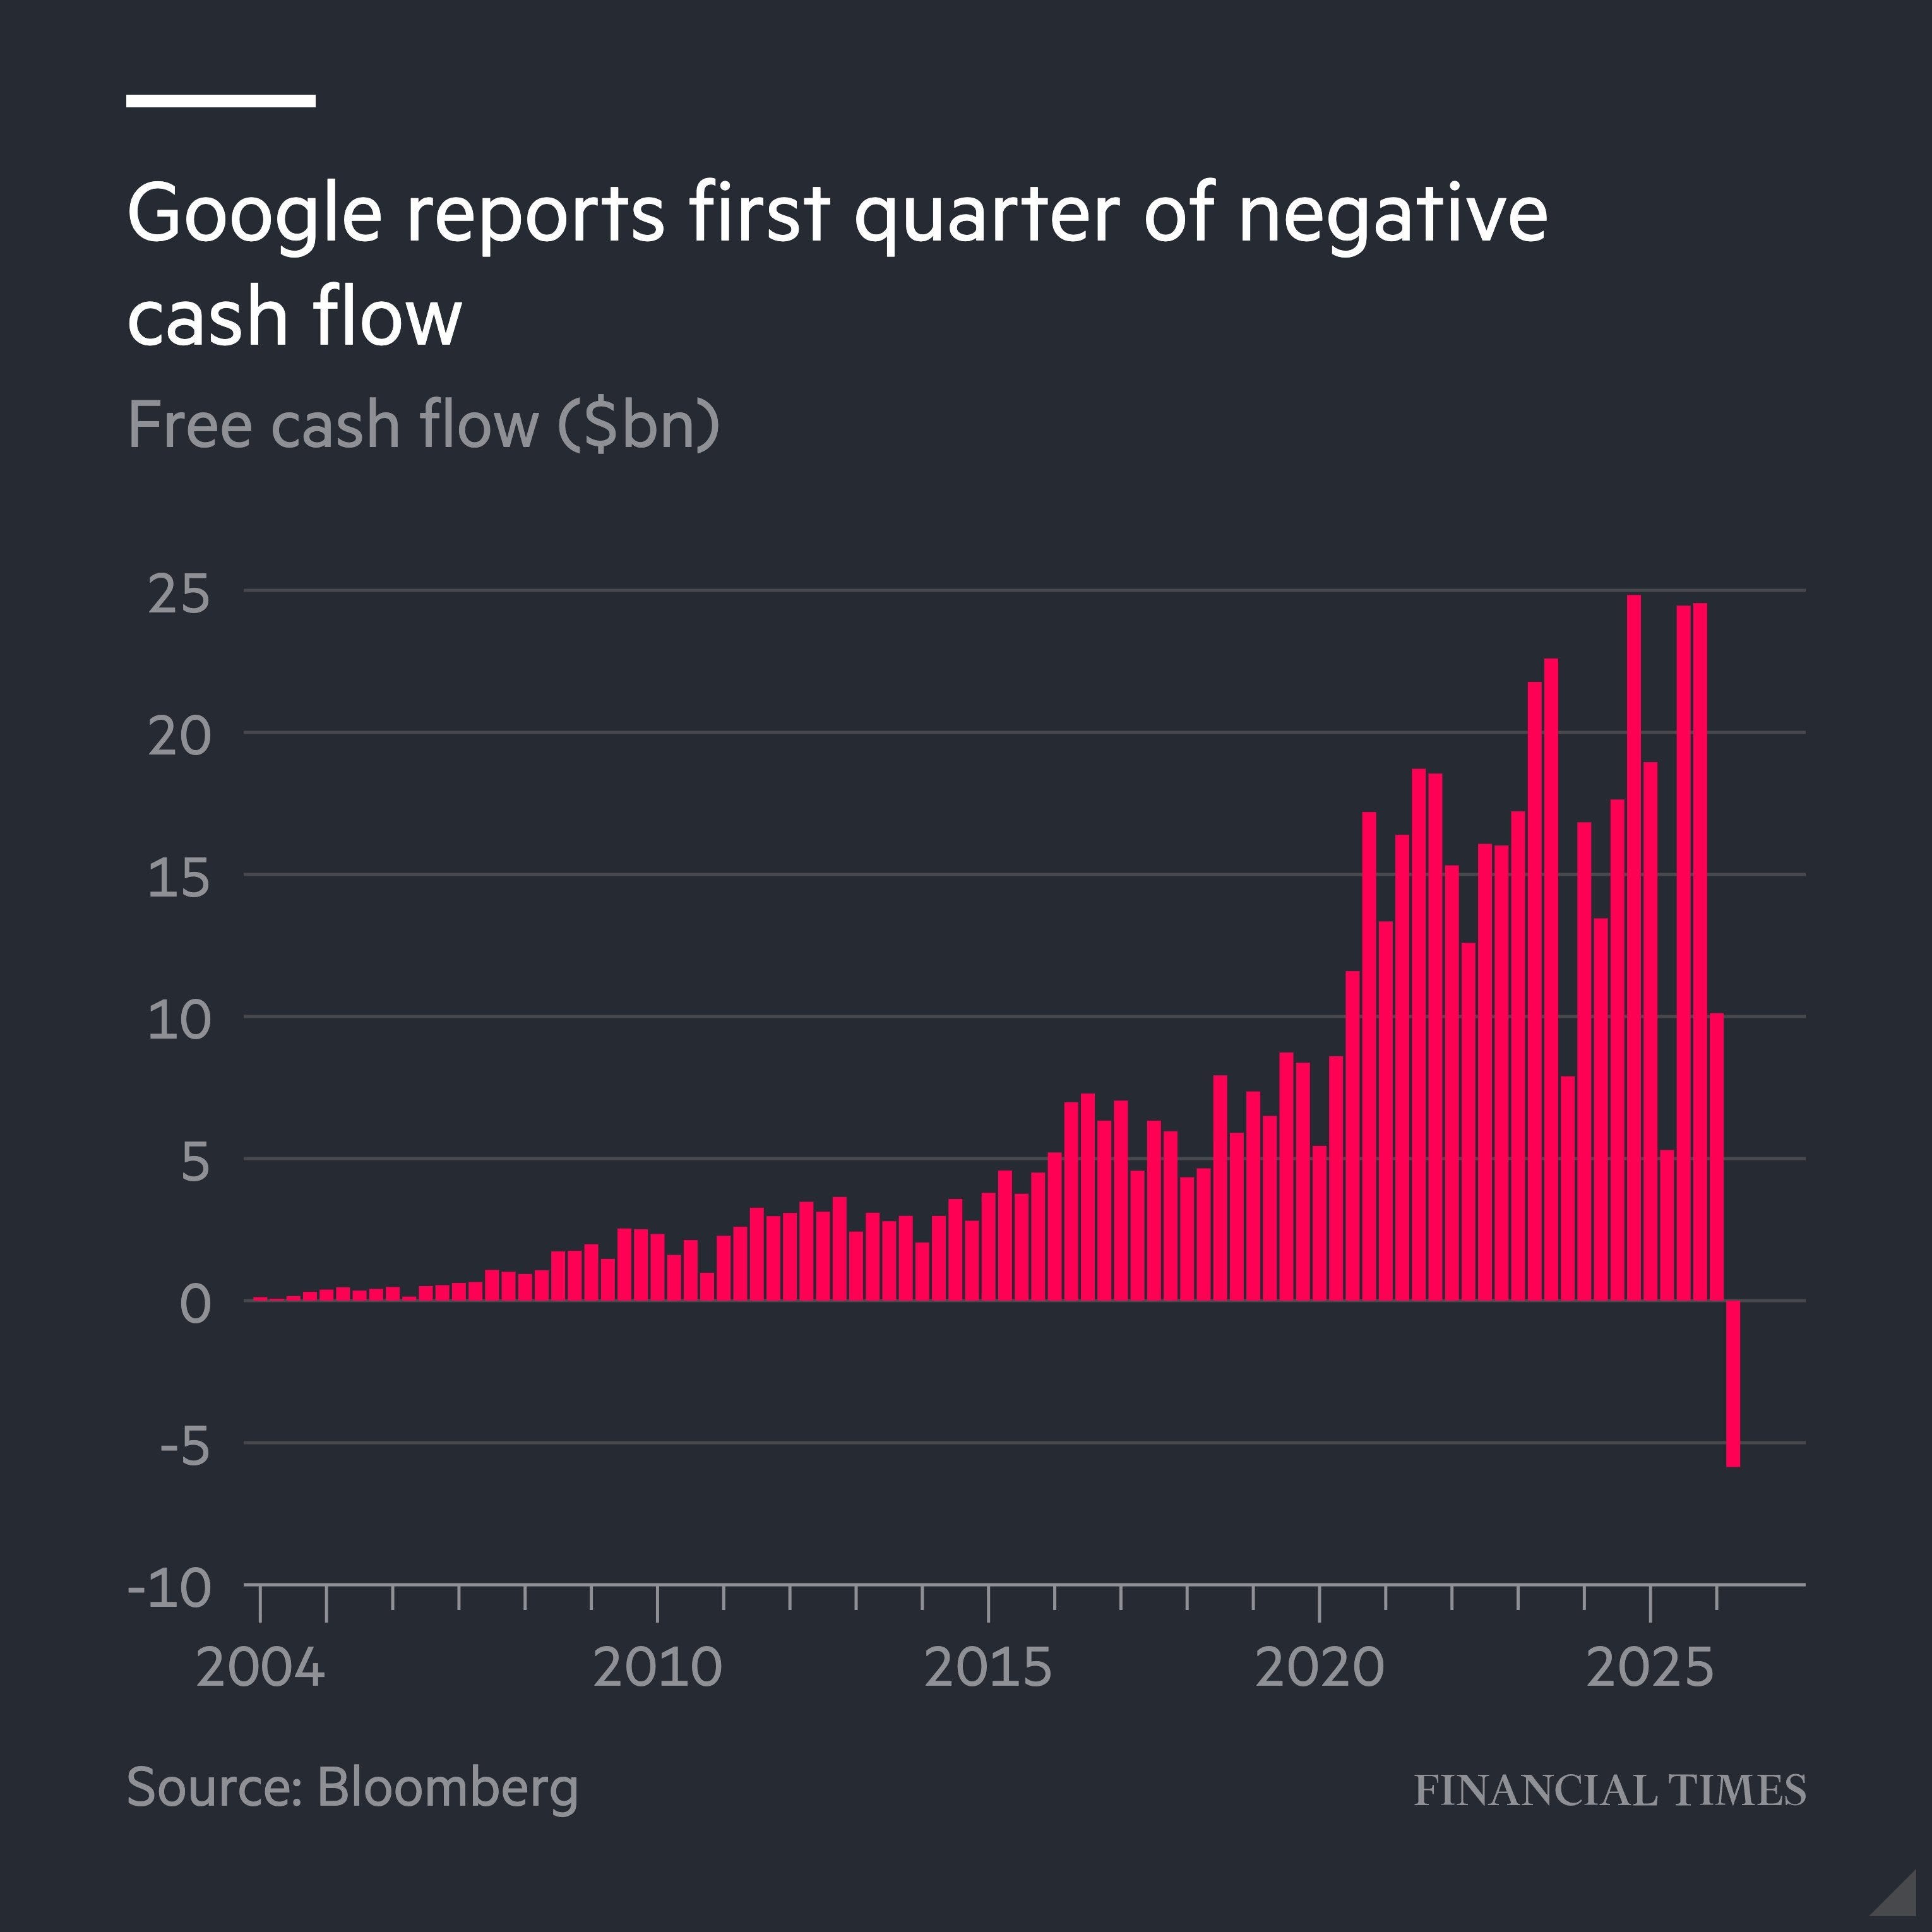
So the smooth line approach inside the explicit forecasting period is a fiction; theory vs. the real world of business. It’s not a big deal, but worth acknowledging.
However, something else is going on further down the model. The same criticism that lands gently in years one through ten lands hard at the point where the explicit period ends.
Artificial Cliffs
Look at what the illustrative example model above asserts. Years one through five, the business grows at 14%. Year six arrives and it grows at 9%, a step down of five percentage points occurring between two years for no obvious reason connected to the company.
Then year eleven arrives, growth falls to 3%, and stays there until the heat death of the universe.
My own template runs the terminal stage as a thousand years of cash flow, which I find useful to see written down (even though whether you opt for 1,000, 100 or 50 years makes little difference to the actual terminal value; again, the concept of time value of money applies here), because it makes explicit what the perpetuity formula is doing behind a tidy piece of algebra.
Both growth step-downs appear on a calendar boundary existing because I built the model in two stages of five years. Had I built it in three stages of four, the deceleration would have arrived at different moments – and be more gradual –, yet the business would have had no way of knowing the difference.
My point is, the timing and shape of the “fade” is one of the most consequential features of your forecast, and the architecture of the spreadsheet is setting it.
Now put that next to the evidence. McKinsey, in one of its research efforts, sorted companies into quintiles by revenue growth and followed each cohort forward. The pattern is no staircase as in your typical DCF model.
Rather, it is a curve, yet a steep one.
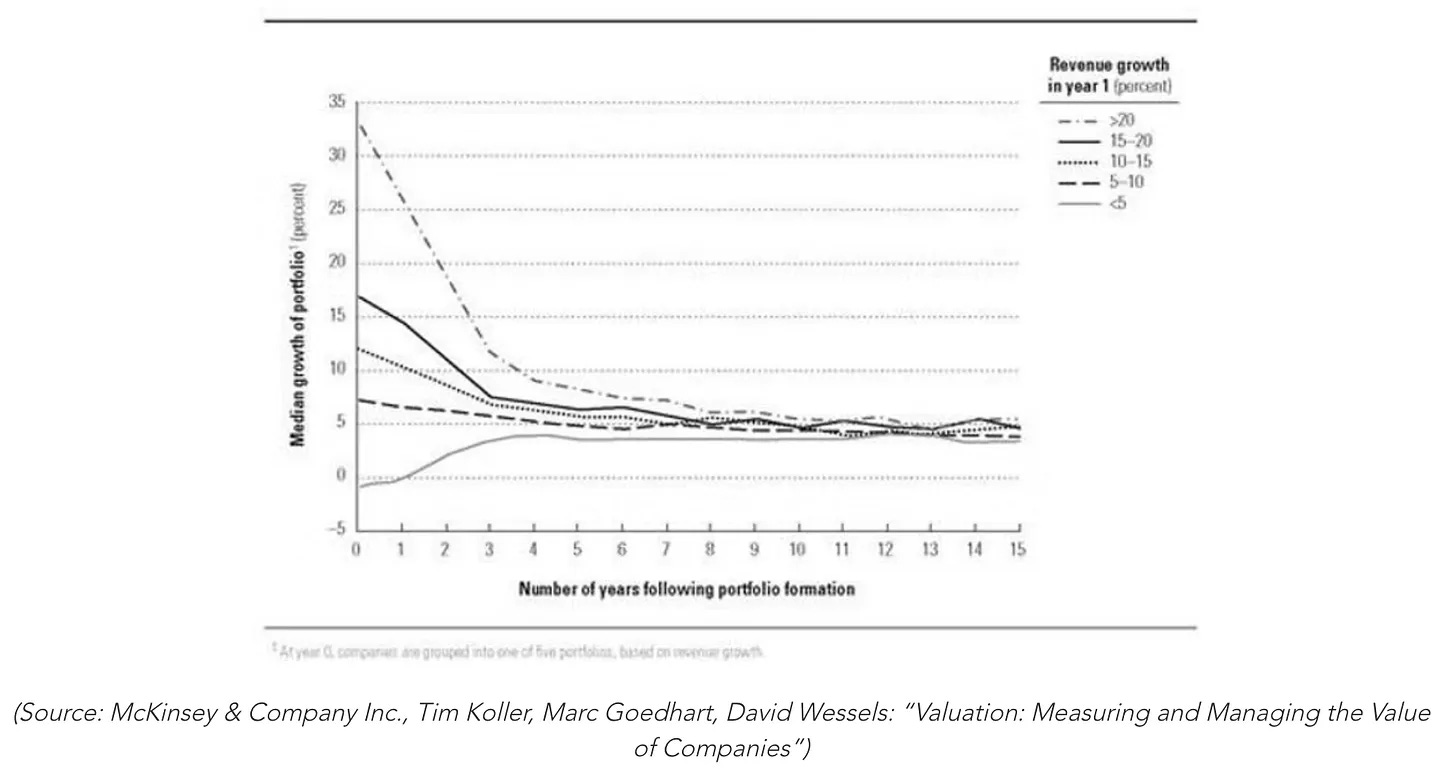
Businesses growing above 20% in year one are down to roughly 8% within three to four years. The 15% to 20% cohort halves inside five. By year ten, every cohort has converged to around 5%, roughly nominal GDP, because no group of companies can outrun the economy indefinitely without becoming the economy.
“Analysts have been persistently over-optimistic for the past 25 years, with ‘earnings’ estimates ranging from 10 to 12 percent a year, compared with actual earnings growth of 6 percent. |...] On average, analysts’ forecasts have been almost 100 percent too high.“
That cuts in an uncomfortable direction for anyone who thinks the standard structure is conservative. Assume 14% for five straight years and you are already claiming your business defies the median path by a wide margin, since the median 15% to 20% grower is nowhere near 14% by year four.
Most of investors’ “fantasy” (read: overconfidence or misjudgment) can be found in the first stage, and it does not feel like fantasy, because it is expressed as a single unremarkable number in a green cell.
A median is not a destiny, though, and this is where tension arises. A quintile is a crowd. Inside it sit the businesses that did compound at 12% or 15% for a decade and beyond, and if you own quality stocks, your proposition is that you can occasionally identify one business defying base rates in advance.
So the structure is too generous to the typical company and potentially too harsh on the exceptional one, and most investors correct for neither.
The textbook DCF model offers two stages and a terminal rate. Whatever you believe about durability has to be forced through those three cells.
More than the growth rate snaps into place at year eleven, too. Cross that boundary and the model asserts that margins have reached their permanent level, that reinvestment needs have normalised, that competitive intensity has settled, and that all of it happened at the same calendar moment.
Unlikely.
Businesses do not mature the way bonds mature. They mature in pieces, unevenly, some parts commoditizing while others are still expanding.
Here is why this artificiality can cost you. Take the illustration from my own framework: $557 of present value from the first stage, $581 from the second, $1,680 from the terminal stage.
That last figure is 59% of the total.
Ten years of judgment gets outvoted by one cell I filled in by convention, in about two seconds, using a number I have never thought more deeply about.
The terminal value dominates
Once you accept that most of the value sits in the terminal stage, it feels logical to conclude that years one through ten barely matter. Spend your effort on the terminal cell, wave through the rest. Right?
No!
It is wrong, because the terminal value inherits everything. Take a business earning $100 in FCF with a 10% cost of equity, assume our growth rates from above and hold terminal growth fixed at 3%. Our intrinsic value estimate was $2,820. The terminal value $1,681.
Now let’s only vary the five-year high growth period and move it up to 18% (from 14%). The terminal value, too, rises to $1,997.
The terminal growth never changed. The terminal value went up significantly.
Everything you assumed about growth, margins, and reinvestment across ten years flows into the base the formula is applied to, and the perpetuity equation faithfully multiplies your error into infinity.
How long does the moat last?
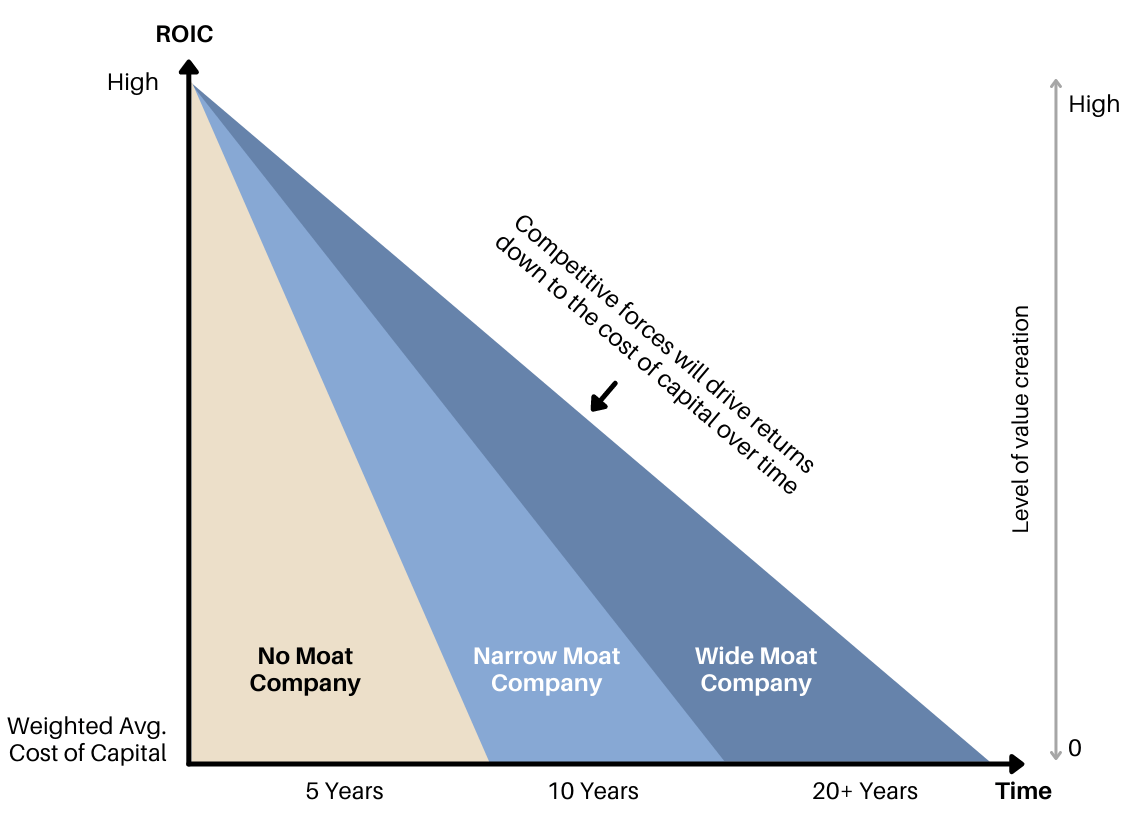
Value gets created only while a business earns more on capital than that capital costs. The moment the spread closes, growth stops mattering. So the durability question has a precise form: how many years does the spread stay positive, and how fast does it narrow?
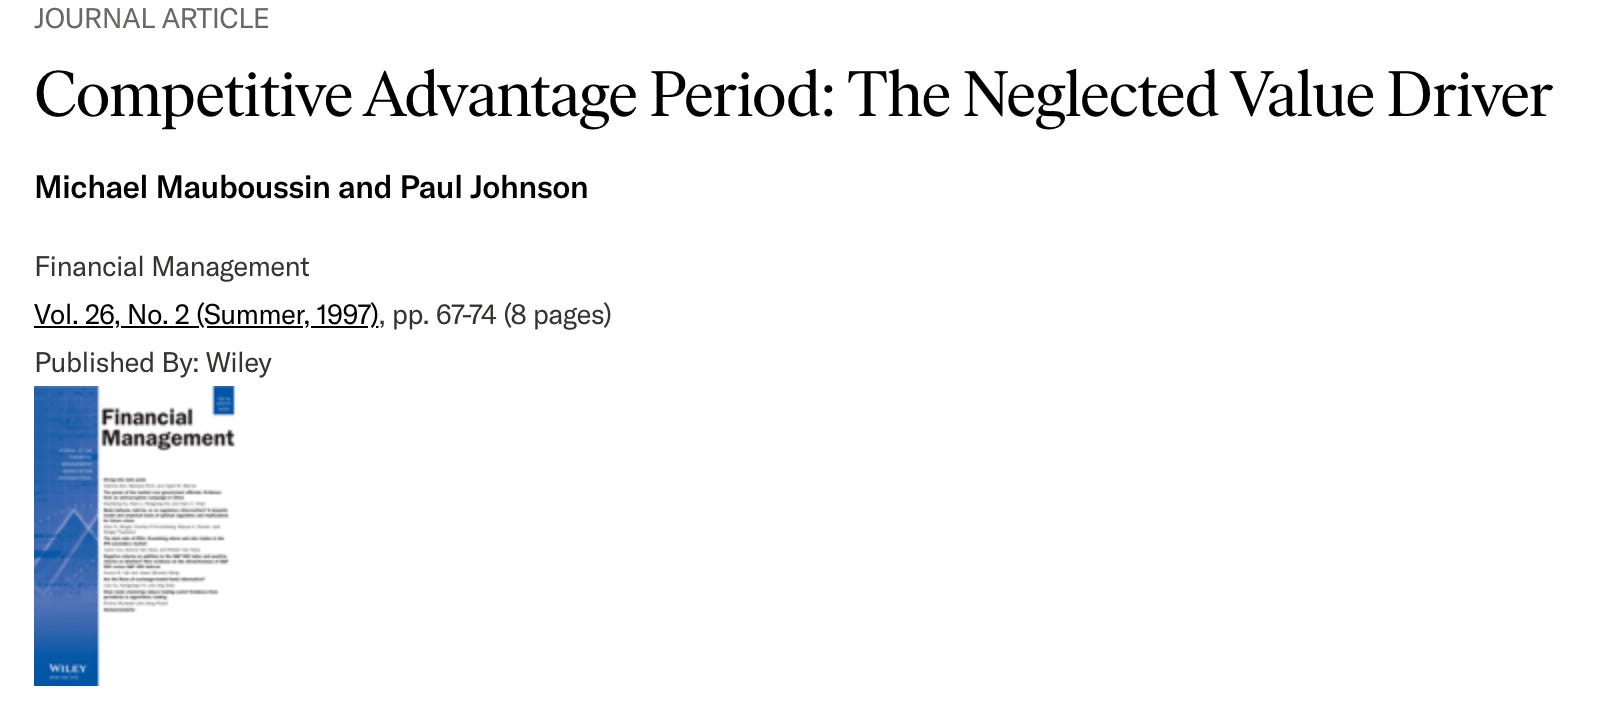
Mauboussin and Paul Johnson named this in a 1997 paper and the concept has never had the attention it deserves. They called it the competitive advantage period and gave it a measure. The fade rate, f, is the exponential decay at which return on invested capital converges towards the cost of capital, and the competitive advantage period equals one divided by that fade rate. Across US stocks the range typically lands between ten and fifteen years, varying by industry and by company.
Here is what struck me. A ten-year explicit forecast followed by a terminal stage where returns have settled at the cost of capital is a statement that the competitive advantage period is ten years. You never typed that number anywhere. It emerged from a structure you chose because five plus five is tidy. For the median listed company, ten years is roughly right. For a business you selected specifically because you believed its advantages were unusually durable, you have applied the median assumption to a company you do not think is median, then congratulated yourself on being disciplined.
Three ways to express a longer runway, none of them clean. You can extend the explicit period to fifteen or twenty years, though forecasting revenue in year eighteen is a different order of fiction than year six, and if the true excess return period runs thirty years, extending the forecast to cover it defeats the purpose of having a terminal value at all. You have replaced one guess with fourteen more. You can fade gradually rather than stepping, letting growth and returns decay year by year at rates you have to justify, which describes the world far more faithfully but takes work per company and moves the answer less than you would hope. Or you keep the structure and let a positive spread persist into the terminal stage. That is Damodaran’s own practice, and he is explicit that it is discretionary: excess returns move towards zero in stable growth, but how far depends on the business, zero for firms lacking sustainable advantages, positive for firms that have them, negative for badly run companies with entrenched management. His reasoning is the one I landed on above. Excess returns outlive high growth by a wide margin, so the terminal assumption should reflect that asymmetry rather than flattening both to nothing on the same date.
I use the third route, and it does not become a licence to justify whatever price you were hoping to justify. Granting a permanent 15% return rather than a cost-of-capital return lifted that terminal value from 1,000 to 1,143. Granting 20%, heroic for eternity, gets you 1,214. Roughly a fifth of additional value for an assumption most people would call indefensible, set against the more than half that ten years of explicit assumptions moved. The dial carrying the durability argument is a gentle dial. I find that reassuring. It means the honest expression of “this is an exceptional business” adds ten to twenty percent, which matters when I am weighing 30 times against 34, and is useless if I am trying to talk myself into paying 60. If your quality argument needs more than that from the terminal stage, you are making it in the wrong place, and it probably belongs in the explicit period as higher growth or better margins, where reported numbers will check you within a few years.
What determines the fade rate is business analysis rather than modelling. Switching costs embedded in mission-critical workflows erode slowly, because the cost of ripping the system out rises with every year of accumulated data and habit. A brand supported by continuous marketing spend requires that spend forever, so the moat is rented rather than owned, showing up as a permanently higher reinvestment rate and a thinner spread than the headline margin suggests. Anything resting on one regulatory arrangement or one distribution partner has a fade rate that can go vertical without warning, and there I would not extend the spread at all.
One further consideration gets missed and it matters for the businesses I favour. A high return with nowhere left to deploy it is not a compounder stock. The competitive advantage period tells you how long the spread survives, not how much capital the company can push through it, and a business earning 25% on incremental capital while reinvesting only 10% of profits is a different proposition to one reinvesting 60% at 18%.

The second creates far more value over a decade despite the lower return.
The gap between your forecast and the base rate is something you have to earn
It takes one keystroke to type 20% growth for ten years into a model. Fewer than five percent of companies ever deliver it. That asymmetry between asserting something and achieving it is why base rates matter, and I have been turning it over for years without the tension resolving, which is why I keep coming back to it.
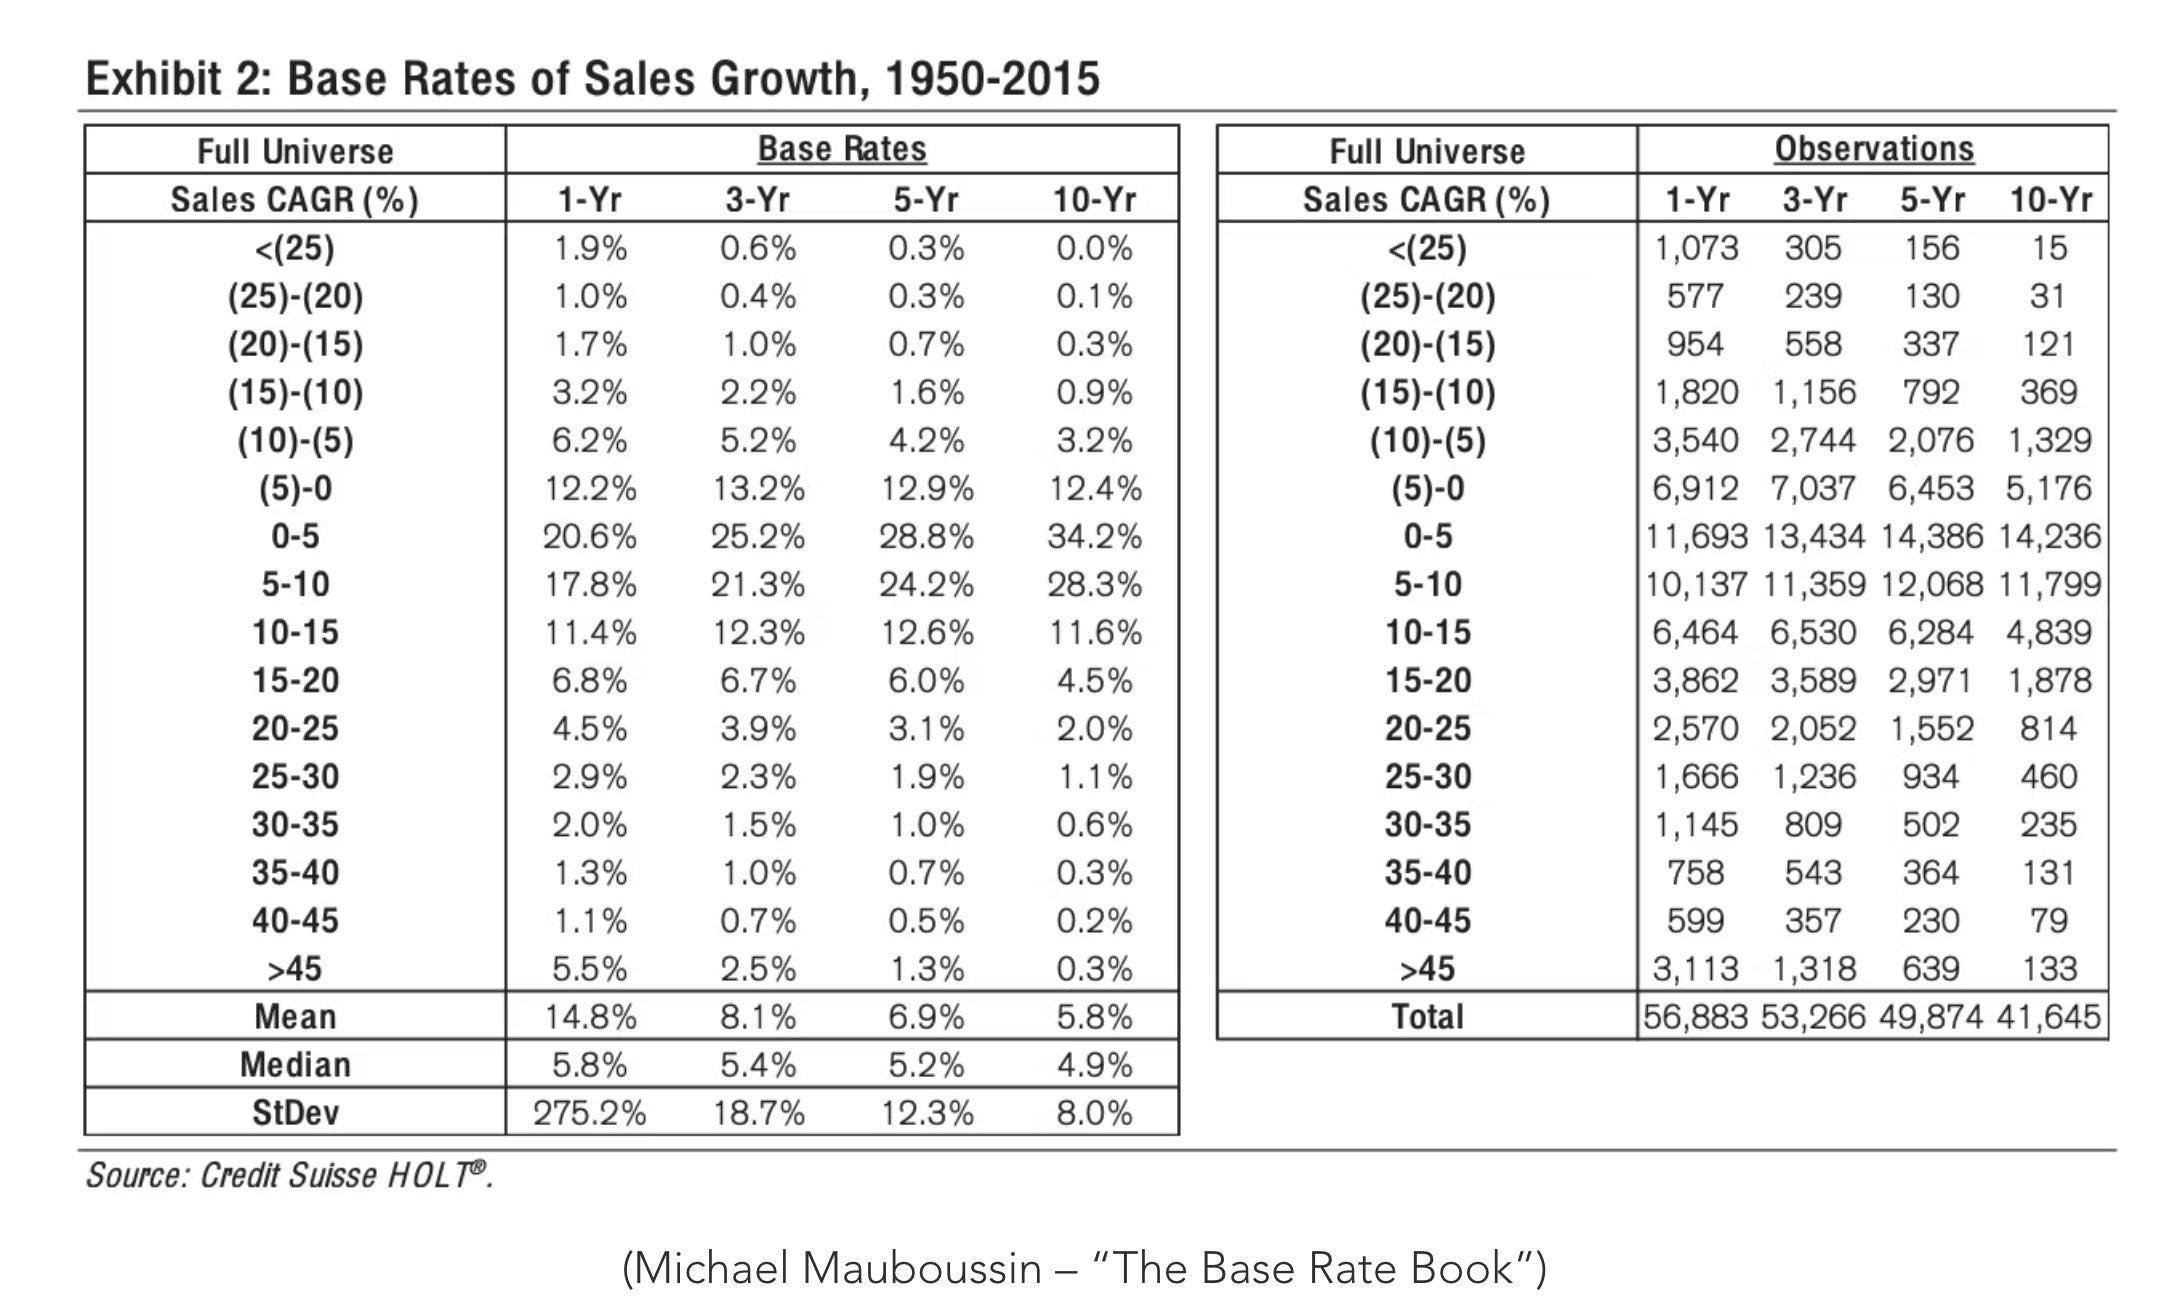
Mauboussin flags base rate neglect more than almost any other error. When you forecast growth you hold an inside view, your own judgment, built from work on one specific company. You have read the filings, listened to the calls, mapped the competition. That view feels authoritative because it was “expensive” to acquire.
It cannot stand alone.
You also need an outside view, an appropriate reference class, and the question of what actually happened to its members.
For Dino Polska the class would be grocery retailers at a comparable stage of maturity, and the question is what they delivered over the following five or ten years on the top line, on profit, on margins.
Base rate neglect is pushing that data aside and building a conclusion from conviction alone.
The data is unkind in a specific way. Mauboussin sorts companies by revenue base, since a business at two billion faces different arithmetic than one at forty, then reads across to the growth rate you are contemplating. Applied to Musk’s 2015 claim that Tesla would grow sales 50% annually for a decade from a six billion dollar base, the relevant decile produced no companies at all that had managed it.
Not few. None.
Buffett ran a version of the same test on profits, and my framework has carried it for years. Of the 200 companies with the highest net income in 1990, only 162 still existed by 2000. Fewer than nine percent of those grew net income at 15% or better across the decade. Not one of them repeated it in the ten years to 2009.
“We started by identifying the 200 companies with the highest net income in 1990. By 2000, only 162 of those companies were still around. Of those, less than 9% (14 of 162) grew net income at a rate of 15% or more from 1990-1999. None of those 14 companies grew at higher than a 15% rate for the decade ended in 2009.“
There is a methodological reason the outside view comes first rather than serving as a check afterwards. Sales growth shows very low year-over-year correlation, so last year tells you remarkably little about next year, which is why you start from the base rate and look for reasons to depart from it. Reverse the order and something predictable happens. You build from company-specific reasoning, arrive at 16%, then consult the reference class, at which point the base rate becomes a hurdle to argue around instead of a starting position.
This is where the exercise gets awkward for someone in my seat. If you buy quality and hold for growth, your proposition rests on the belief that this particular business is one of the rare ones, and the base rates are brutal on exactly that point.
They function as a direct statistical challenge to the thing I have built my process around, and there is no clean escape.
I do not think the discipline lies in choosing between conviction and the statistics of the reference class, and I am suspicious of anyone claiming to have resolved it. What is left is holding both at once. Genuine belief that you have found something exceptional, alongside clear-eyed acceptance that the odds say you probably have not.
Practically, the gap requires the defence rather than the forecast itself. If the class delivered 7% and you are underwriting 13%, six points of excess growth need a mechanism attached, specific enough to be wrong. New store formats at a defined pace with defined economics. Pricing power of a stated magnitude, supported by what happened the last three times prices went up. A category shifting online at an observable rate. When you cannot name the mechanism, you are likely blinded or biased; or both.
Justifying the gap properly, qualitatively takes real work, and often the work talks you down. That discomfort is the signal you are doing it correctly.
Base rate thinking applies to the terminal stage too, and almost nobody applies it there. Your terminal assumption contains a claim about how long an advantage survives, and there is a reference class for that as well, clustering between ten and fifteen years. Companies holding returns above their cost of capital for thirty years exist.
They are rare, identifiable and mostly famous.
If your model implies your business joins them, say so explicitly, because that assertion deserves the scrutiny you would give a 20% growth forecast and it usually receives none.
When EXACTLY does a great business become an average one?
Three percent is a defensible number and I am not about to question it per se. No company grows faster than the economy forever. Push the rate to five and you have asserted that this business eventually becomes the economy, which is simply an impossibility.
However, forever and from year eleven onwards (for a few more years) are different claims, though. A difference your textbook perpetuity growth DCF formula does not capture.
That is where the trouble starts for anyone who looks at “moaty” businesses.
Take a company with multiple structural advantages, enabling it to reinvest at high rates for longer than the outside view would suggest. Switching costs rising every year as the network grows. Or a brand name that has become synonymous with a product category. A cost position competitors cannot match.
Let’s just take Hermès as an example. Do I believe that business grows at 3% in year eleven? No. I think it probably grows at six or seven, then at five a few years later, drifting towards the economy sometime later, maybe in year 20.
The textbook model has nowhere to put that. Our example model above offers 9% through year ten and 3% after, so the entire question of how long the advantage keeps working gets compressed into one step change, on a date chosen because five plus five is tidy. Type 3% at year eleven and you have asserted that the competitive advantage period is exactly ten years. You never determined that number by thinking it through qualitatively. It arrived with the template. Which poses a problem.
For the median competitively advantaged listed company, ten years is maybe roughly right. But as McKinsey also showed, returns on invested capital can remain higher for longer. Put differently, structural advantages seem to persist (and only the ability to reinvest a lot of cash at these rates fades).
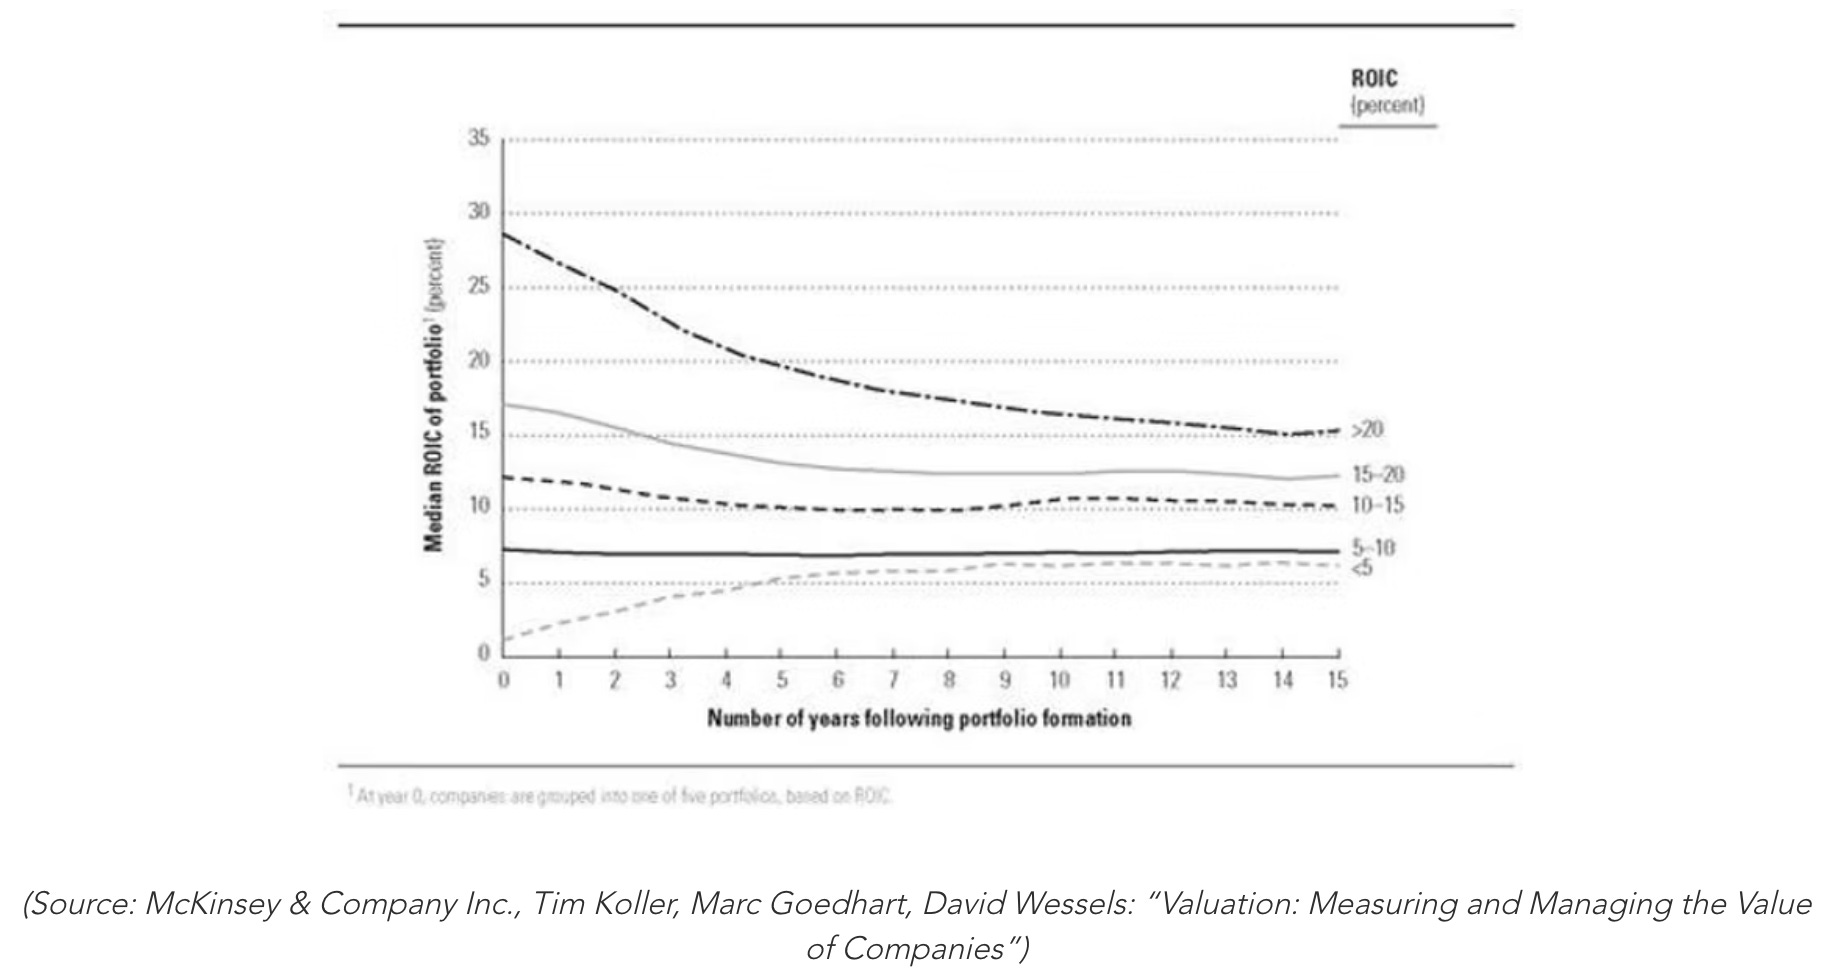
If you stick to the textbook DCF approach, for a business you selected specifically because you thought its advantages were unusually durable, you have applied the median assumption to a company you do not think is median, then congratulated yourself on being disciplined.
Again, look at the two McKinsey charts. Revenue growth converges across every cohort within a handful of years, fast growers and slow growers alike, funnelling towards 5%. Returns behave differently. The top ROIC quintile is still near 15% fifteen years after portfolio formation, having started around 28%, while the middle cohorts barely move.
Growth is fragile. Advantage is sticky.
If a business is still earning exceptional returns in year fifteen, something is still protecting it, and whatever that something is has not finished working by year eleven, and even if reinvestment opportunities fade, if you only reinvest 30% of your cash at 15% ROIIC, you still grow your topline at 4.5% (and not at 3%) – and maybe your business is inflation-hedged on top of this (take payment processing companies for instance).
So what do you do about it? Three options, none of them clean.
You can stretch the second stage, running 9% through year twelve or fifteen for instance rather than year ten.
You can fade gradually, stepping growth down a point or so a year towards 3% rather than dropping it in one move, which describes the world better and takes more work per company.
Or you keep 3% at year eleven, accept that you are being conservative, and let your margin of safety do correspondingly less work at the other end, since applying both charges the same caution twice.
Nobody ever posts about a compounder they refused to buy
Everything so far pushes one way. Fade harder, respect the base rates, do not flatter your terminal assumptions. That is the conventional counsel and it is largely correct. I’m all for conservatism.
Applied without care, however, it is also a reliable method for missing every great business you will ever encounter.
Consider conservatism when it accumulates. You take 11% rather than the 15% your own work suggested. You fade to 7% in the second stage because the convergence curves say deceleration arrives faster than your inside view would suggest. Terminal growth at 3%, because “nothing outgrows the economy forever.” Then a 50% margin of safety on top.
Every one of those is defensible in isolation and I would sign off on each individually. Stacked, they produce a valuation so far below any plausible price for an ultra-competitively advantaged company that you will never own the business, even though it was maybe priced attractively enough at some point.
This kind of error, an error of omission, often stays invisible. Overpaying leaves a mark. It shows up in your returns, in your portfolio. Underwriting a compounder at half its worth and walking away leaves nothing behind. No entry in the P&L. Nothing to review. Nothing anyone can criticize, and a certain amount of unearned credit for discipline.
The investing world has produced an enormous literature on valuation-agnostic buying and almost nothing on the cost of habitual under-underwriting.
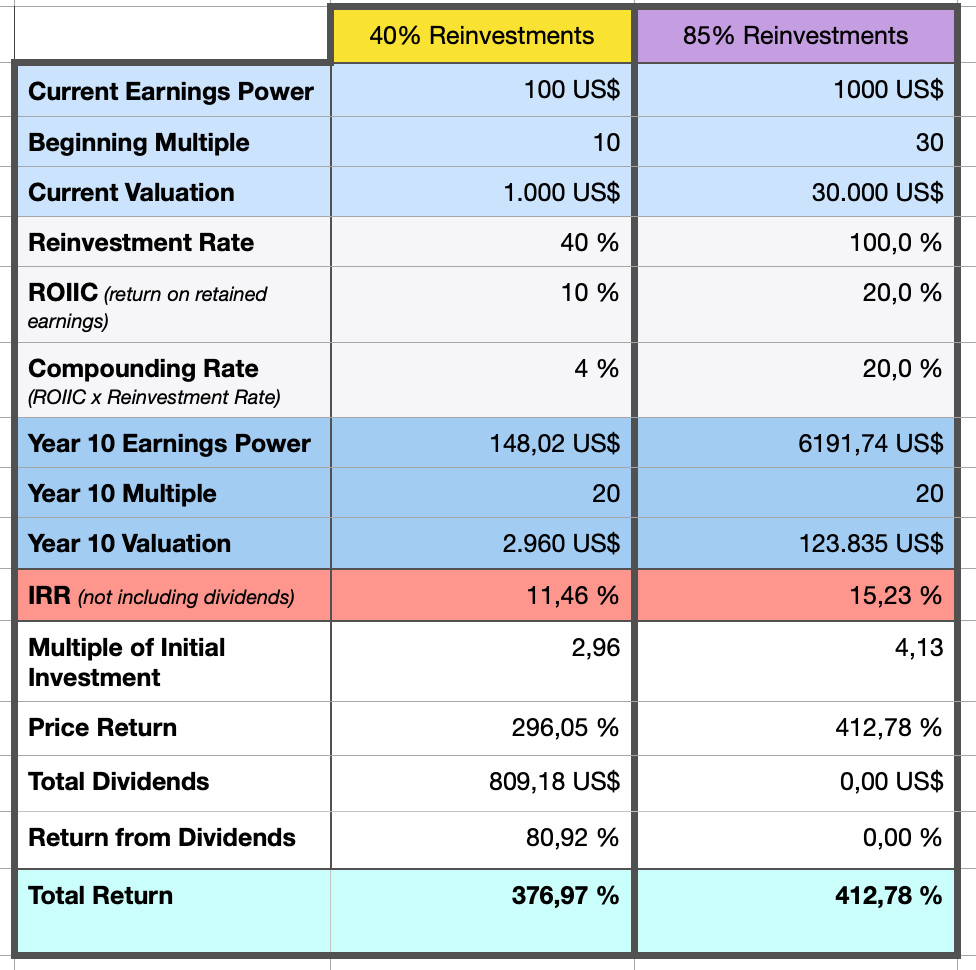
The arithmetic runs in the direction people find counterintuitive. A business earning 25% on incremental capital and reinvesting 60% of its profits grows earnings at 15% a year and funds that internally. Fifteen years turns $1 of earnings into roughly $8. A model built to be safe has the same business decelerating to 7% by year six and 3% by year eleven, arriving at a little over $3.
You have valued a different company.
The entry multiple matters less than it feels like it should for these compounders. Buy that compounder at 35 times, hold fifteen years, and even if the multiple compresses to 20 your annualized return comes to just under 11%.
This is the risk of underappreciating a runway vs. the risk of overpaying.
None of this argues for waving through a high multiple. The point is narrower: conservatism has a cost, too, and treating it as free is itself an analytical error. So I try to be deliberate about where it enters. I keep the forecast as honest as I can make it, neither optimistic nor defensively low, and hold the margin of safety separately as an explicit decision about how uncertain I am, so I can see what it is doing.
So what do I actually do?
I am not offering a superior model here. In fact, I rarely use a DCF these days.
The value of this entire discussion, and the value of attempting your hand at a DCF in the first place, lies in the questions it forces you to tackle rather than the figure it produces.
A DCF handing you a number and nothing else has failed at the only thing it is good for.
The sequence starts outside the company. Before I build anything, I want the reference class and what happened to it, which means finding businesses at a comparable stage in comparable industries and looking at what they delivered over the following decade on revenue, margins and returns on capital. That becomes my anchor, and everything afterwards is an argument for departing from it. The order is not cosmetic. Build the forecast first and the base rate becomes an obstacle you negotiate around, a completely different mental operation to starting from the data and having to justify every point of excess.
Then comes the exercise I find more valuable than anything else in my valuation work at the moment. If you take one practical thing from this piece, take this. Rather than typing a single growth rate into a cell, I decompose the top line into its drivers and assign a contribution range to each.
For a retailer, for instance, that might be new store openings contributing four to seven points, like-for-like growth at one to three, pricing at two to three, and a new category contributing nothing in the bear case and two points if it works. Sum the ranges, and you have a growth band rather than a point estimate, plus a picture of where the growth is supposed to come from.
The assumptions become auditable, and they generate questions I would not otherwise have asked. Assigning a band to new store contribution forces me to ask how many locations remain in the addressable market, what the recent cadence has been, whether new stores cannibalise existing ones, what the payback period looks like. When the company reports I am not checking whether revenue growth was 13%. I am checking whether openings ran at the pace I assumed and whether like-for-like held, which tells me which part of my thinking was wrong rather than merely that something was. By the time I have worked through every driver I understand the business considerably better, and the model is a by-product of that understanding rather than a substitute for it.
Deep Dive: Dino Polska ($DNP.WA)

There was a period, not so long ago, when you couldn’t scroll through Fintwit without tripping over the stock of Dino Polska.
The same treatment applies at the far end, the terminal value, where most of the intrinsic value can be found.
What am I claiming about the competitive advantage period?
What generates the advantage and what is its natural decay rate?
Can the company still deploy meaningful capital at that return, or is it a wide spread with nowhere to put the money?
Are the reinvestment rate and the return I assumed consistent with the growth rate I typed in?
That last check takes thirty seconds and catches an embarrassing number of errors.
Everything gets expressed as a range, and I usually hold at least three scenarios rather than one valuation, so the output stops being a price and becomes a distribution, a range, and the decision becomes a judgment about the scenario distributions and assigned probabilities.
Then I invert the whole thing and ask what the market price already asserts. Solve for the growth rate the market is embedding, given a sensible discount rate and a reasonable view on returns and reinvestment.
A stock at 40 times might be asserting 18% growth for a decade, which the base rates say is a stretch bordering on fantasy. Or it might be asserting 9%, which for a business with a durable advantage is worth taking seriously.
What felt expensive on a multiple often looks different once you see what it requires, in both directions. I find that reframing more useful than any forward model I build, and it deserves its own piece rather than a paragraph here.
Is this as granular as sell-side modelling? Not remotely. Those models run to hundreds of line items, and building one teaches you the business in a way nothing else does. The failure mode is something other than imprecision. It is the man with a hammer, the conviction that four hundred rows make the output knowledge rather than a very elaborate opinion. Precision and accuracy have nothing to do with each other, and a forecast carried to the decimal place in year nine claims a resolution nobody possesses.
What I am describing is less granular and better calibrated to what can be known. Enough structure to catch inconsistencies and force the right questions, not so much that the apparatus starts manufacturing confidence. It is a long way from the alternative, the hasty assumption, which has a formal name. The hasty generalisation fallacy describes drawing a conclusion from a sample too small or unrepresentative to support it. Three years of strong growth extrapolated across a decade. One good quarter treated as a trend. A competitor’s stumble read as a permanent advantage.
I am not accusing you of it. I do it too, generally when I like a business and want the numbers to agree with me.
So where does this leave the DCF? Roughly where it should have been all along. It is a device for thinking, and its highest use is diagnostic. It tells you what you would have to believe. When my model implies a terminal spread putting a company among the two dozen most durable franchises in the world, I have learned something about my own reasoning rather than about the company. When the price embeds growth the base rates say almost nobody achieves, I have learned something about the price.
Neither insight arrives as a number, and both are worth more than the numerical output a DCF provides.
The artificiality never goes away. Growth stages stay arbitrary.
Knowing where your tools distort is what separates using a tool from being used by one.
Disclaimer:
The analysis presented in this blog may be flawed and/or critical information may have been overlooked. The content provided should be considered an educational resource and should not be construed as individualized investment advice, nor as a recommendation to buy or sell specific securities. I may own some of the securities discussed. The stocks, funds, and assets discussed are examples only and may not be appropriate for your individual circumstances. It is the responsibility of the reader to do their own due diligence before investing in any index fund, ETF, asset, or stock mentioned or before making any sell decisions. Also double-check if the comments made are accurate. You should always consult with a financial advisor before purchasing a specific stock and making decisions regarding your portfolio.
DCFs derive the majority of their value from terminal assumptions. Run a standard model and you will often find that well over half the valuation comes from cash flows beyond the explicit forecast period. Sometimes close to eighty percent.
That means the model is not really about the next ten years. It is about everything that comes after, which is precisely the part you cannot forecast with any reliability.
Small changes in assumptions drive large changes in output. Growth moves slightly. Discount rates shift. Valuation swings materially. The model looks rigorous. The sensitivity tells you otherwise.
The discount rate itself is another weak point. Cost of debt is observable. Cost of equity is inferred. It rests on assumptions about risk that are often circular.
Then there’s the elephant in the room that no-one speaks about. Businesses don’t have fixed lives. They adapt, decline, reinvest, or disappear. Treating them like depreciating assets introduces a mismatch between model and reality.
Imagine a company which had the same unit economics a decade from now as it does today. Run a DCF in ten years time and you get a value. That value will look remarkably similar to the value you get if you run the DCF today. How can that be? One of these models has 10 years more cash flows than the other. It’s because the terminal value is a work of fiction.
DCF was invented by economists to value investments in tangible assets within a business, a piece of machinery with a finite life where the variables are all capable of being estimated with a high degree of accuracy (useful life, terminal value at the end of life, output of the machine, value of that output, and a discount rate linked to the corporate cost of capital).
A DCF was never intended to be used to value a corporation. This came later, at an academic level, which is like pushing a square peg into a round hole. In theory it works, in practice it doesn’t. Just like most theories, it should be left in a text book!
Buffet and Munger never used a DCF. That probably tells you all you need to know.
Agreed. Projecting out a growth rate forever is insanity lol