5 Quality Names Ready to Turn?
The Most Mispriced Quality in the World? Five Names I Am Watching Right Now

Identifying a high–quality business is only half the battle in this market. The other half – the part that keeps most investors up at night – is the entry price.
I always spend a considerable amount of time tracking the prices of some of the world’s most dominant businesses that every once in a while trade at valuations that seem completely disconnected from their long–term earning power trajectories.
This post is a collection of my notes on five specific names that have moved to the very top of my watchlist. For those new here: I’m not interested in chasing temporary bounces or playing for a quick relief rally. Instead, I want to explore why the “competitive advantage period” (CAP) for these firms is likely much longer than a standard discounted cash flow model would ever suggest. If you follow the logic of the recent Mauboussin research on this concept, you know that the true value of an enterprise lies in the “how long” part of the equation – how long a company can maintain its return on capital before the inevitable regression to the mean.
Arguably, the current opportunity set is much broader than many macro and market commentators make it seem. It isn’t often that you get a chance to buy into fortress–like moats when the sentiment is this sour. Whether it is a luxury icon caught in a currency storm, a real estate gateway navigating a cyclical slump, or a mission–critical software provider being repriced as a commodity,
For the five names I’m presenting today, the aforementioned CAP period appears to be significantly underestimated by the current share prices. Hence, I believe the recent drawdowns might be offering a rare window for patient, long–duration capital and deserve your attention too.
Disclaimer: The analysis presented in this blog may be flawed and/or critical information may have been overlooked. The content provided should be considered an educational resource and should not be construed as individualized investment advice, nor as a recommendation to buy or sell specific securities. I may own some of the securities discussed. The stocks, funds, and assets discussed are examples only and may not be appropriate for your individual circumstances. It is the responsibility of the reader to do their own due diligence before investing in any index fund, ETF, asset, or stock mentioned or before making any sell decisions. Also double-check if the comments made are accurate. You should always consult with a financial advisor before purchasing a specific stock and making decisions regarding your portfolio.

#1 – Boston Omaha ($BOC)
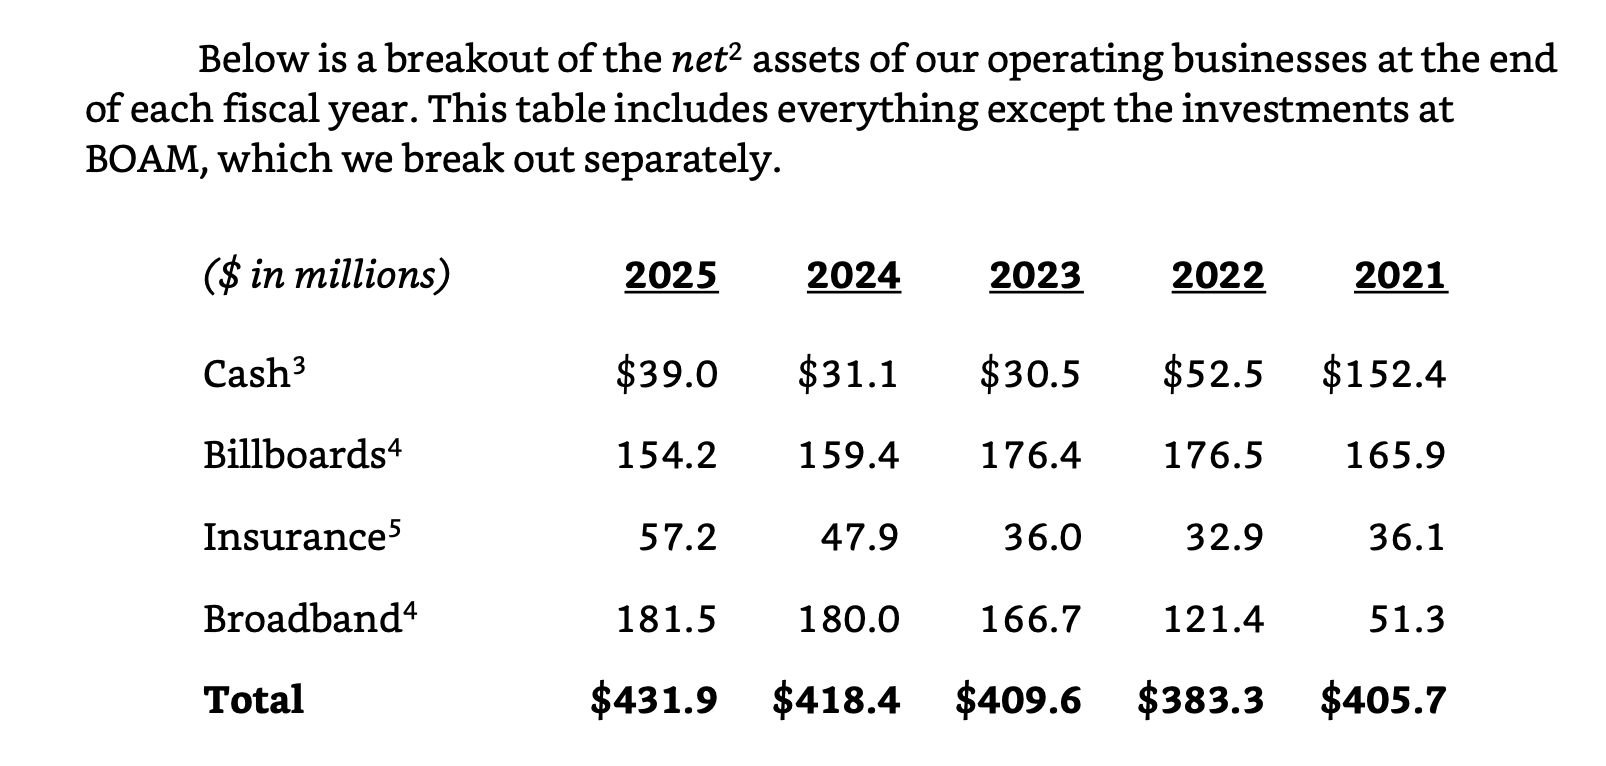
Boston Omaha is a multi-segment holding company and capital allocator that functions like a heavy-duty train powered by three distinct locomotives: outdoor advertising, high-speed broadband, and surety insurance. Founded in 2015 through the recapitalization of a small real estate shell, the company has stayed remarkably disciplined. Its primary mission is simple. It aims to grow intrinsic value per share by deploying capital into asset-heavy businesses that generate durable, predictable cash flows. Think of it as a vehicle designed to compound wealth slowly but surely through essential infrastructure.
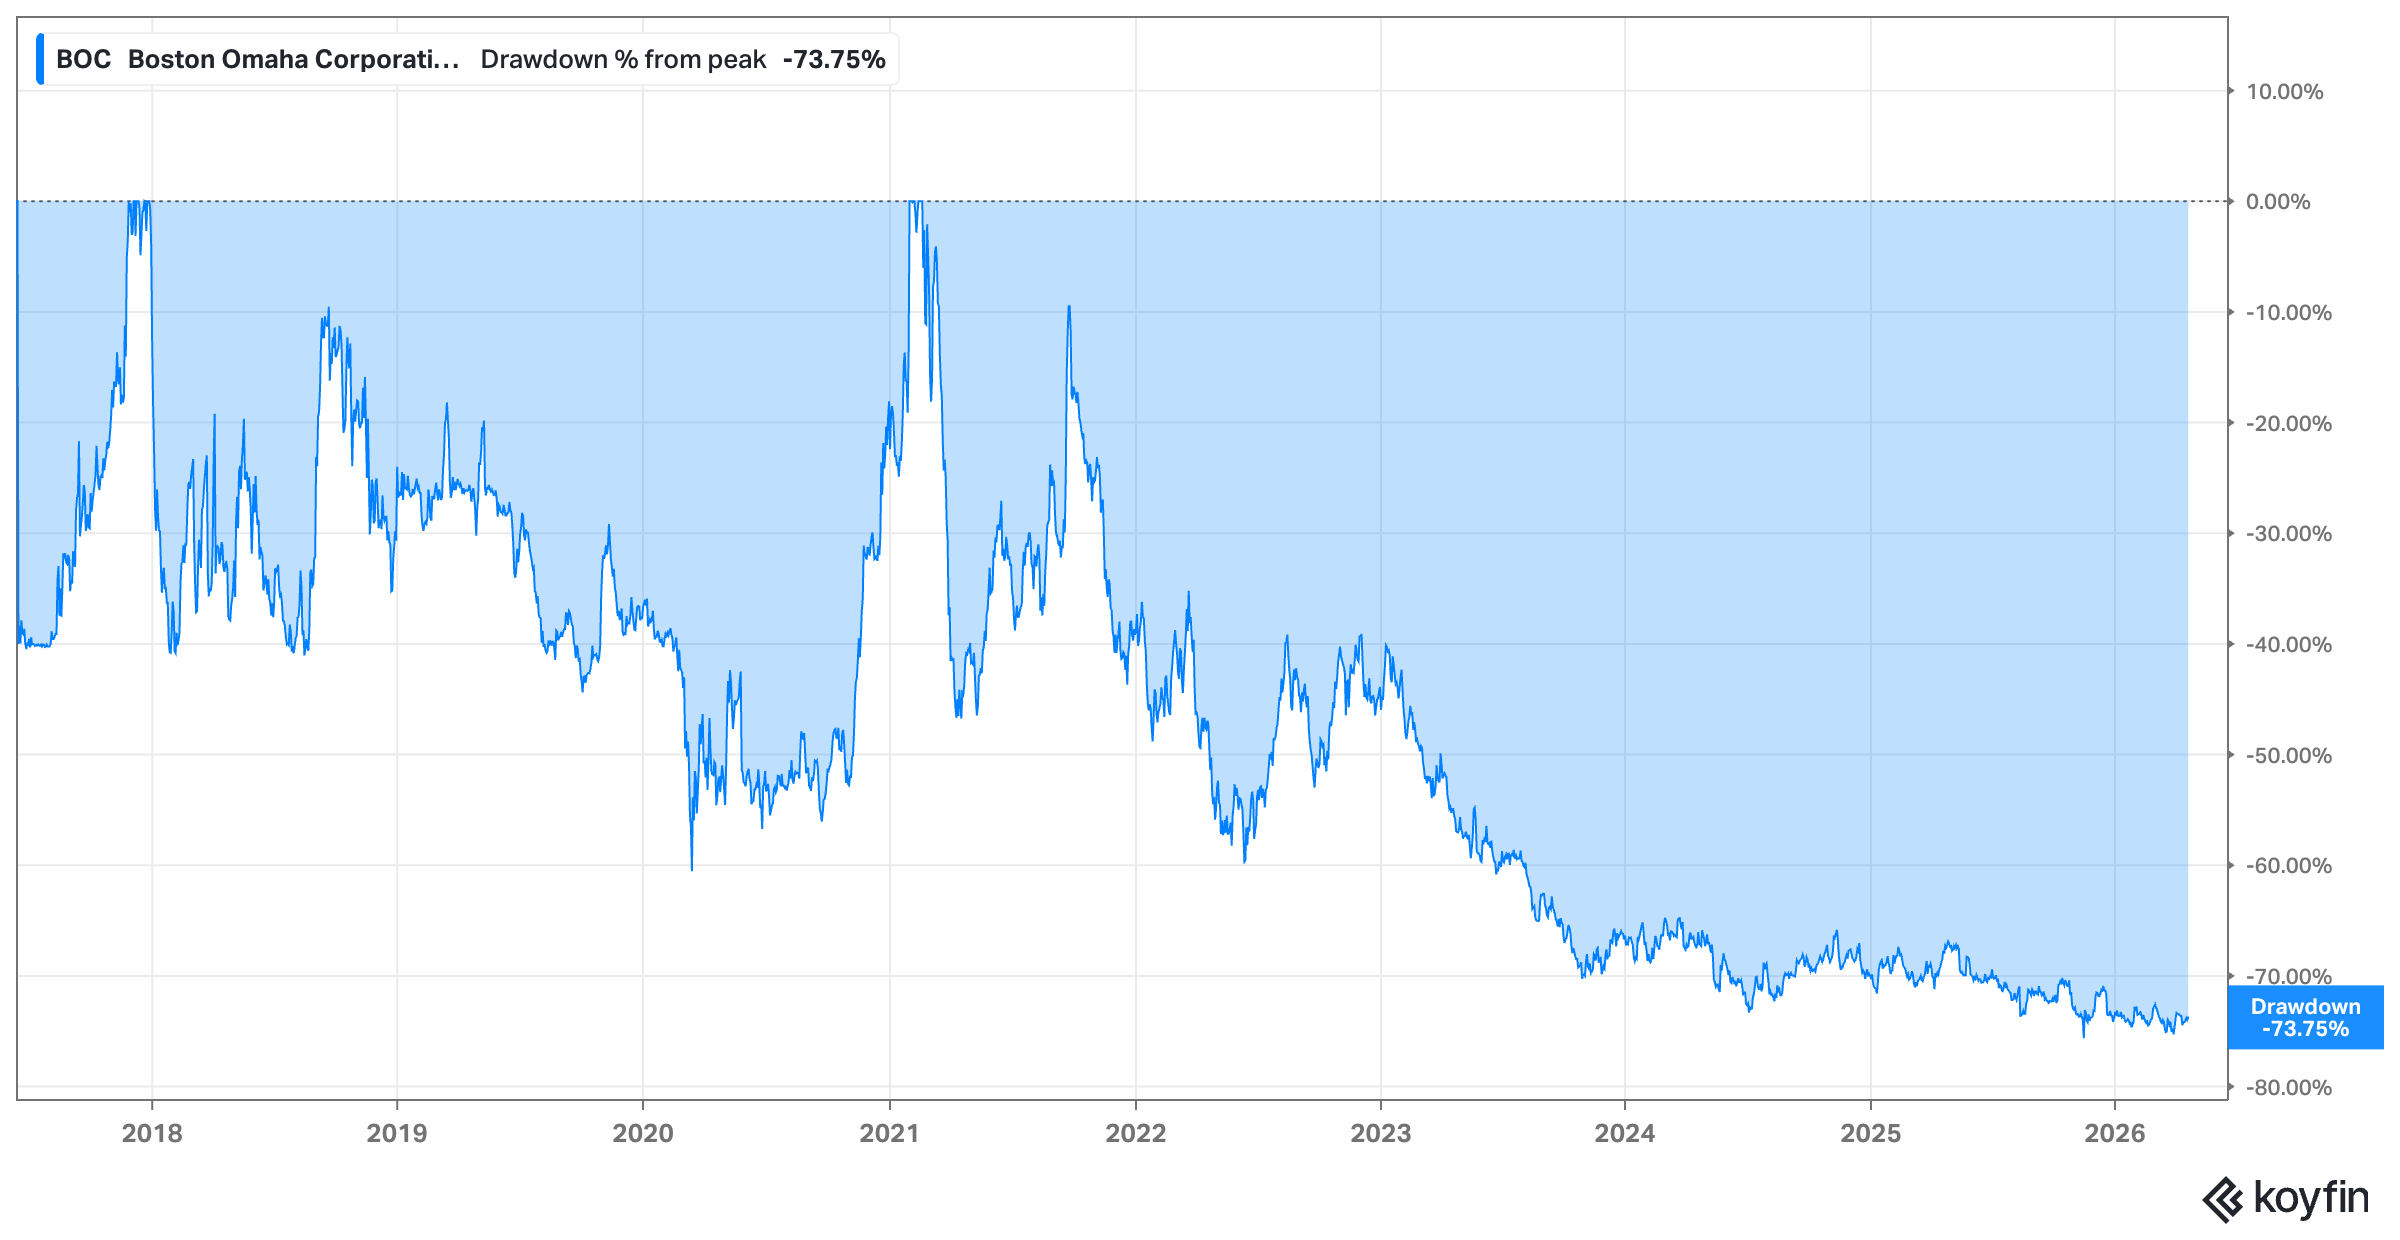
The competitive moats here are deeper than the current market price suggests. In the billboard segment, the moat is largely regulatory; getting permits for new signs is notoriously difficult, making existing faces valuable local monopolies. Meanwhile, the broadband division focuses on fiber–to–the–home in underserved markets, creating a “first–in” advantage that is incredibly hard for competitors to displace economically. Despite these defensive qualities, the stock has been hit hard. It currently sits roughly 70% below its all-time highs reached in 2021. For a business focused on long-term compounding, this level of detachment from previous valuations is striking.
Recent developments suggest management is leaning into this disconnect. I’m particularly focused on the $30 million share repurchase program adopted late last year–a significant move for a company that historically preferred using its cash for new acquisitions.
“Our approach will be opportunistic and disciplined: we will only buy back shares when we believe they trade significantly below our conservative estimate of intrinsic value, and when doing so makes more economic sense than deploying capital into our existing businesses or potential acquisitions. Repurchases are also dependent on our excess cash availability at any given time. Shareholders should expect any repurchases to be lumpy in their timing because of the above factors, but also subject to volume and other restrictions on such a program imposed under federal securities laws and our limitations on repurchasing shares during blackout periods.“ - 2024 letter
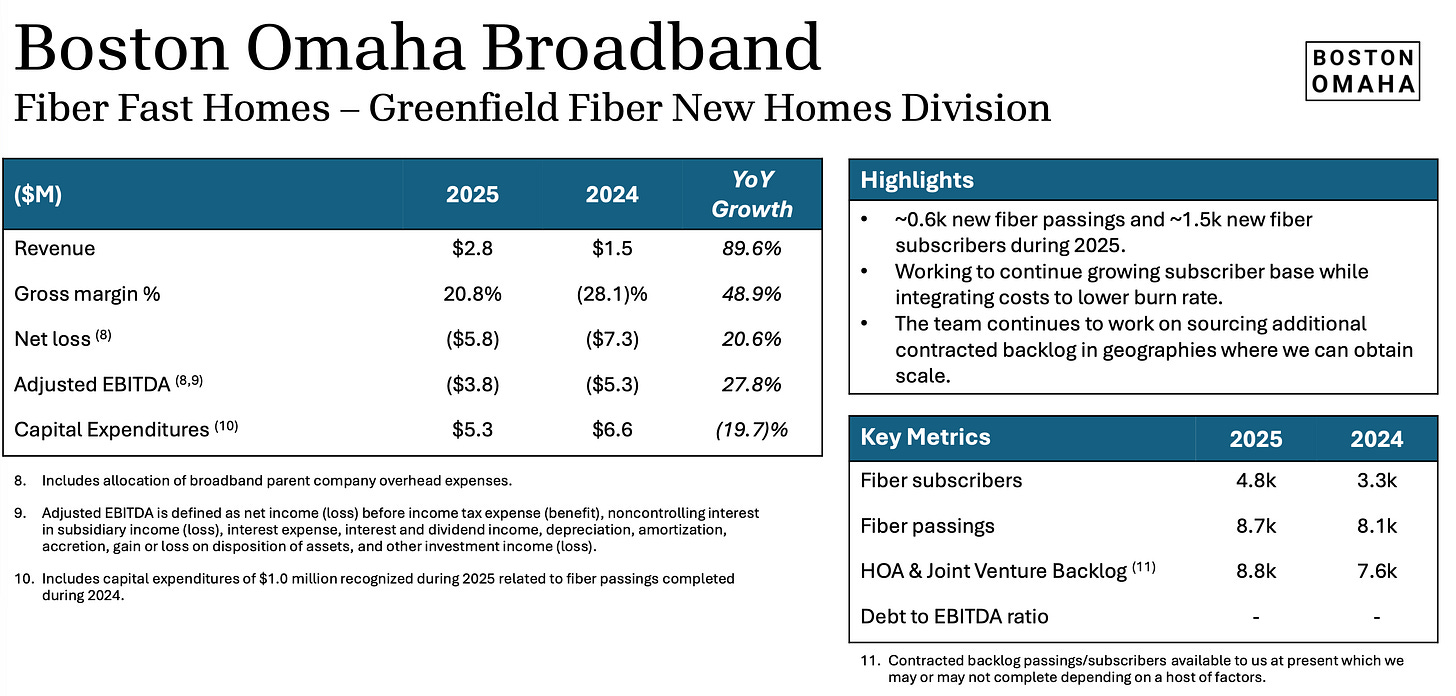
On the operational side, the broadband segment recently secured approximately $37 million in federal ReConnect and BEAD awards. This non-dilutive capital will significantly accelerate fiber deployment in rural areas. They are also maturing in their asset management arm, showing that the “locomotives” are still gaining steam even if the share price hasn’t followed suit.
What’s dragging the price down?
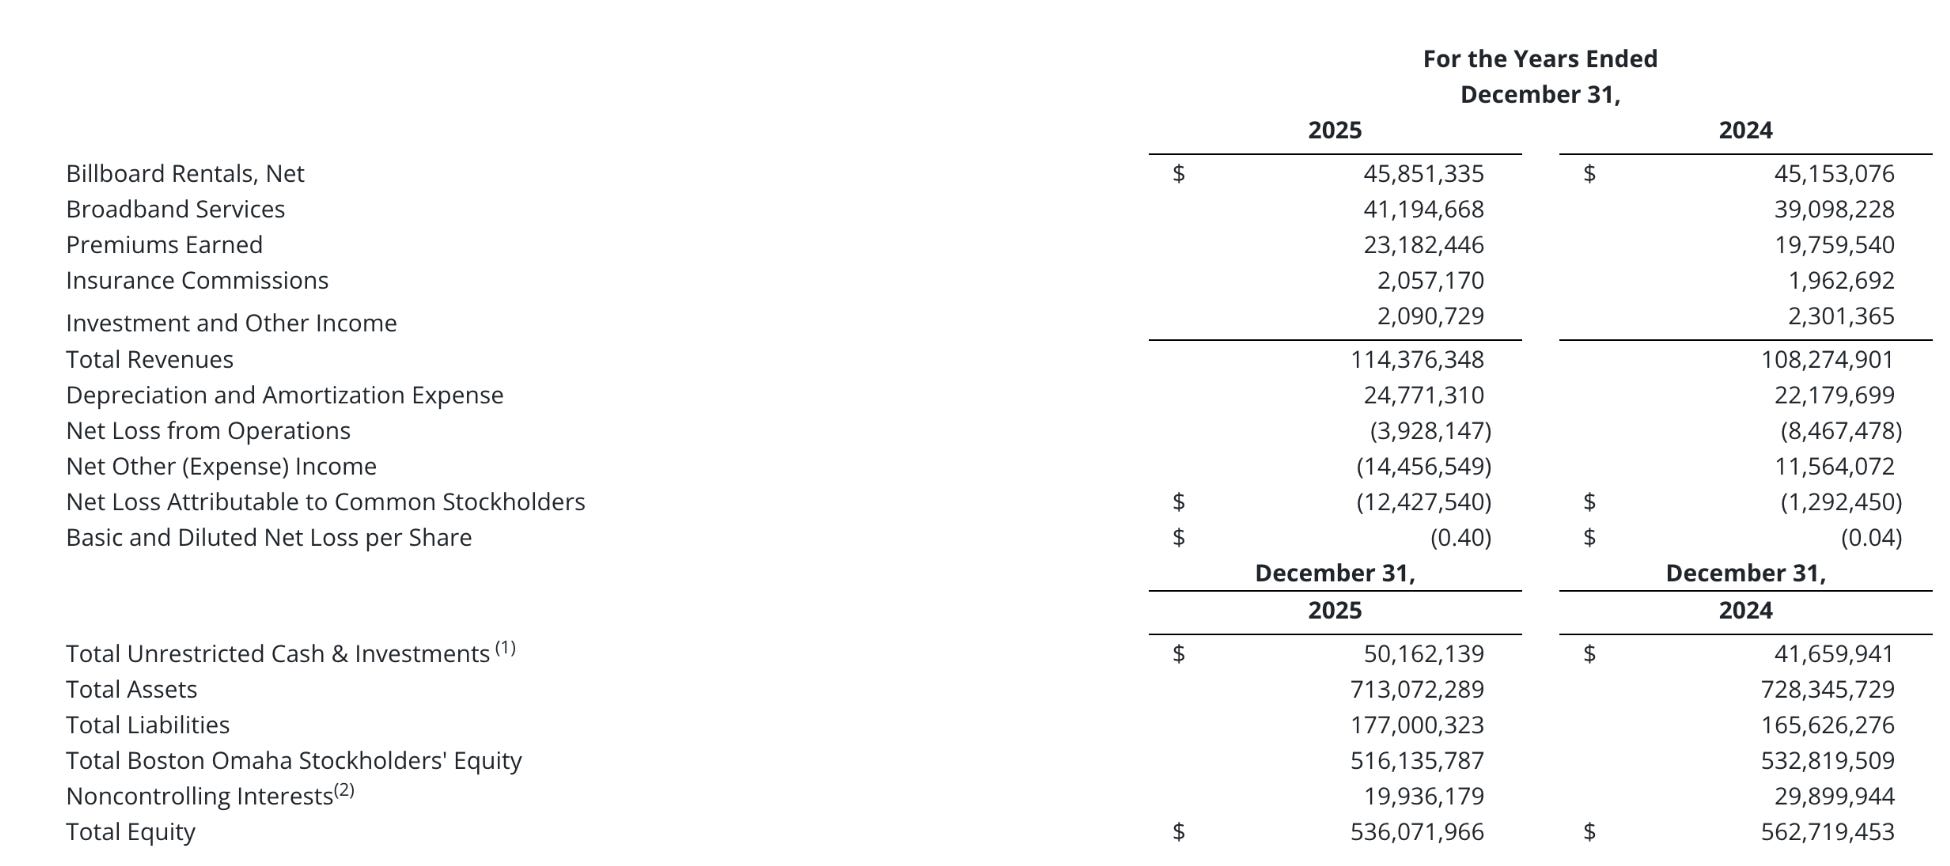
It is no secret that the market’s relationship with Boston Omaha has soured. If I had to pin down why the stock has struggled to find a floor, I would point to a combination of persistent earnings misses and a sudden lack of operational “cleanliness.” The most recent Q4 2025 results were a punch to the gut for some bulls. While revenue actually beat expectations at $29.71 million, the bottom line was a different story. The company reported a GAAP EPS loss of –$0.22, which was significantly wider than the analyst consensus of –$0.03. This wasn’t a one–off event either; it followed a string of misses throughout 2025, leaving investors wondering when the “locomotives” will actually start contributing to net income instead of just soaking up capital.
Beyond the raw numbers, there are three specific structural pressures weighing on the share price:
The Surety Slip–up: The General Indemnity Group (GIG) faced unexpected “larger losses” totaling roughly $6.7 million in 2025. For a segment that is supposed to be a steady provider of float and cash, these losses suggest that scaling the business has introduced a level of complexity that management is still learning to navigate.
The Cost of Growth: While the broadband division is growing, it remains a massive cash sink. The $25.9 million invested into fiber passings last year is a long–term bet, but in a “higher–for–longer” interest rate environment, the market has lost its appetite for businesses that prioritize future infrastructure over immediate free cash flow.
The “Value Trap” Narrative: There is a growing fear that without a clear catalyst or a pivot toward consistent profitability, the stock is becoming a classic value trap. Despite trading at a significant discount to its book value, the lack of near–term guidance or a concrete timeline for GAAP profitability has led many institutional players to move to the sidelines.
The recent sell–off reflects a market that has run out of patience for “potential.” Investors are no longer willing to give management a blank check for capital allocation if it results in widening losses. This skepticism is now baked into the price, creating a scenario where the stock essentially needs to prove its model all over again to regain its former premium.
High-Level BAM-BAM-BAM Hypothesis
Boston Omaha currently sits in that awkward spot the market almost always mishandles. It is a multi–segment holding company with lumpy results and operating businesses that are functionally impossible to value by staring at a single quarterly print. You should care because the market is currently fixated on what it can see today – near–term noise and accounting complexity – while completely underweighting the quietly compounding, asset–heavy platforms maturing in the background. The compelling angle here is the massive gap between the current share price and the embedded, long–duration earning power of its core “locomotives.”
My thesis rests on three specific pillars that I believe the market is missing. First, the business is built on physical infrastructure – billboards and fiber broadband – with unit economics that improve exponentially as utilization rises. Second, there is a massive “complexity discount” at play; the mix of subsidiaries and equity investments makes reported GAAP earnings look far noisier than the actual value being created. Finally, we are witnessing a fundamental segment inflection. The company is shifting from a capital–intensive “build mode” into a “harvest mode,” where incremental revenue carries much higher margins as these platforms reach scale. It is a classic transition from spending money to making it.
The bull case is anchored by Link Media, which has become the sixth–largest owner of billboard faces in the U.S. This is a high–margin, non–consumable business protected by regulatory barriers; once a structure is up, maintenance costs are negligible – roughly $1 million annually for the entire base – letting revenue drop straight to the bottom line. This is mirrored in the broadband segment’s “protected build” model. By focusing on Bulk HOA deals and government–funded projects, they create local utility monopolies with 10–year agreements and 100% take rates. When you add in the niche surety insurance business and management’s aggressive $30 million share repurchase program, you see a team focused on intrinsic value per share rather than cosmetic optics.
Solving for the intrinsic value reveals a potential opportunity that traditional P/E ratios hide. If you subtract the value of the Sky Harbour stake and other minority investments from the total market cap, you are effectively paying roughly $280-300 million for the core operating businesses. Against a normalized steady–state free cash flow of approximately $25 million (my bullish estimate), this implies a forward multiple of just 10-12x, or an 8-10% yield. As the broadband network matures and digital billboard conversions continue through 2026 and 2027, I expect this multiple to compress toward 10x or lower. For a business with utility–like durability and a history of mid–20% revenue–per–share growth, that is a low price to pay.
You can find my detailed analysis of BOC, which I released earlier this year, here:
Deep Dive: Boston Omaha Corp. ($BOC)

In 2025, I mostly found myself hunting for ideas outside the US. Europe. The UK specifically. Asia. Smaller markets where prices are still way more attractive relative to US peers. Moreover, somewhat paradoxically, currencies seemed less fragile, and valuations are often less distorted by narrative-driven capital flows. The US, by contrast, felt crowded, noisy, and increasingly difficult to underwrite with conviction.
#2 – Hermès ($RMS)
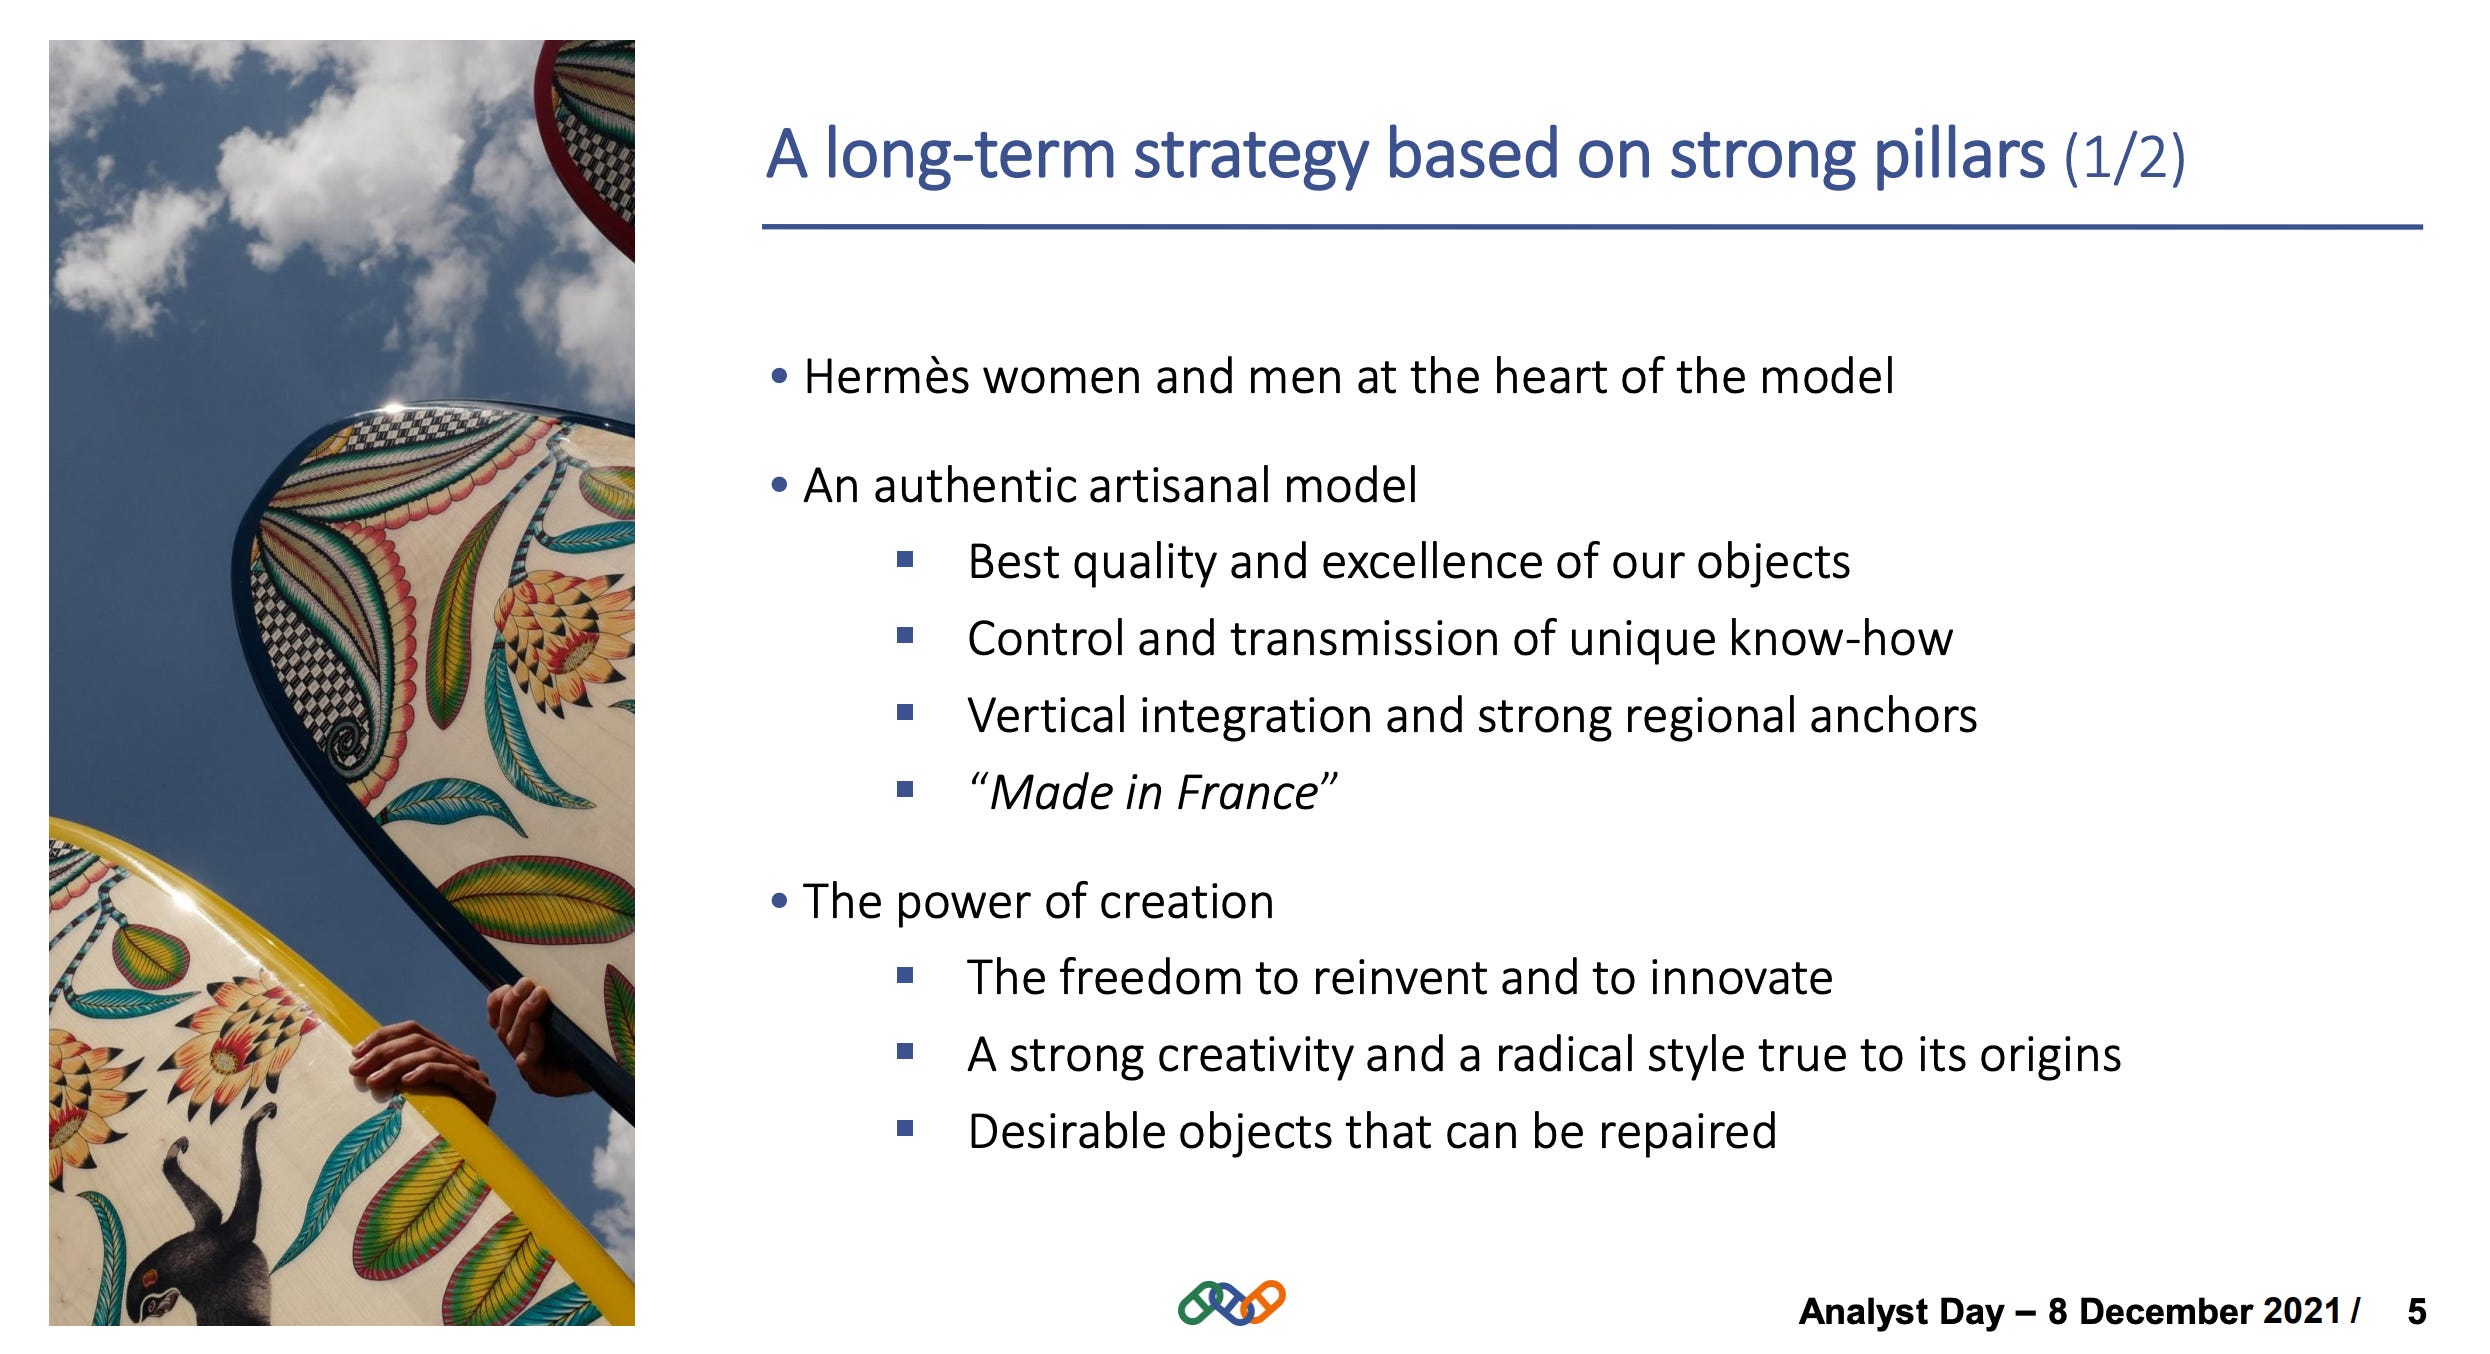
Hermès is a fortress of artisanal excellence. I view it as the gold standard of vertical integration and scarcity–driven demand. The business model revolves around the uncompromising quality of its leather goods – most notably the legendary Birkin and Kelly bags – which are produced in limited quantities by highly trained craftsmen. The Hermès business model and investment hypothesis does not encompass mass production or trend chasing like some of its fashion “peers”, but instead, Hermès maintains its competitive moat by managing supply so tightly that the waiting list itself becomes a product feature. By controlling almost every step of its production chain and avoiding the trap of discounting, the house has built a level of pricing power that few other companies on Earth can match.
However, it is vital to understand that Hermès does not possess the same type of moat as a traditional industrial giant. While they have intangible assets of an even higher degree–specifically brand power and prestige–they do not rely on massive economies of scale to create cost advantages. They do deliberate scarcity instead. In the luxury goods sector, success operates on this principle of exclusivity.
Beyond just keeping products hard to access, there is a literal scarcity of resources at play. There are simply not that many artisan hands capable of working on these specialized products, and it takes nearly a lifetime to train them to the required standard. A competitor cannot simply scale operations to match this, especially when many of the world’s top–quality leather tanneries are already owned by Hermès, LVMH et. al., creating a physical barrier to entry for any upstart.
In recent years, we have seen a clear divergence among the “Big Four” players: LVMH, Hermès, Richemont, and Chanel. While the sector as a whole is cooling, Hermès has continued to gain market share alongside names like Richemont, Brunello Cucinelli, and Prada. Conversely, Kering has lost significant ground, and Burberry has struggled to maintain its footing. Even LVMH has seen a slight erosion of its dominant share as consumers pivot toward “quiet luxury.”
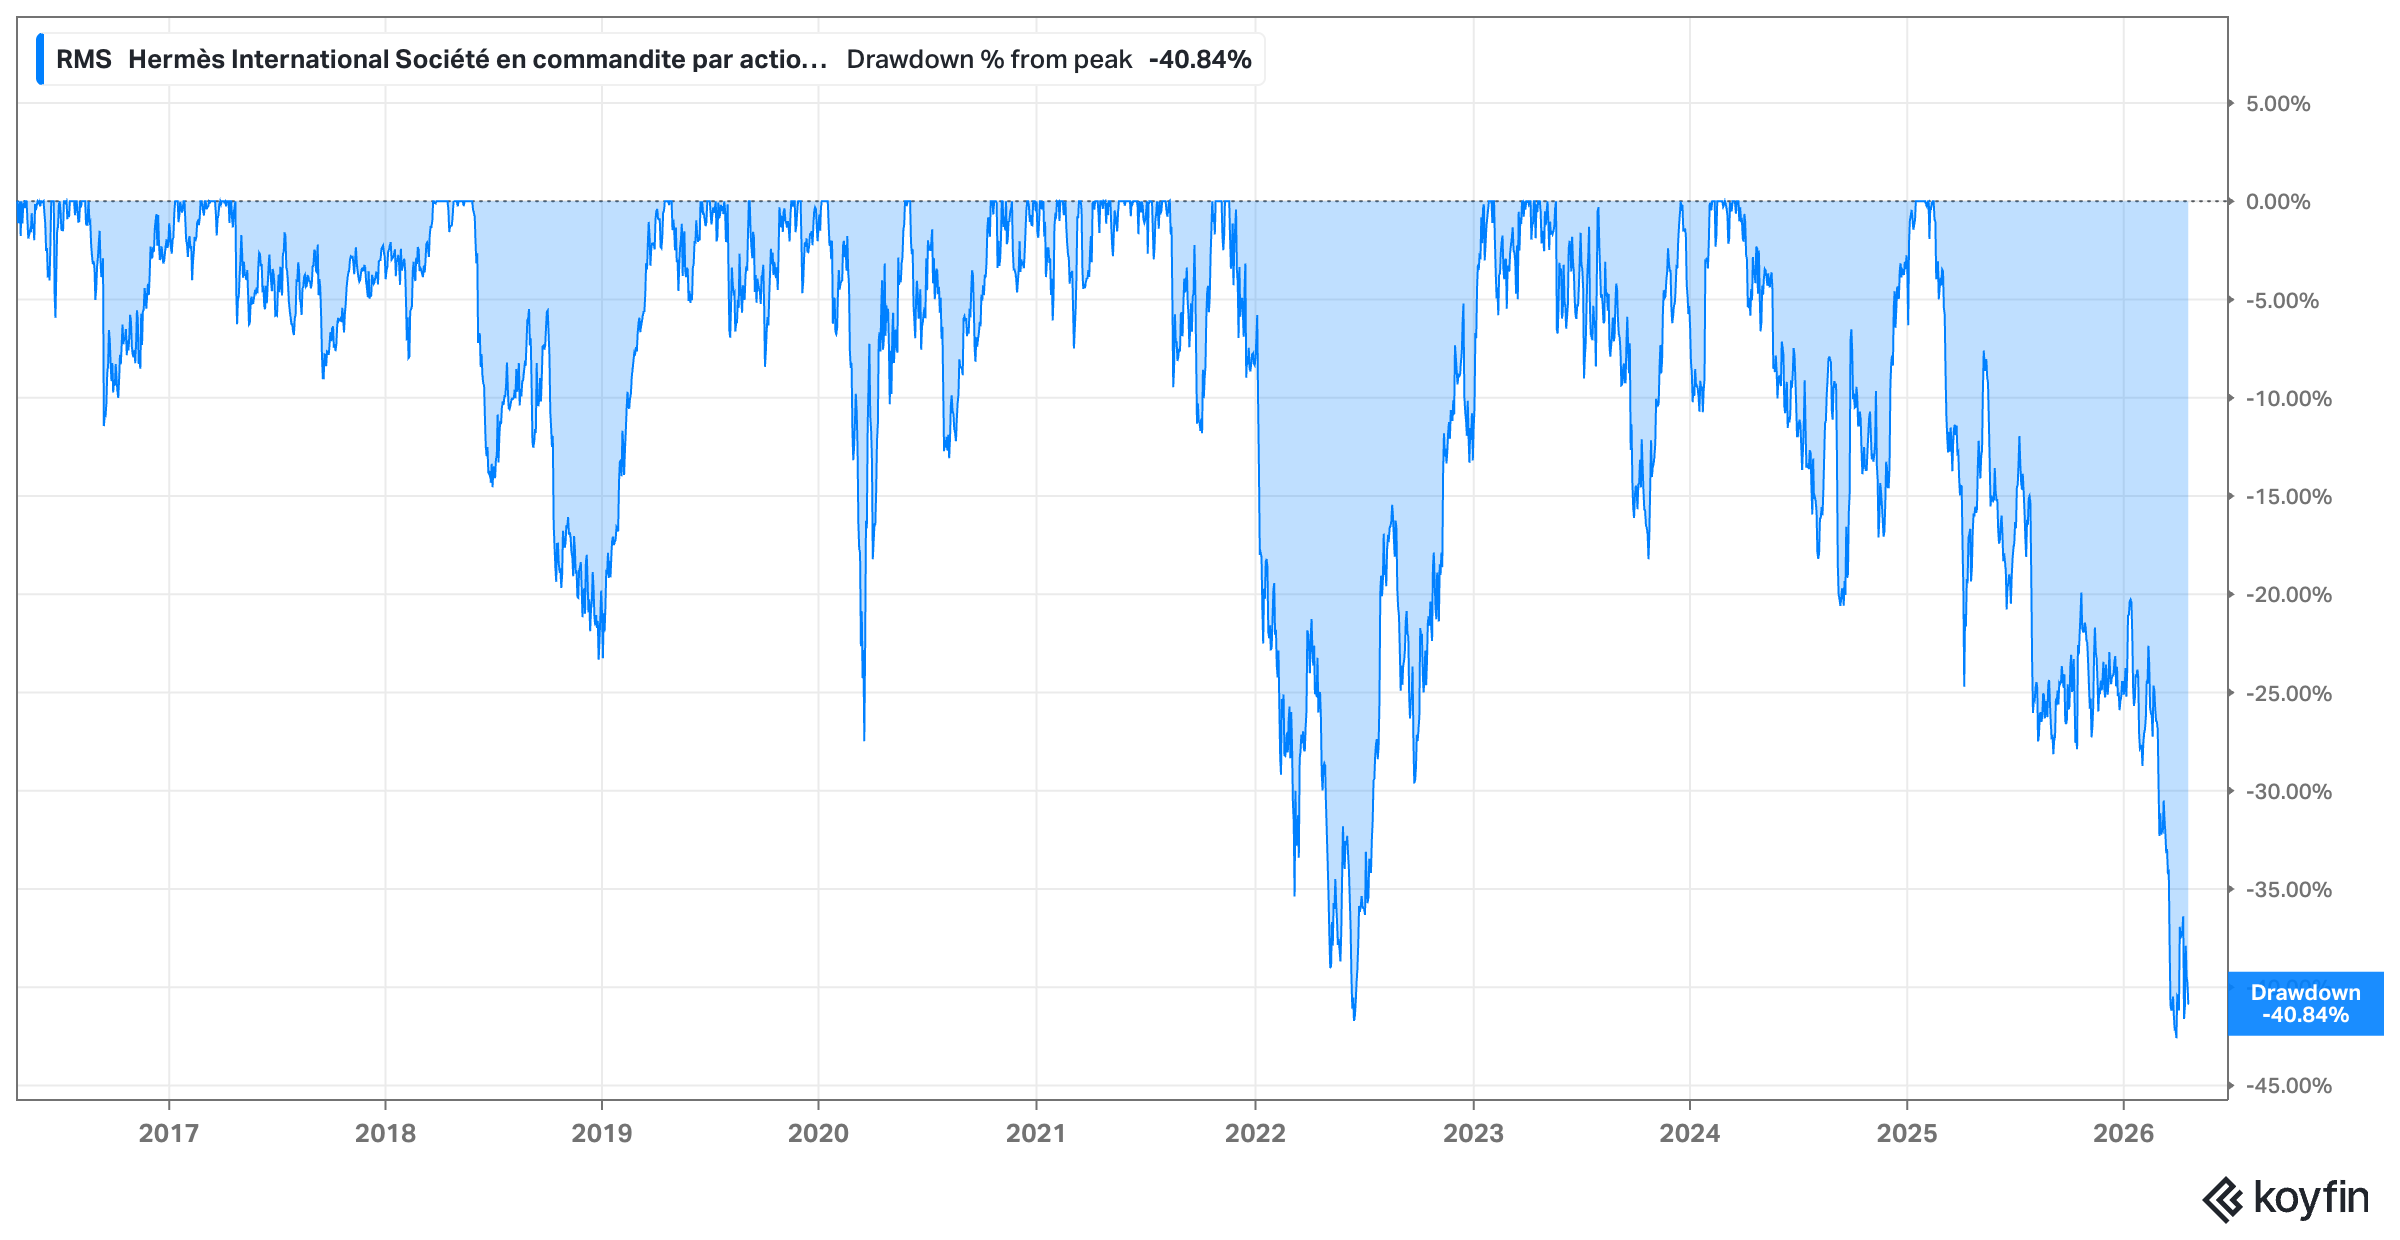
Despite this relative strength, the stock has not been immune to the broader market malaise. Hermès is currently trading roughly 40% below its recent all-time-high (the biggest drawdown since the GFC), caught in a wave of sector–wide headwinds that as of the recent quarter, even the great Hermès is not immune to.
What’s dragging the price down?
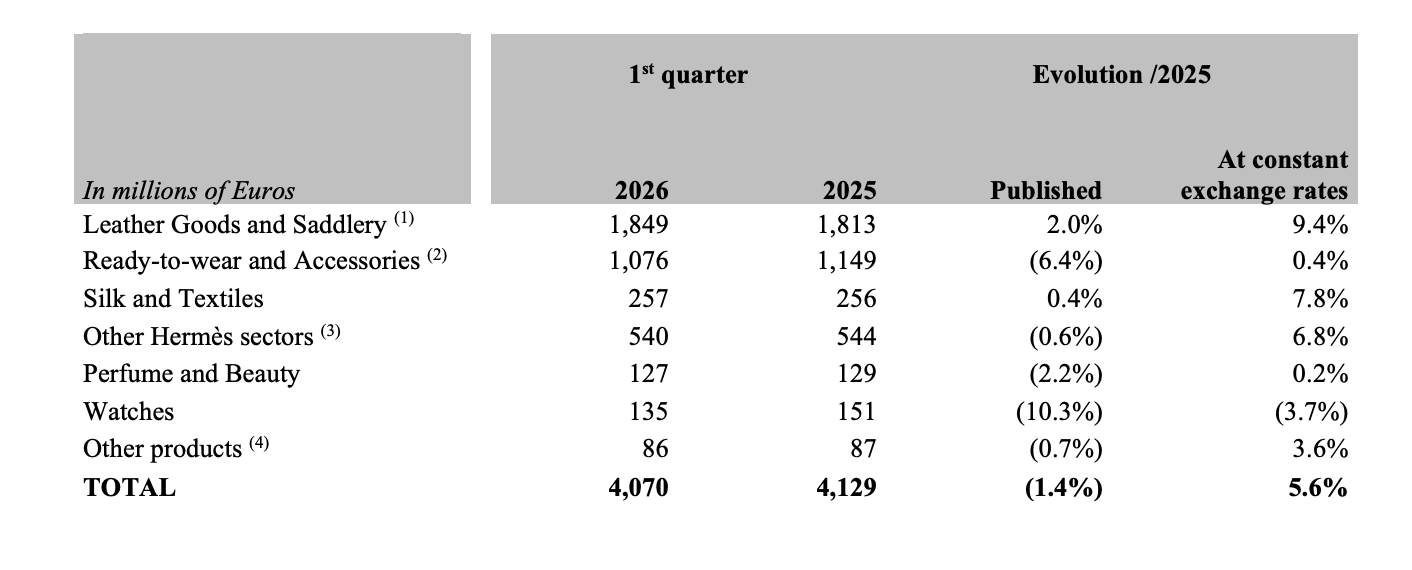
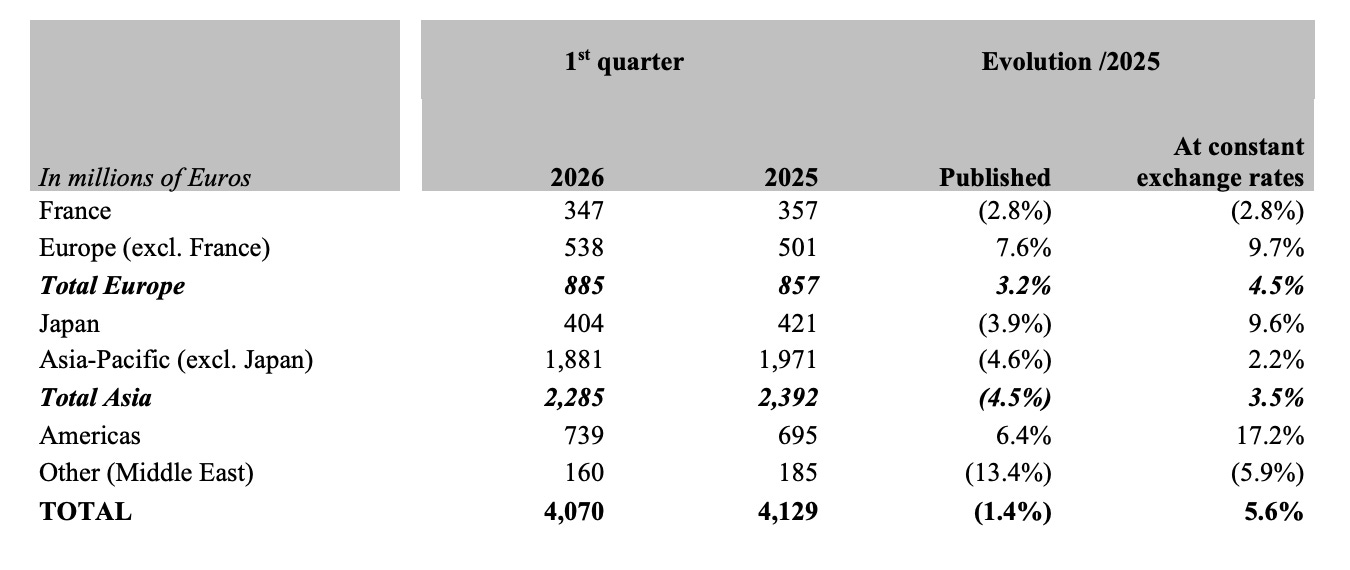
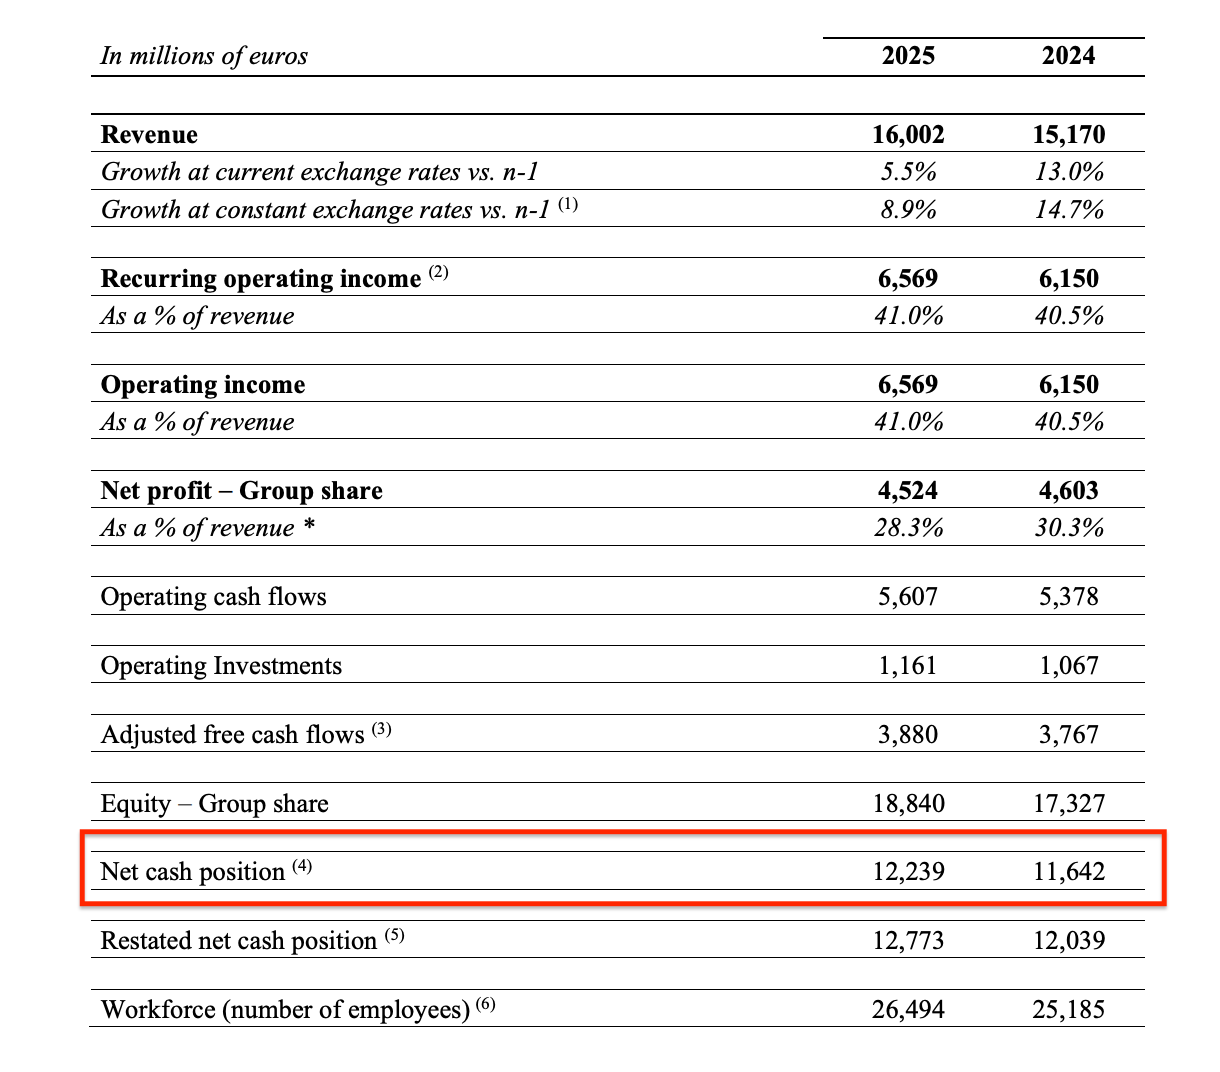
While the brand remains peerless, the stock’s recent performance has hit a significant roadblock, primarily driven by a “optics versus reality” disconnect in the latest financial reports. In the Q1 2026 update, Hermès reported consolidated revenue of €4.1 billion, which represented a 5.6% increase at constant exchange rates. However, the market focused heavily on the published figures, which showed a 1.4% decline in revenue.
This published revenue contraction is a rare sight for a company that usually trades at a significant growth premium, and it suggests that even the most resilient luxury players are not immune to the volatility of global foreign exchange markets.
Beyond the currency pain, a few specific pressure points have emerged that are weighing on investor sentiment and the fundamentals:
Geopolitical and Tourist Headwinds: Sales in France fell by 3% as slowing tourist flows, particularly in March, were linked to the ongoing tensions in the Middle East. This regional instability also bled directly into the “Other” geographical area, which saw a 13.4% published revenue decline as wholesale activity to concession stores in Middle Eastern airports was significantly affected.

Specific Category Softness: While Leather Goods remained robust with 9.4% constant growth, the Watches métier struggled significantly, posting a 10.3% decline in published revenue and a 3.7% drop at constant exchange rates. This indicates that the “aspirational” or “entry–level” luxury buyer – often the first to pull back in an uncertain economy – is becoming more cautious.
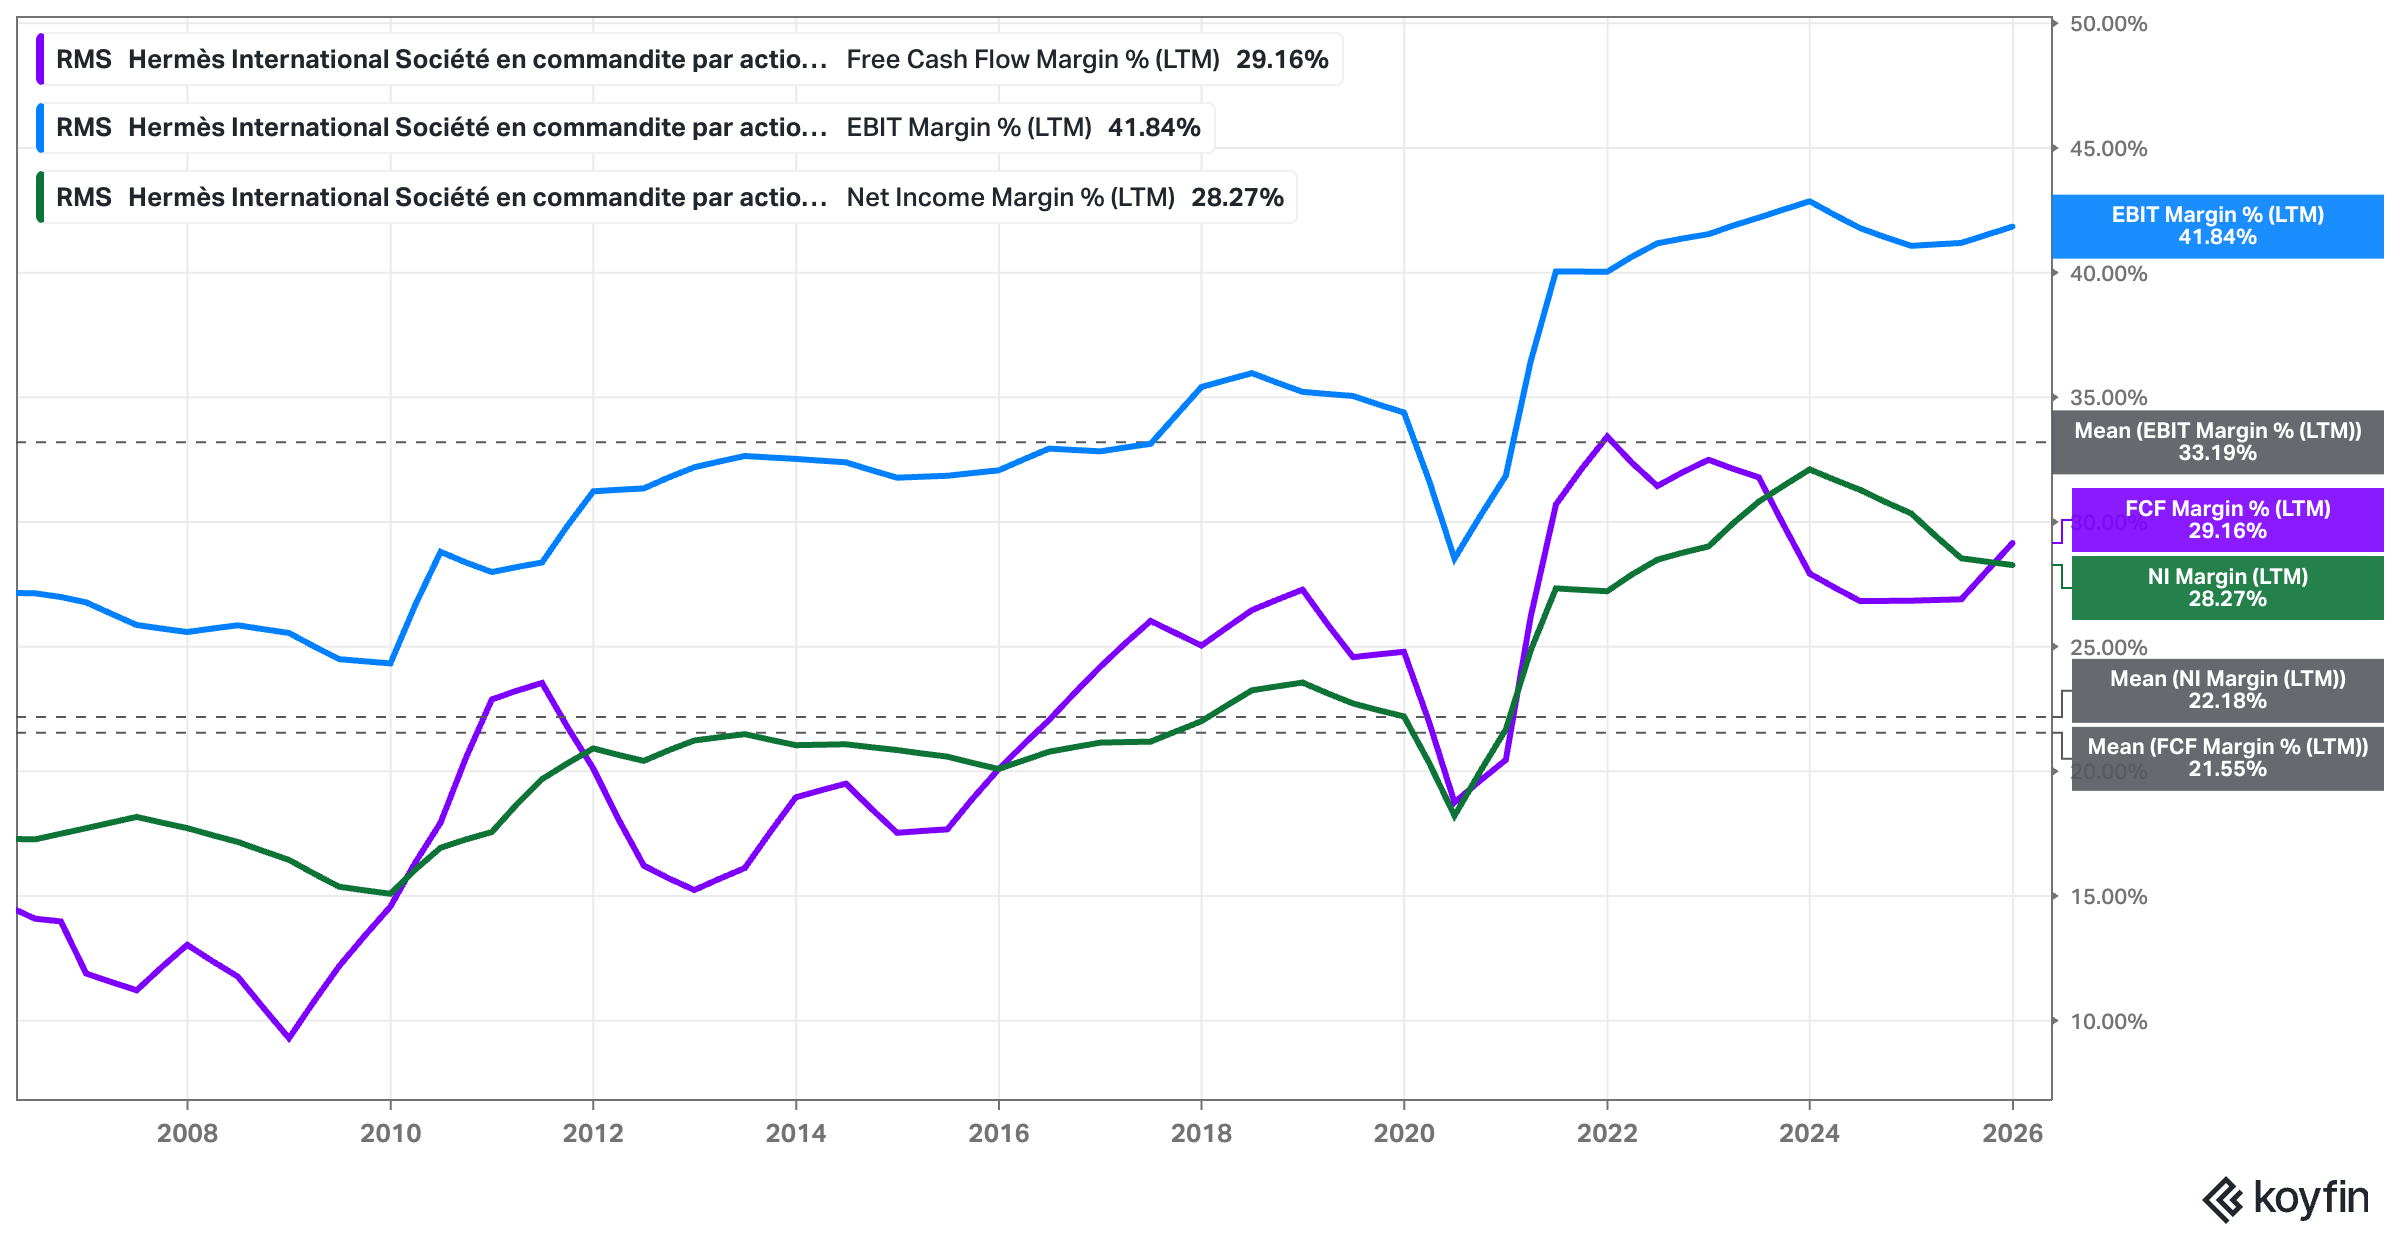
Market Share and Margin Fears: Although the group maintains a recurring operating margin of 41% , the lack of an EPS beat in the most recent updates and the slight growth deceleration in Asia–Pacific excluding Japan (+2.2% constant) have raised questions. In a market where LVMH and others are also seeing a normalization of growth, investors are penalizing any sign that the post–pandemic luxury “super–cycle” has truly reached its plateau.
I believe the recent sell–off was likely triggered by this cocktail of changing investor sentiment, slowing growth, currency headwinds, and macro-related regional instability. Investors who were used to double–digit top–line growth were clearly rattled by the –1.4% published revenue figure, which likely fell short of consensus expectations for a “stable” published performance.
Furthermore, while management remains confident in its “ambitious goal for revenue growth” (management’s outlook), the formal outlook for 2026 remains couched in language about a “still uncertain economic and geopolitical context.” This lack of specific, upgraded guidance for the back half of the year has allowed the “too richly priced given the slowing growth” narrative to creep in, as the stock’s multiple remains high relative to the broader luxury sector even as growth rates normalize toward mid–single digits
High-Level BAM-BAM-BAM Hypothesis
When I think about how to pitch a stock, I often return to Bill Miller’s philosophy: you need a “Bam–Bam–Bam” thesis – a quick, undeniable sequence of reasons why a business is fundamentally mispriced.
In this spirit, the investment hypothesis goes like this: Hermès is currently the victim of a classic market overreaction to macro noise and short-term challenges (a “problem” that is solvable over the short to medium term). You should care because the market is fixated on a headline –1.4% published revenue decline in Q1 2026 while completely ignoring the long-term pricing power of the brands as well as shorter-term currency headwinds that will eventually lap. The thesis is that the market is missing a “perfect storm” of temporary factors – currency, geopolitical tension, and a specific French tax hike – that are masking the strongest pricing power in the luxury world.
I’ve identified three key pillars that might make this a compelling entry point. First, there is the “Artisan Monopoly” – the physical limit on how many Birkins can exist because it takes a lifetime to train the hands that make them. Second, the resilience of the ultra–high–net–worth client base is being underestimated; while “aspirational” luxury is dying, Hermès’ local client loyalty in places like Japan (+10% growth) and the Americas (+17% growth) remains exceptional. Finally, there is the “Fiscal Normalization” play. LVMH and Hermès might currently be navigating a temporary tax headwind in France, where the corporate rate for giants earning over €1 billion jumped from 28% to 33%. This five–percentage–point drag is a matter of fiscal policy, not brand health, and it might serve as a mechanical catalyst for earnings growth as these measures start diminishing in 2026 and potentially disappear by 2027.
The bull case is further strengthened by a clear path to capacity expansion. The house just inaugurated its twenty–fifth leather goods workshop in Loupes, with three more major facilities planned through 2030. This is a high–margin secondary driver because incremental production of high–demand leather goods (+9% growth) carries significantly higher margins than entry–level métiers like watches.
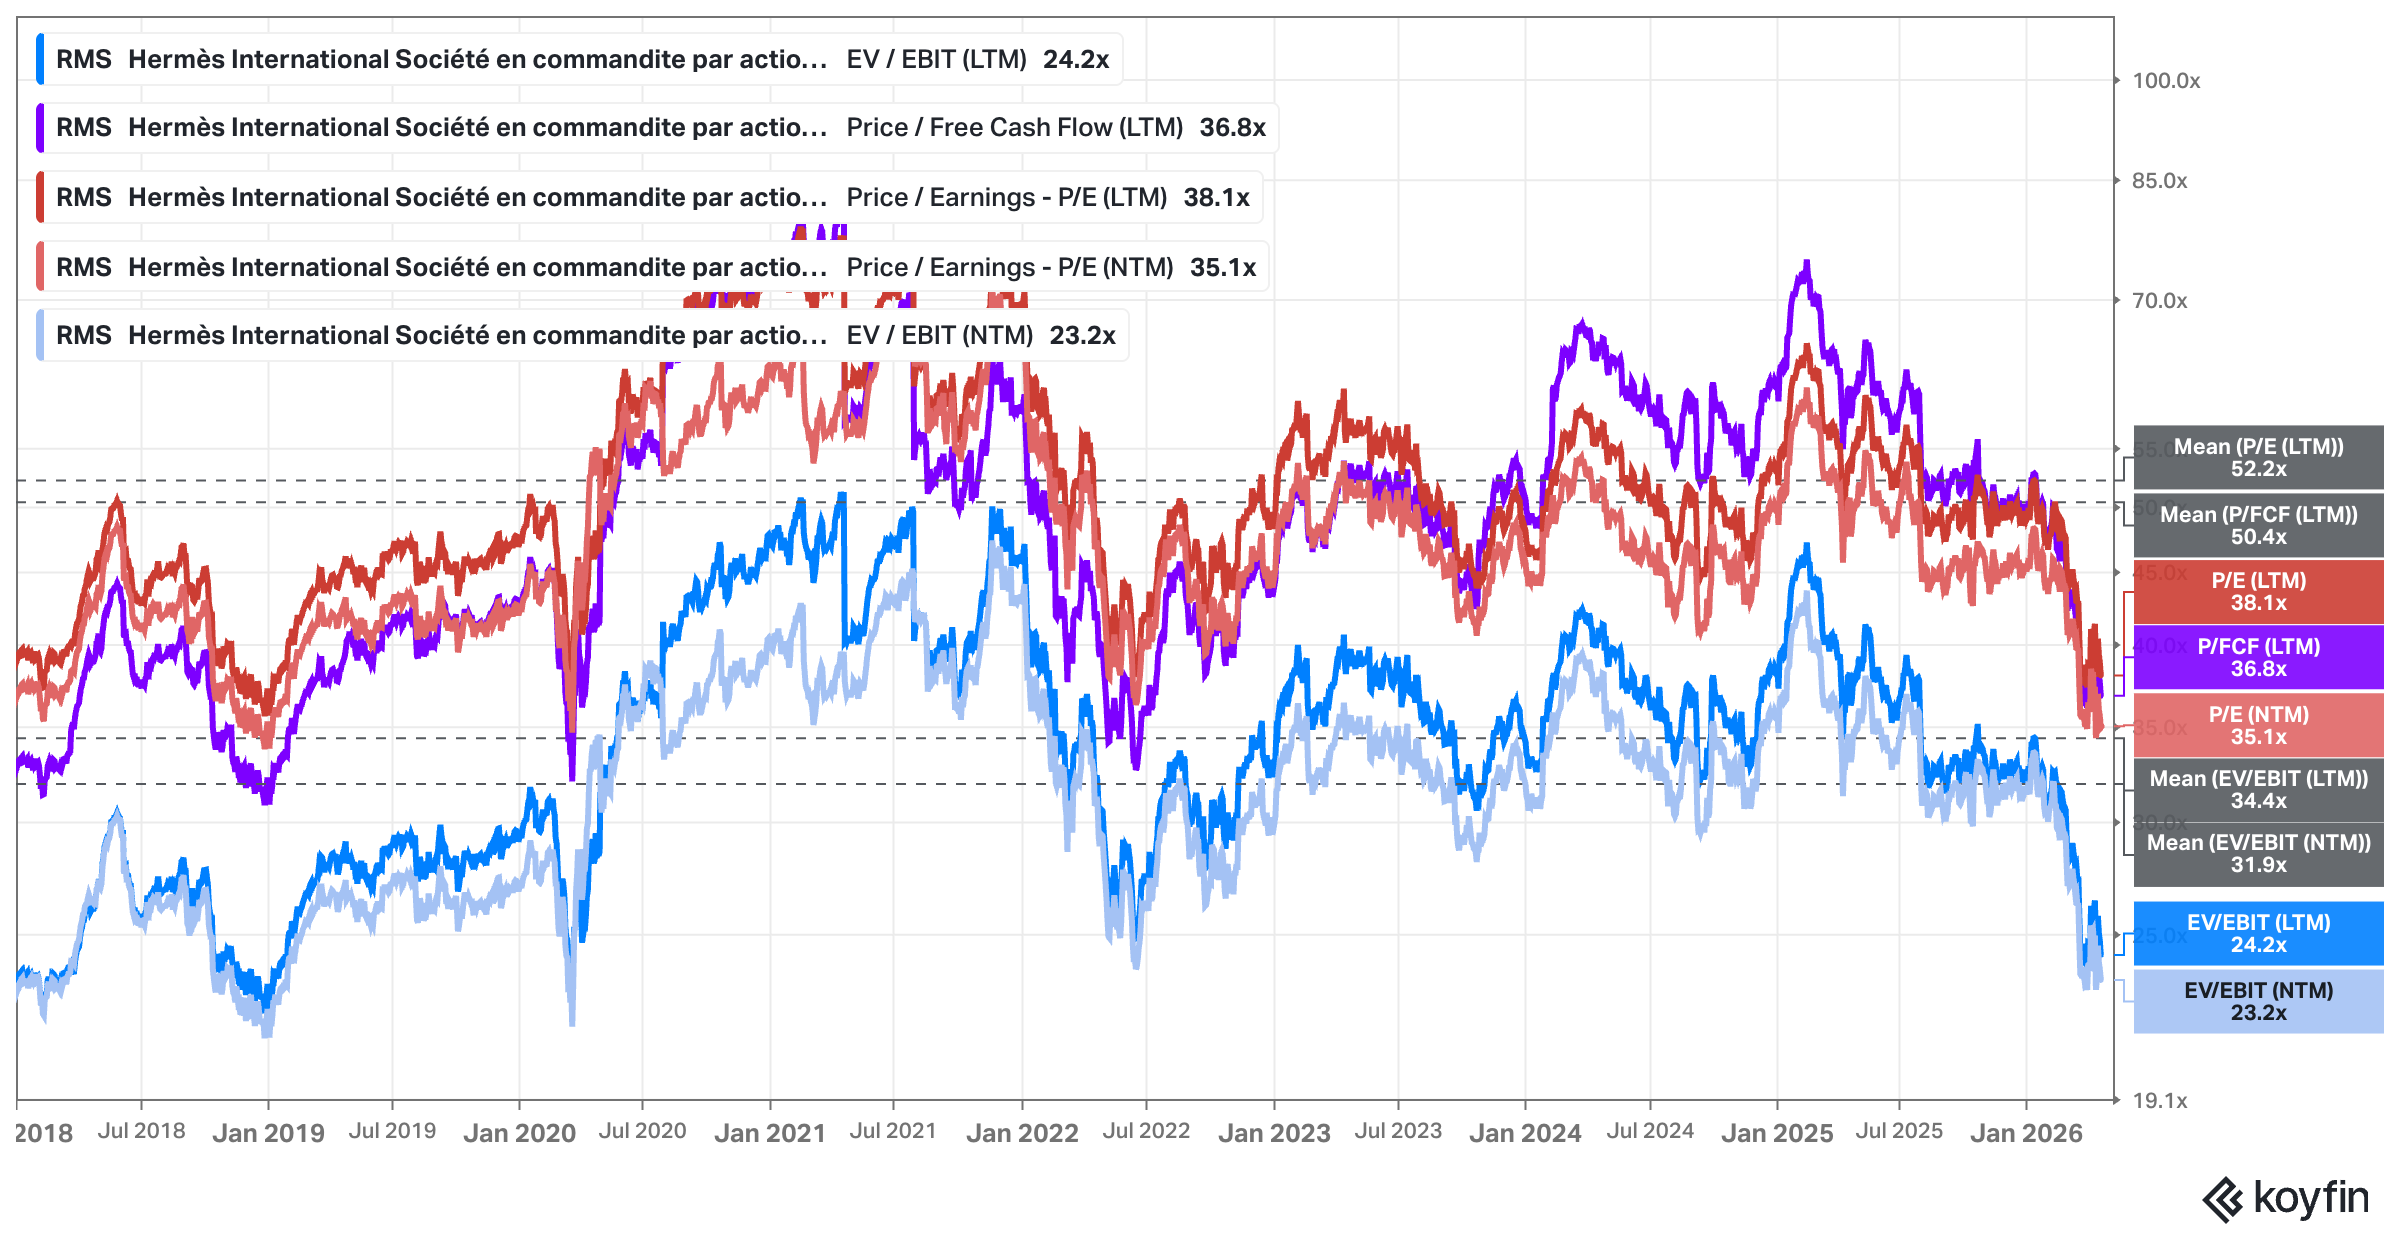
From a valuation perspective, the stock has historically commanded a P/E multiple near 50x, but the recent sell–off has compressed the Forward P/E toward the mid–30s. When you factor in the €12.2 billion net cash position and a recurring operating margin of 41%, you are paying a “normal” price for an extraordinary business. I see this as a rare opportunity to buy a “scarcity engine” before the tax and currency headwinds shift into tailwinds.
The rationale for Hermès often trading at a 50x earnings multiple – a price I personally would never pay because I’m a “thumb-sucking” value investor – is rooted in the sheer durability of its growth. A standard discounted cash flow model, which typically forces growth down to a 3% terminal rate after ten years, simply cannot capture the weight of a brand with this much heritage. Hermès isn’t just another luxury label – it is a multi-generational compounding machine. When you apply a traditional “fade” to its growth, you are essentially betting against two centuries of evidence that suggests this brand power is anything but temporary, and comes with tremendous pricing power.
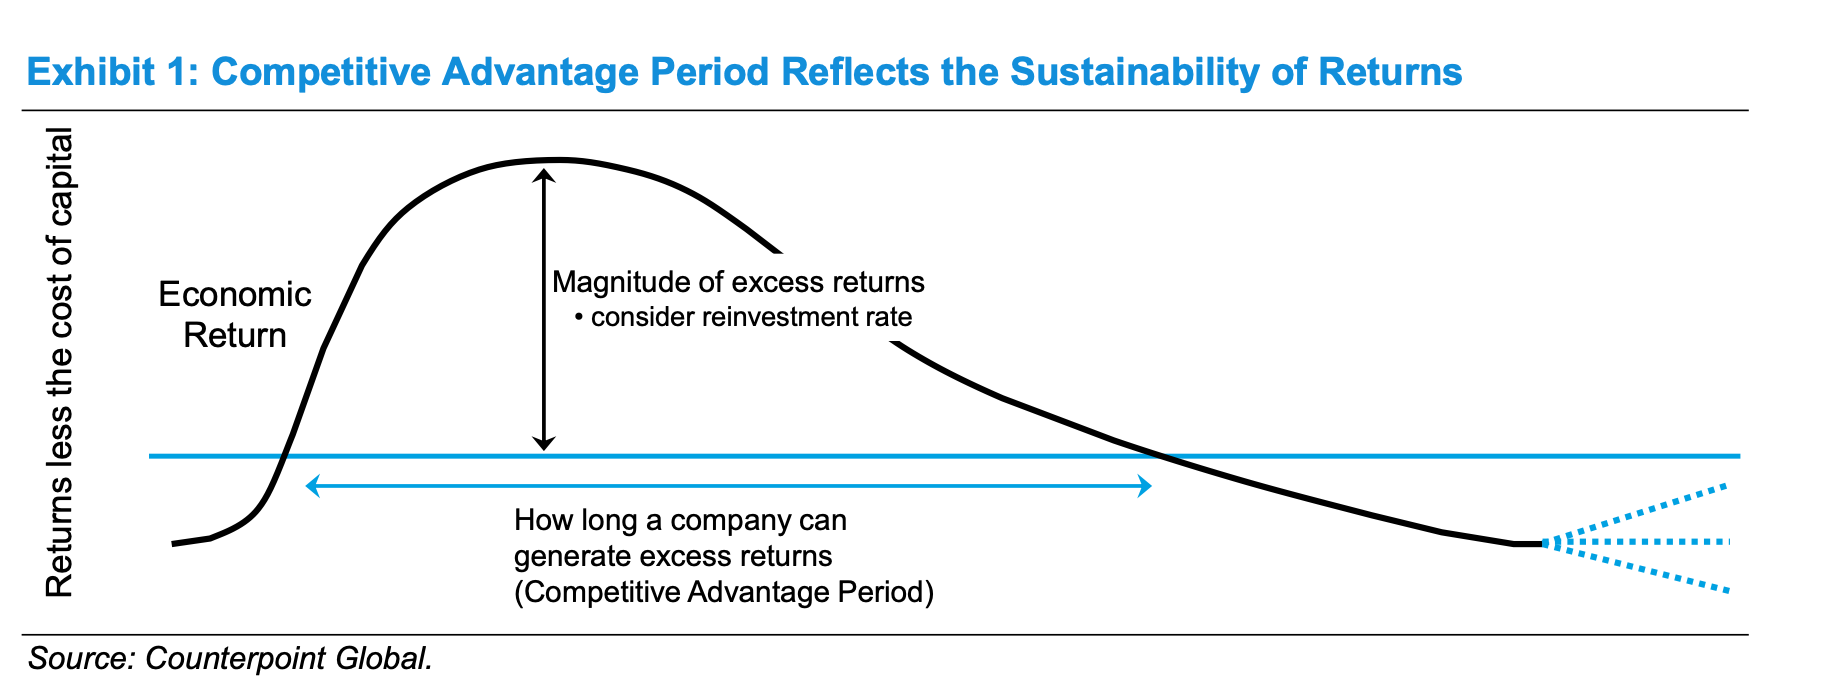
If you want to understand the mechanics of this better, I suggest checking out Michael Mauboussin’s recent report on the “Competitive Advantage Period,” or CAP. It is essential reading for anyone serious about quality investing. He makes the case that value creation is a function of how much a company’s return on invested capital exceeds its cost of capital and, crucially, how long it can sustain that positive spread. This “how long” part is what the market consistently misprices. For Hermès, the competitive advantage period isn’t measured in years but in decades, meaning the terminal value assumptions used by most analysts are likely far too conservative.
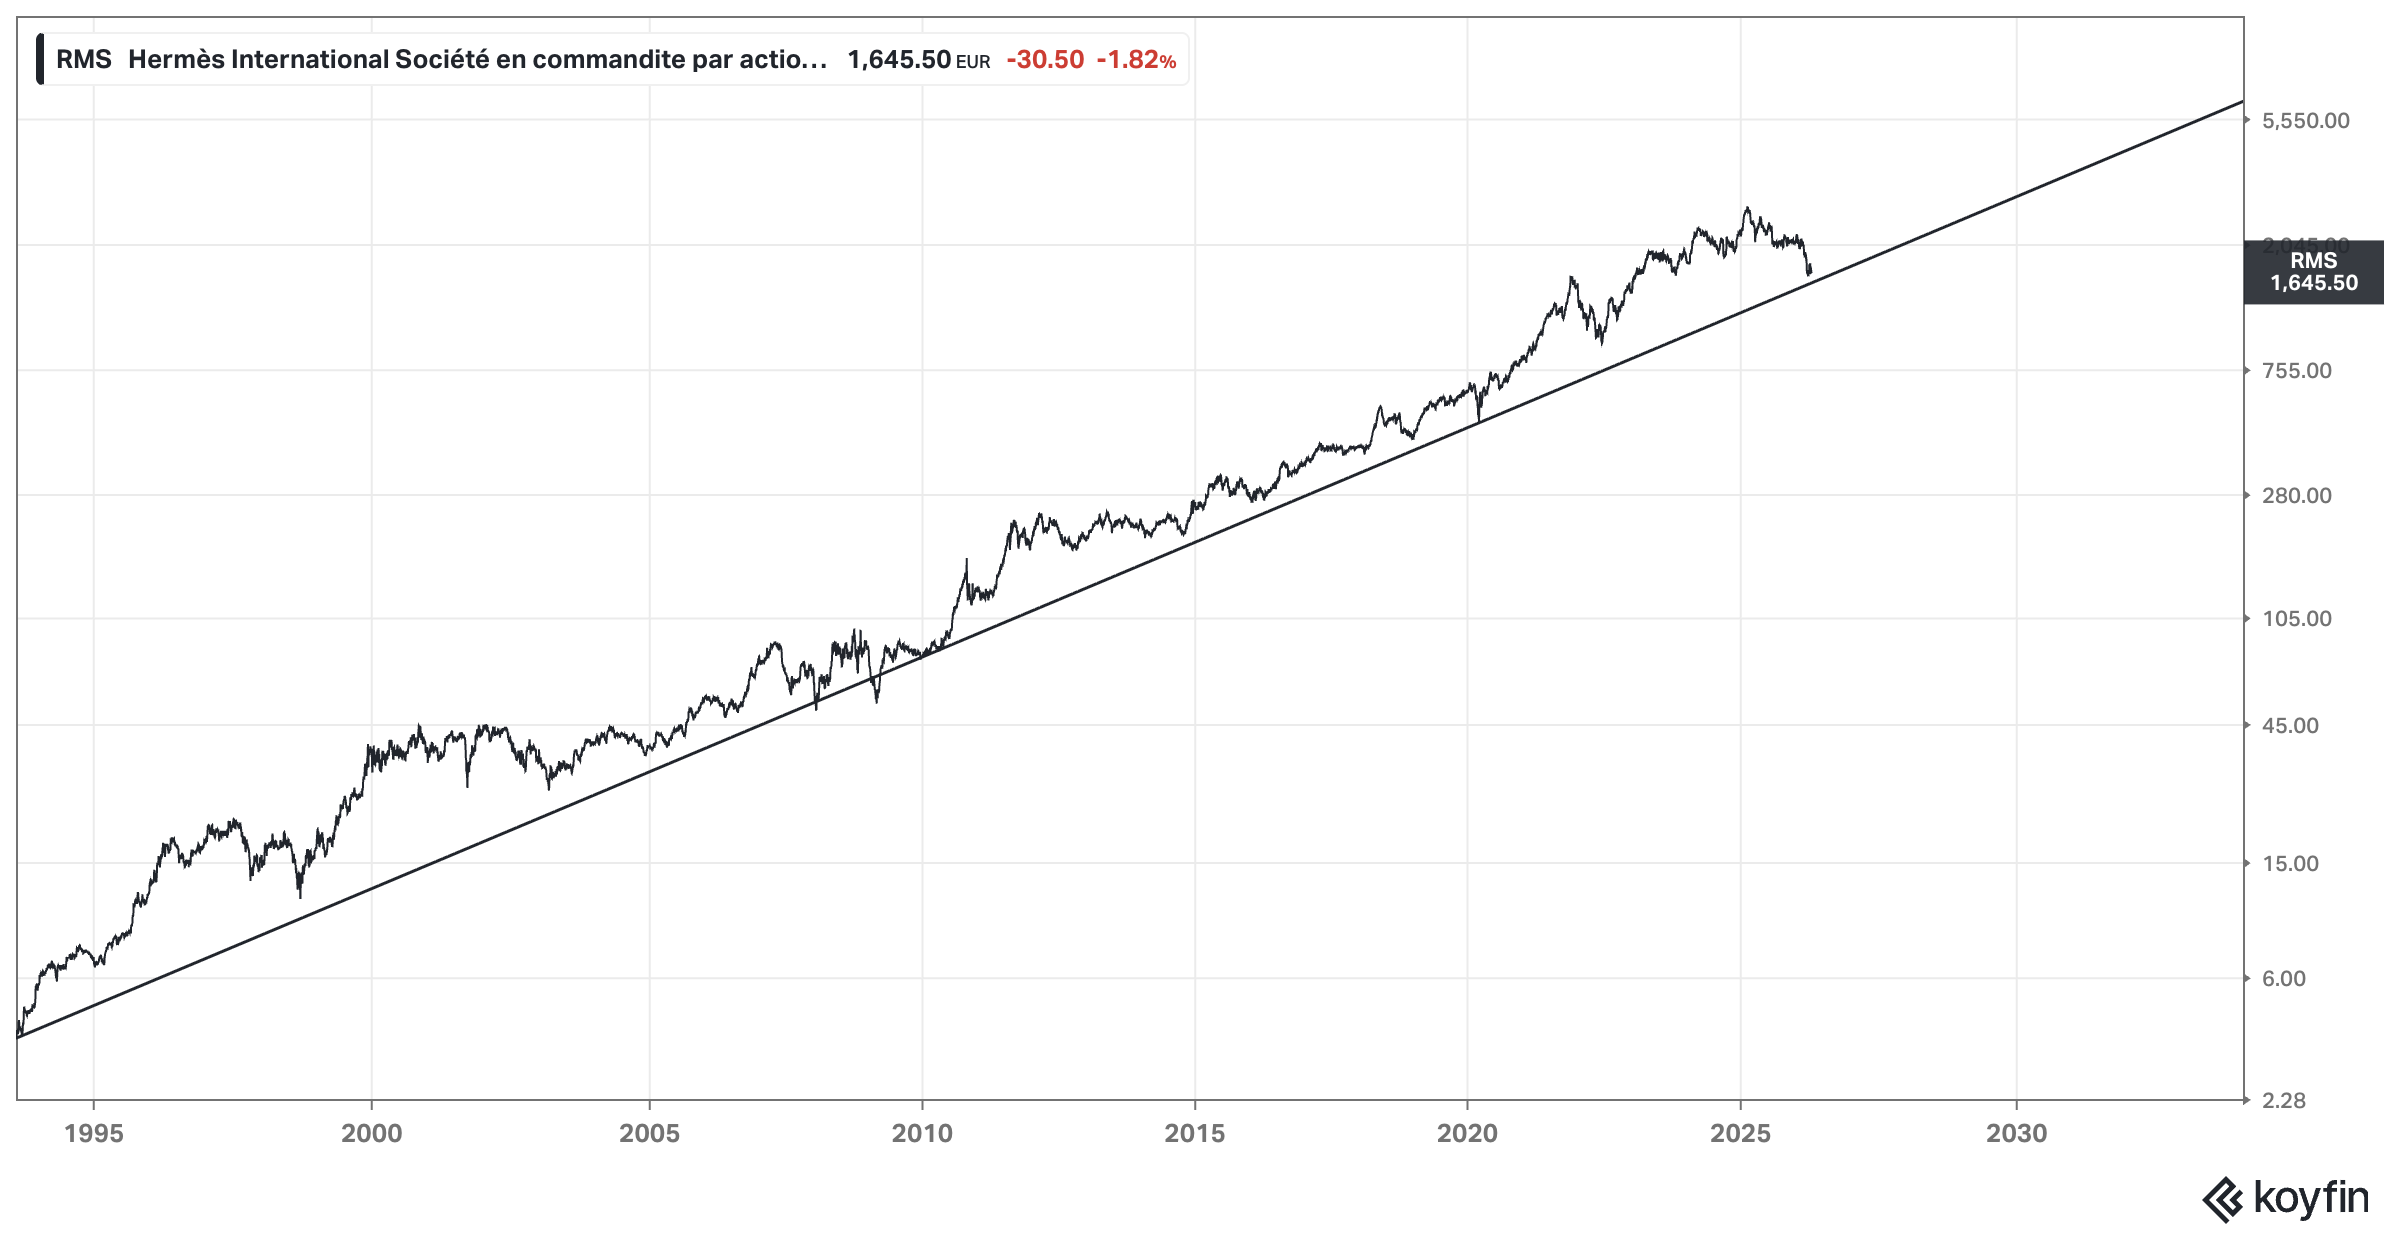
From a technical analysis perspective, Hermès is interesting as the long-term trend line indicates the stock hasn’t broken its uptrend since the early 1990s, …
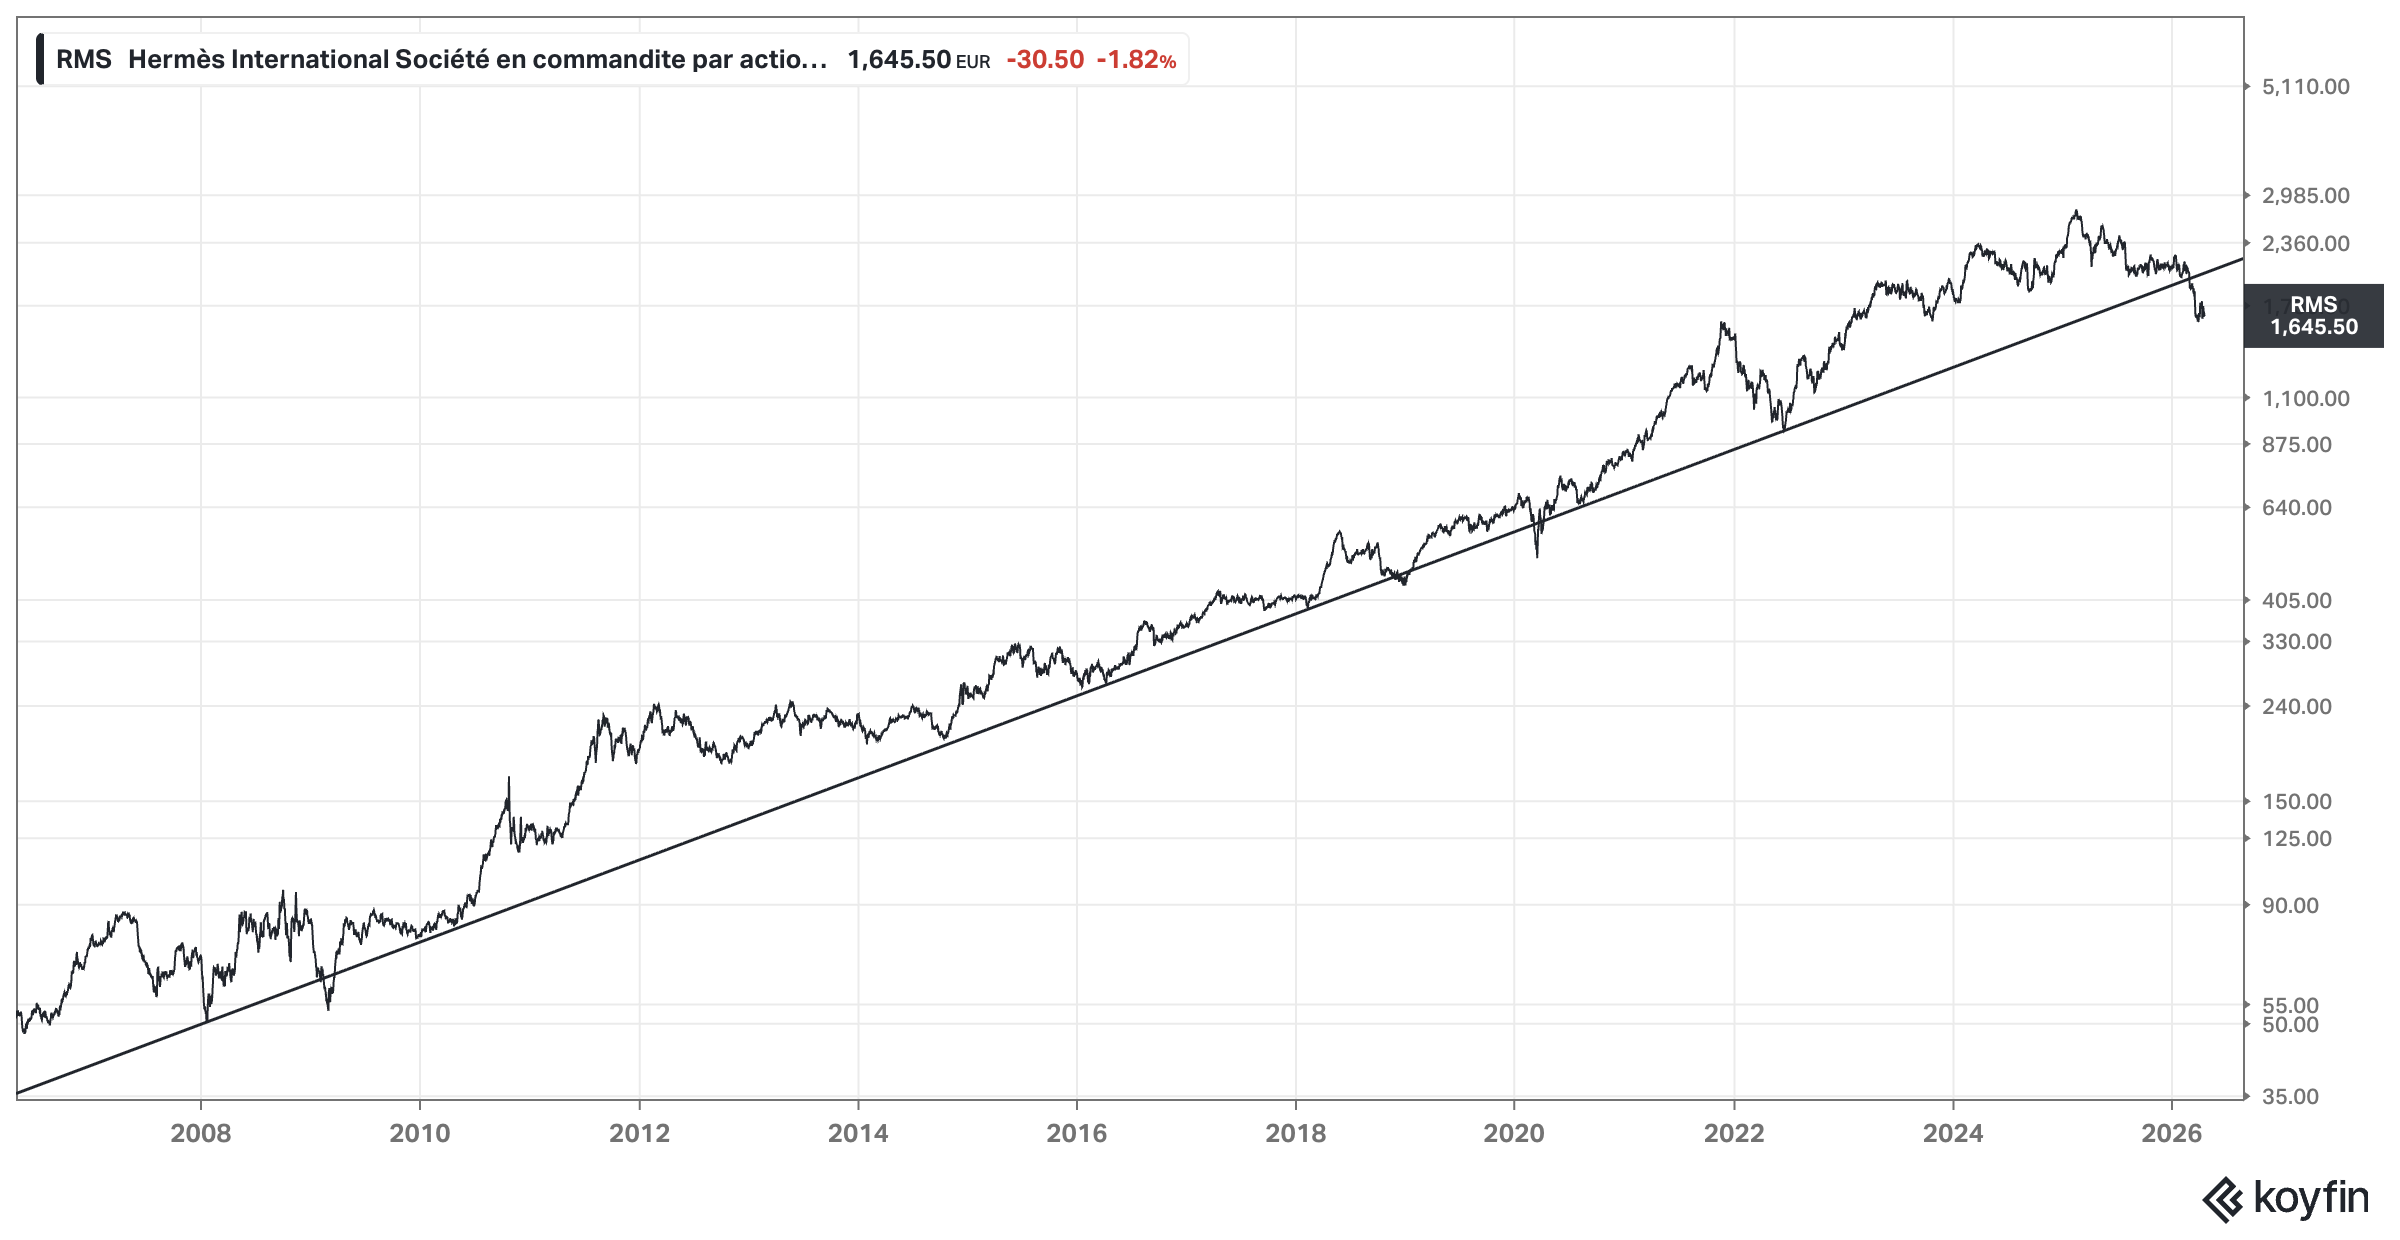
… however, if you zoom in a little and consider the last twenty years, the stock of Hermès has already broken through the uptrend, indicating that there may be more downside. As we noted in our perception change framework, “the longer and steeper the uptrend, the more violent the reversion when it finally breaks.”
To follow up on this segment on this luxury powerhouse, I recommend reading this piece I released a few days ago next:
Deep Dive: LVMH ($MC) – Is the Luxury King Losing Its Crown?

You can read the majority of this article entirely for free. If you find value in this research, consider becoming a Premium Member to unlock our full archive and join our growing circle of investors (I highly recommend checking out “The Libary” to see what’s inside; you can find it right on the homepage).
#3 – Hemnet ($HEM)
Over the years, I have spent a significant amount of time studying digital platforms and marketplaces – some of the best business models the world has ever seen –, and Hemnet is structurally just as “elegant.” While global peers like Rightmove or Scout24 often struggle with the inherent price sensitivity of real estate agents, Hemnet has cracked the code by monetizing the home seller directly.
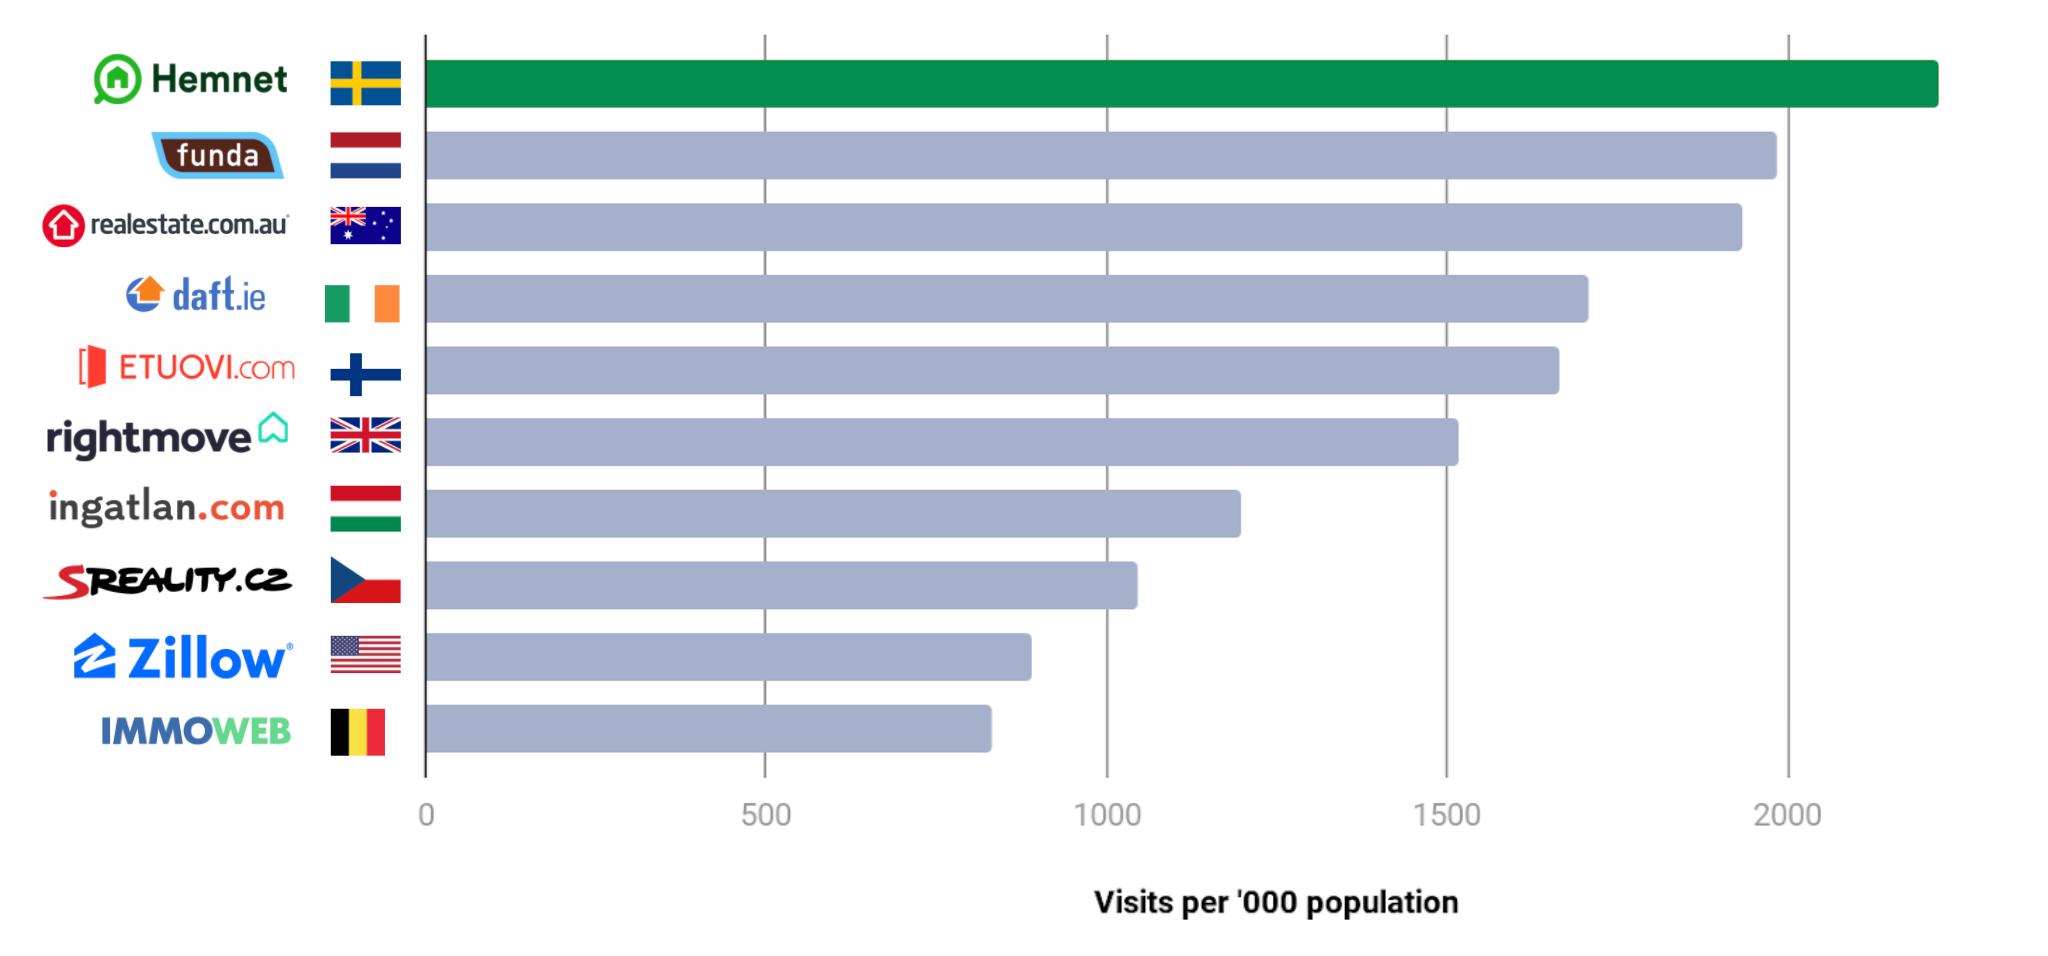
This is a critical distinction because for a homeowner selling an asset worth millions of crowns, a listing fee of a few hundred is practically a rounding error – typically accounting for just 0.1% to 0.2% of the total property value. While Hemnet’s listing fees historically ranged from 1,500 to 10,000 SEK (roughly $150-$1,000), heavily dependent on the chosen package (Basic, Plus, or Premium), the Q4 2025 results show that Average Revenue Per Listing (ARPL) has actually surged to 10,916 SEK more recently.
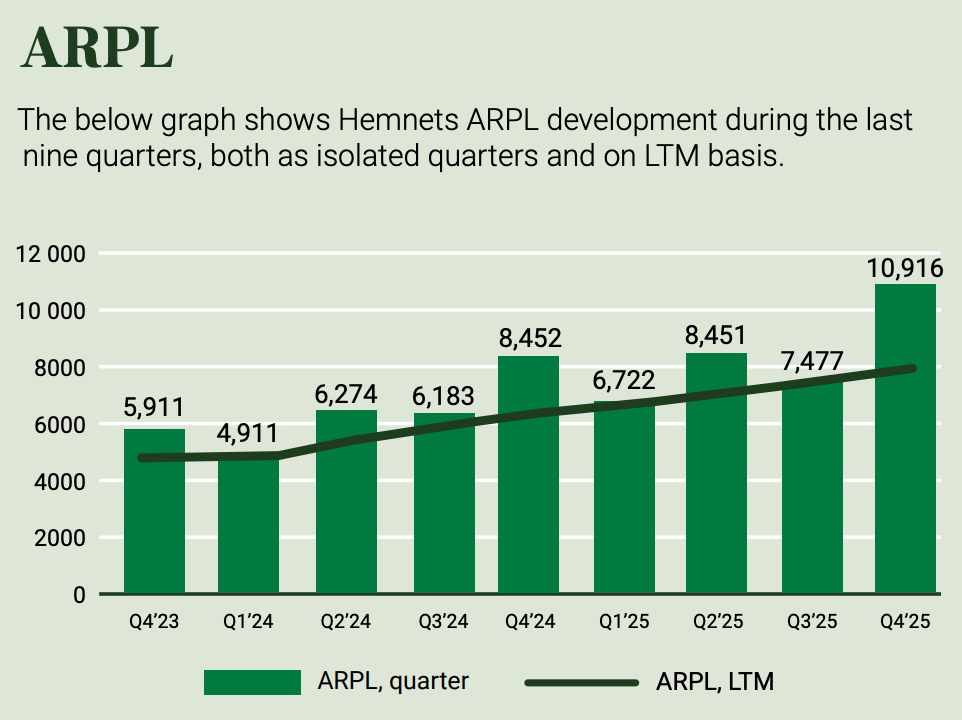
This roughly 30% year-over-year increase demonstrates that through dynamic pricing and the new high-end Hemnet Max tier, many sellers are now paying well above the traditional 10,000 SEK “ceiling” to secure premium visibility.

This unique position gives the company a level of pricing power that its international counterparts can only envy, underpinned by the fact that nine out of ten homes sold in Sweden are listed on its platform.
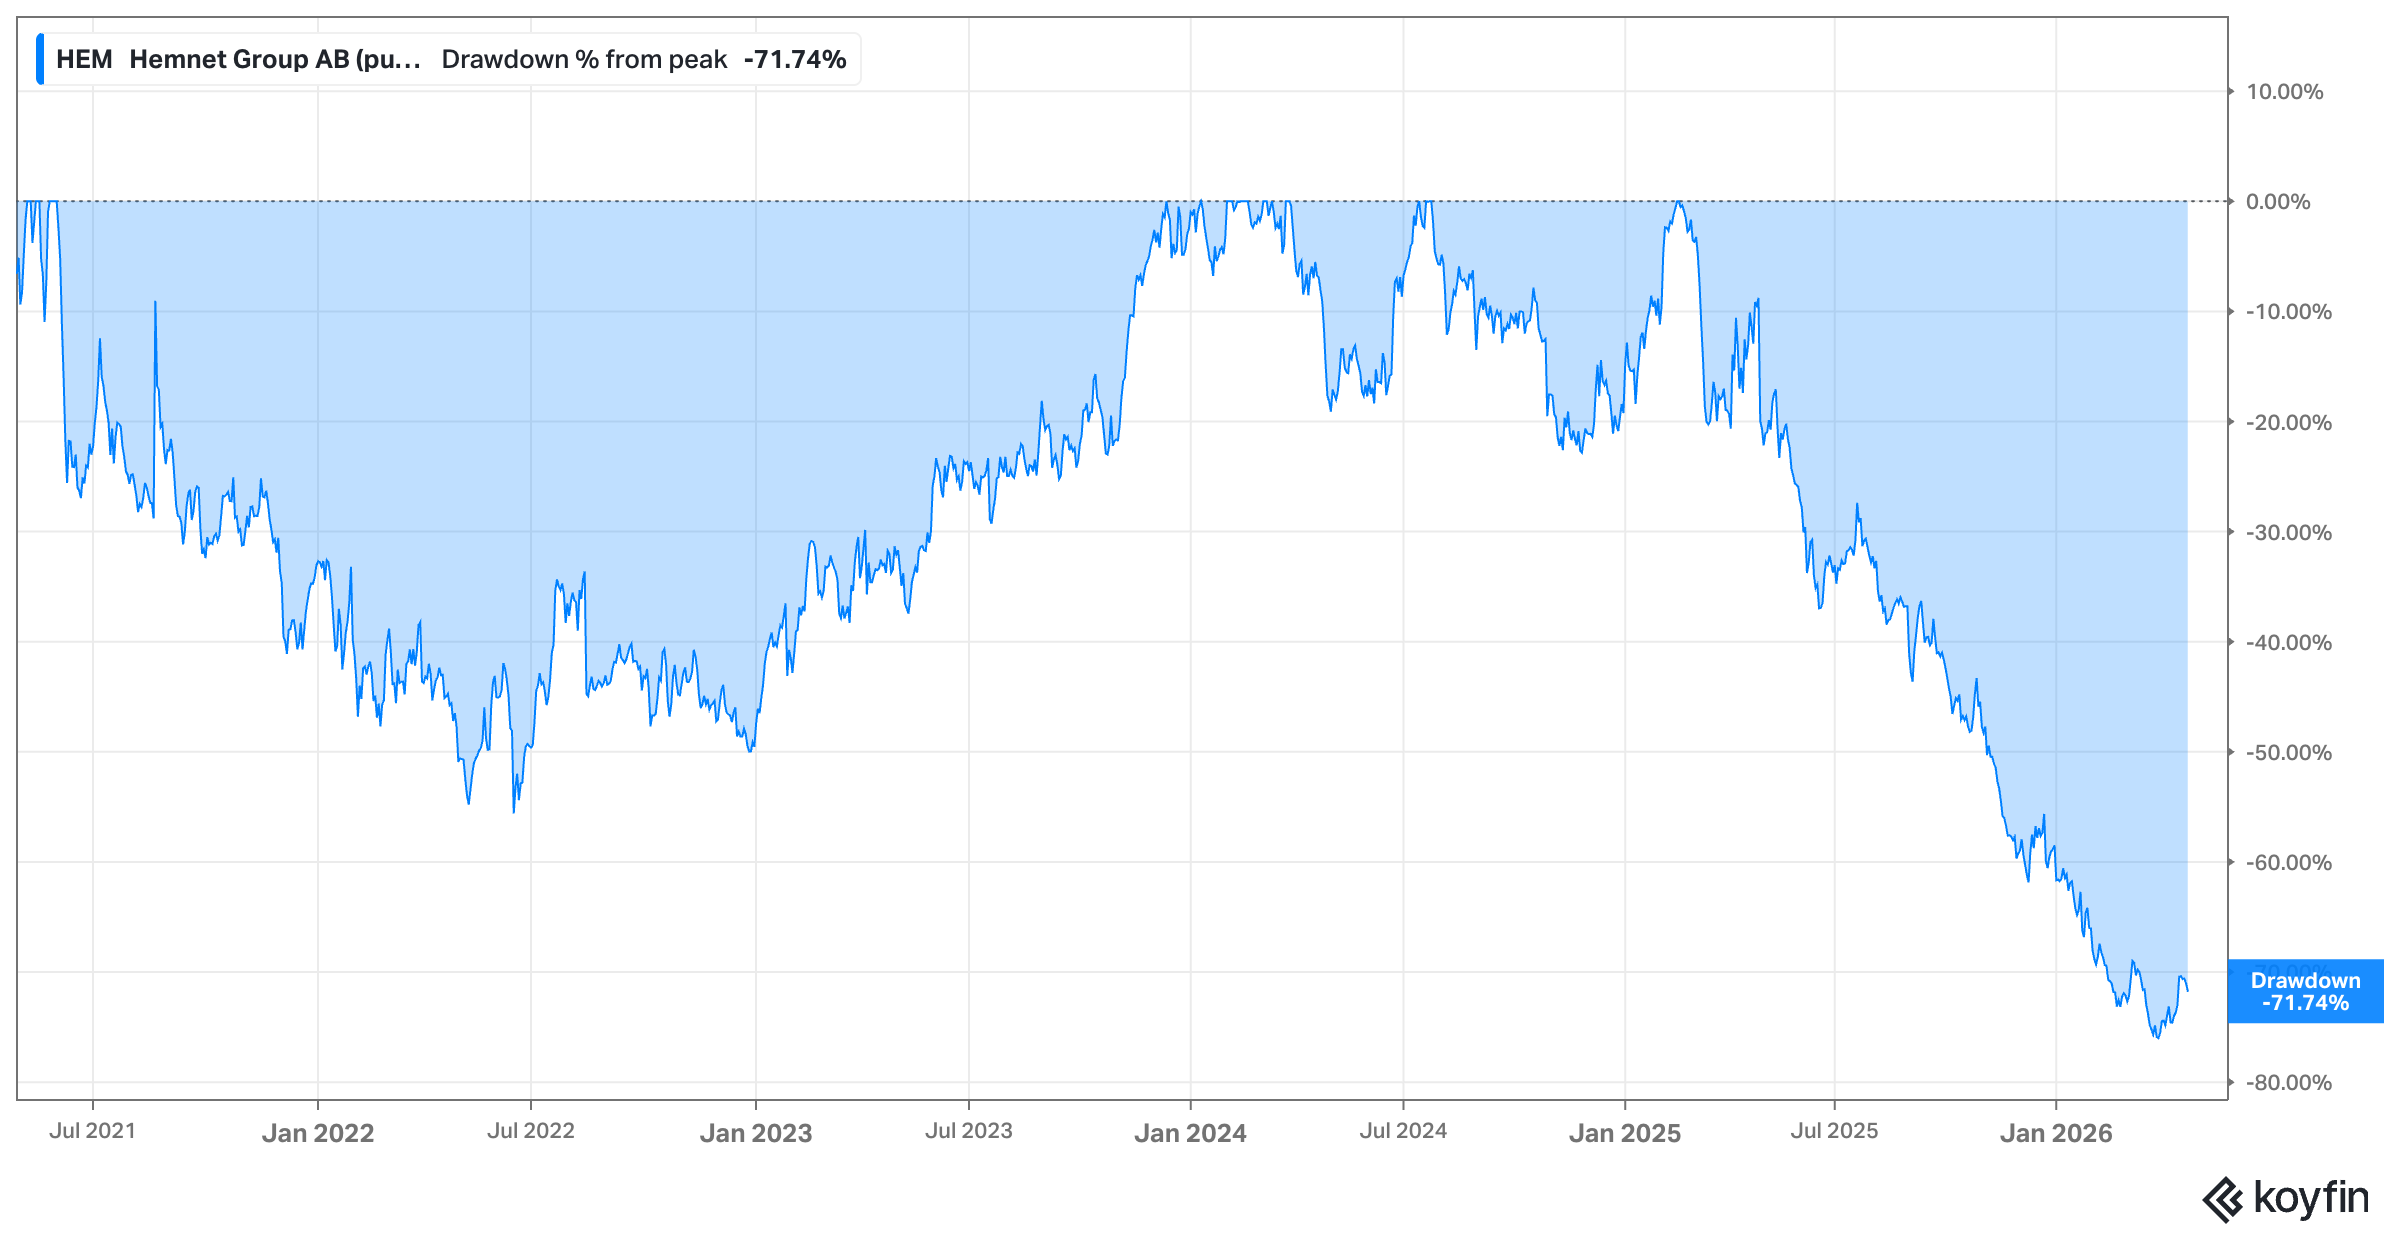
Despite this dominant “toll bridge” status, the stock has been caught in a brutal correction, currently sitting roughly 72% below its early 2025 highs as the market has rotated away from high–multiple growth names.
This is where it gets interesting.
Become a paying subscriber to read the rest of this post and get access to all of my other research, including valuation spreadsheets, deep dives (e.g. well-known mid- and large caps such as LVMH, Duolingo, Meta, Edenred as well as more hidden gems such as Tiger Brokers, Digital Ocean, Ashtead Technologies, InPost, Timee, and MANY more), and powerful investing frameworks.
Annual members also get access to my private WhatsApp groups – daily discussions with like-minded investors, analysis feedback, and direct access to me.