Dear compounders,
For most of the past two years, the macro script for 2026 seemed written in ink: inflation cools, central banks ease, and every business living off interest income slowly gives back its windfall.
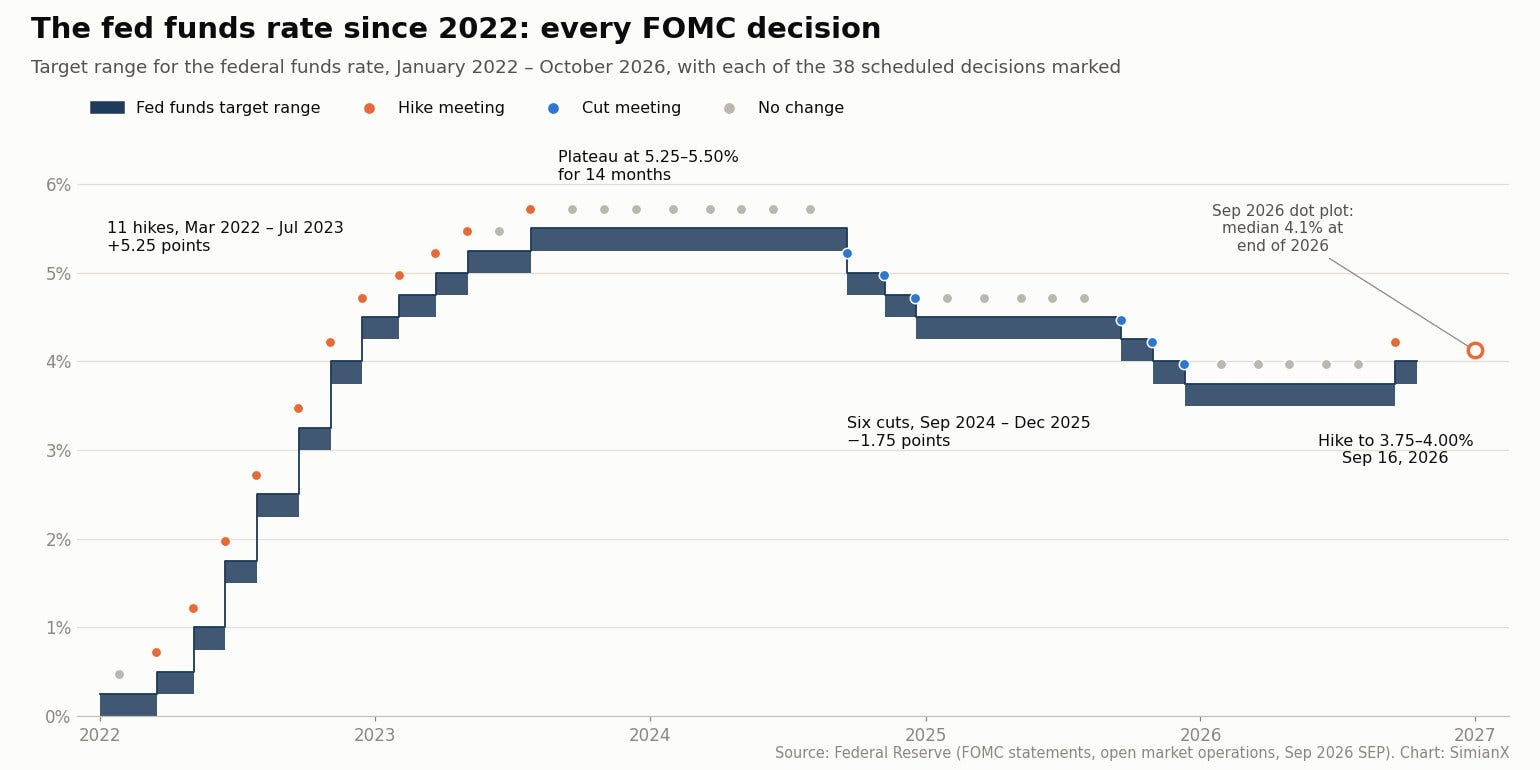
An energy shock tore that script up. In mid-September, the Fed unanimously raised its target range by 25bp to 3.75%–4.00%, its first hike since July 2023, and at its October 28 meeting it held in a 10–2 vote where both dissenters wanted to go higher.
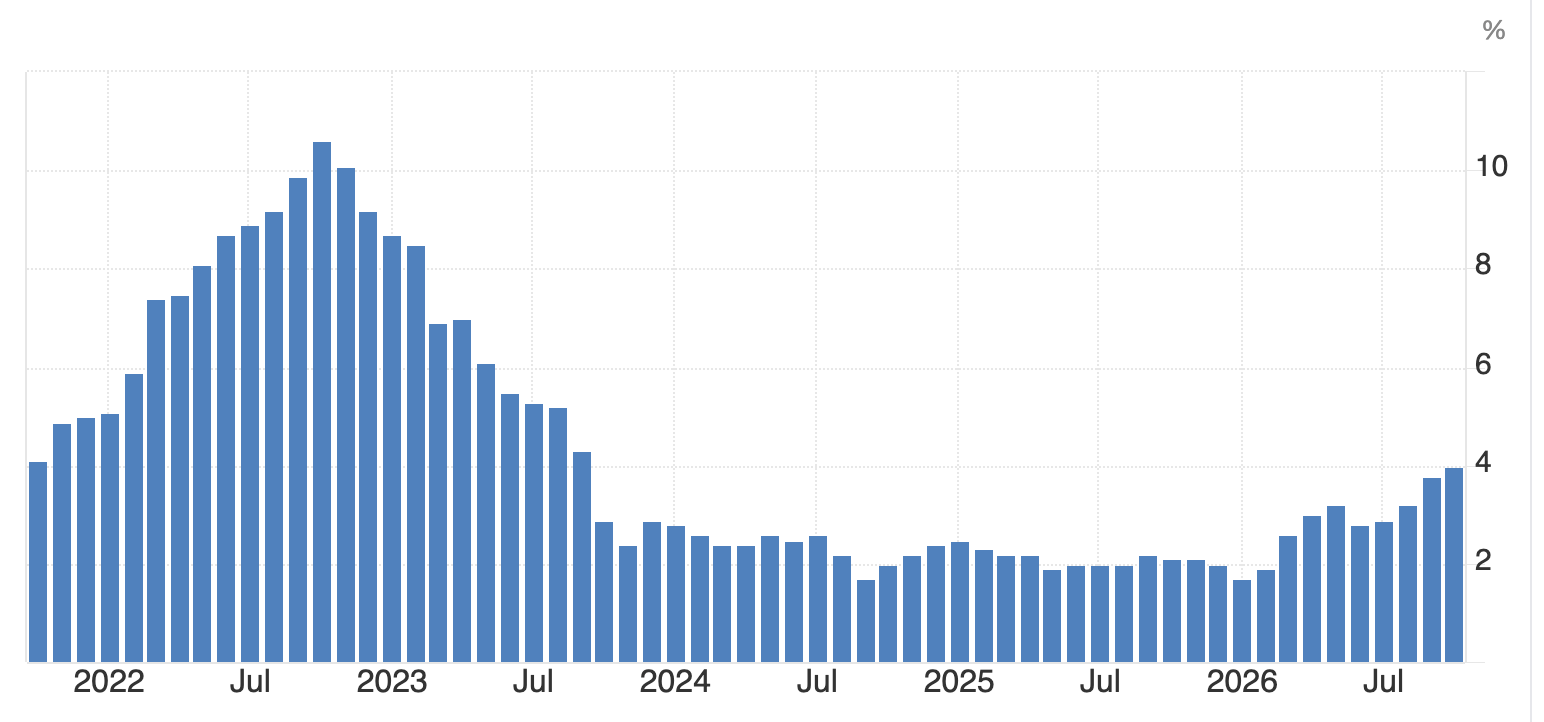
The ECB raised its deposit rate in June and again in September, taking it to 2.50%, and left it there on October 29 even though euro-area inflation is running at 4%.
The Bank of England moved last. Bank Rate had stood at 3.75% since a cut in December 2025, three members of the MPC already voted for a hike in September, and on November 5 the Bank followed through with a 25bp increase to 4.00%, its first since August 2023.
“Higher for longer” is back!
And with it comes an old question:
Which businesses earn more when money gets more expensive? And which of them aren’t yet being rewarded for it?
Some of the answers are too obvious to be interesting. Banks earn a spread on deposits. Brokers like Interactive Brokers keep a healthy share of the interest on client cash and spell out precisely what every rate move is worth. The market knows how to price those, arguably. We just shared our perspective on IBKR in the analysis below.
Deep Dive: Interactive Brokers ($IBKR)

Interactive Brokers has been in my portfolio for close to three years now if I recall correctly, and in all that time I have never dedicated a post to it (to be fair, I only started writing on this blog around two years ago).
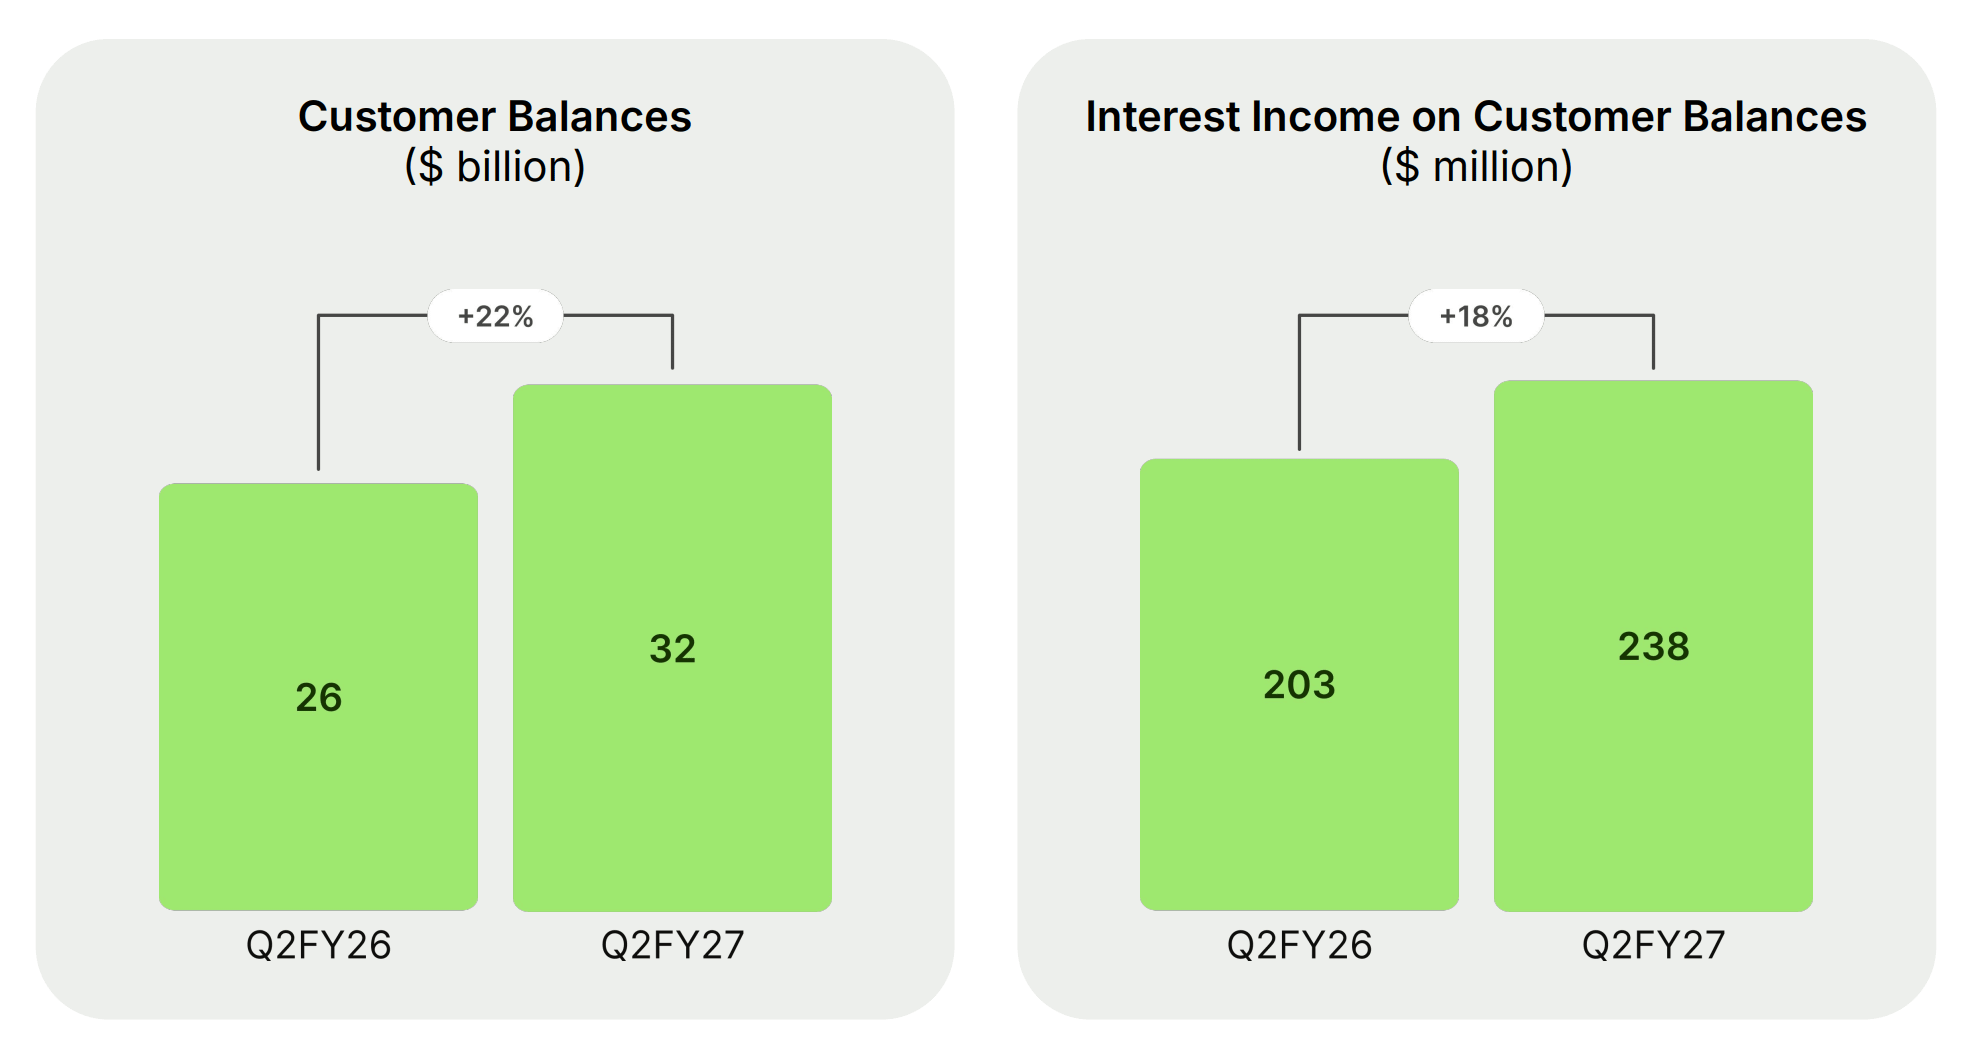
What fascinates me more are the companies that became rate beneficiaries almost by accident. Wise is my favorite example. It’s a payments company; it doesn’t lend out a single dollar, and yet its customers had parked $32.1bn on its balance sheet by the end of September. In Q2 FY27 alone, that pile generated $238.2m of interest income.
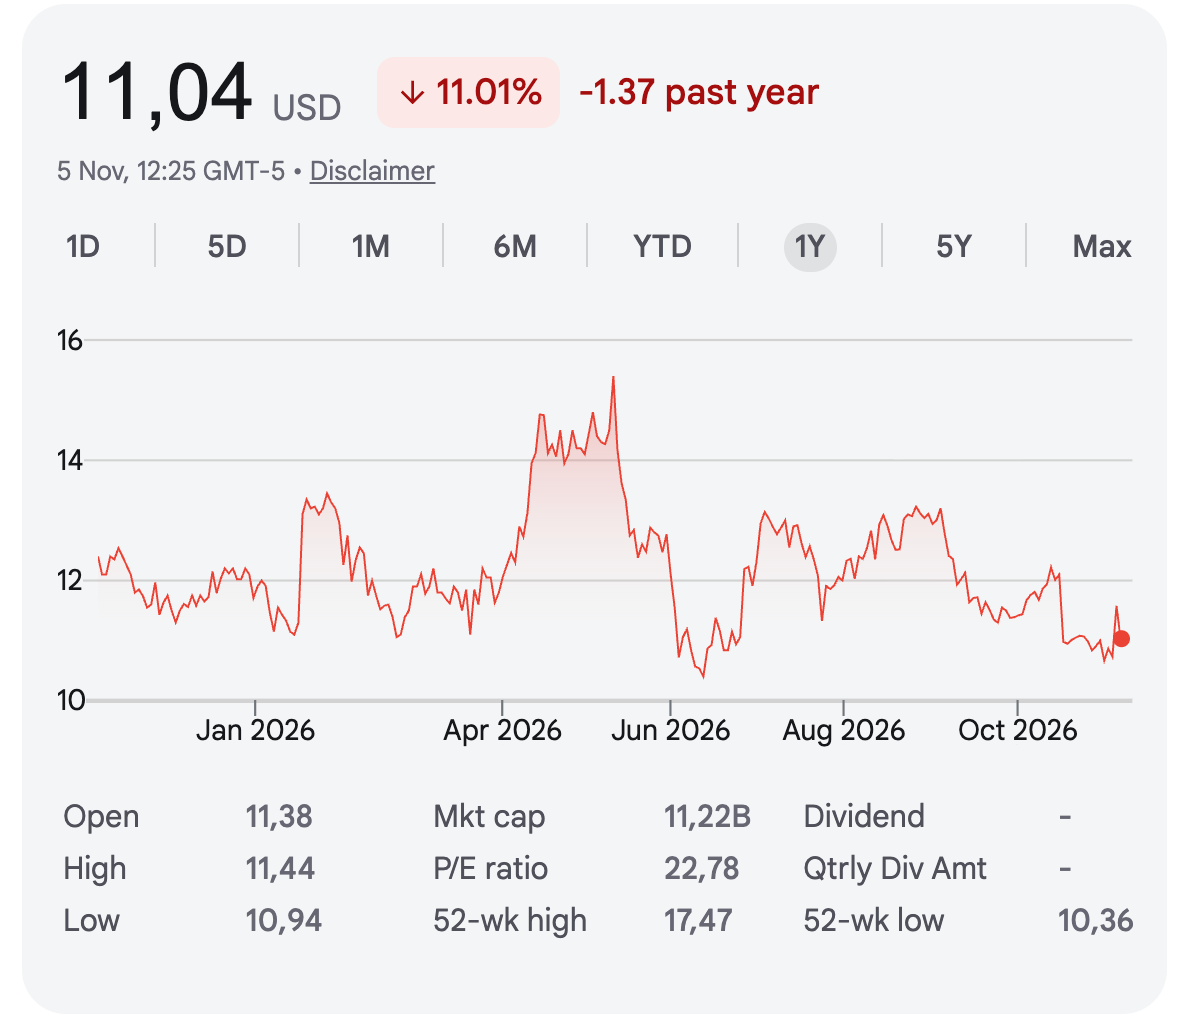
And the share price? WSE trades at around $11 on November 5, barely above its 52-week low of $10.36, roughly a third below the $15.40 at which it closed on its Nasdaq debut in May.
Rates went up. The stock went down.
One project I have had on my “to do list” for some time is to study Wise’s interest income and the impact a “higher for longer” environment could have on Wise’s earnings power. And I want to flag two things before we begin. First, I own Wise shares, so please read everything that follows with that bias in mind. Second, the story turned out to be far messier than the “hidden rate winner” piece I set out to write. Depending on which central bank moves, the impact on Wise’s bottom line differs by more than a factor of two, and the central bank holding the biggest slice of Wise’s money matters least. Close to half of Wise’s reported pre-tax profit comes from interest it keeps above a 1% yield. And management has said fairly openly that it would prefer to hand a good part of that money back to customers.
So this analysis has a lot of ground to cover.
I’ll start with where the money sits and how it earns a return. Then I’ll explain Wise’s 1% rule and its 80/20 promise, followed by the awkward gap between that promise and what Wise actually pays out. From there, I’ll break the sensitivity down by central bank, stress-test it in both directions, and close with the question that matters most to shareholders: is the market right to shrug all of this off?
Overview of what we will cover:
Where Wise’s $32bn of customer balances are stored, from money market funds to short-dated government bonds, and why that should be considered in this analysis
Wise’s 1% rule and its 80/20 promise, and why a listed company would choose to give most of a rate windfall away
Walk through what Wise earned on customer money in FY26, what it paid back, and how wide the gap between the two turned out to be
Trace where that gap comes from, region by region, from UK e-money rules to opt-in friction in the US
Use Wise’s own disclosures to work out what a 25bp move is worth to its pre-tax profit today
Rebuild the picture currency by currency and central bank by central bank, and rank the Fed, the ECB and the Bank of England by how much each one moves Wise’s earnings
Test that ranking against the 2026 hiking cycle, including the Bank of England’s November hike
Build multiple sensitivity tables covering rate moves of up to 300bp in either direction, from today out to three years of balance growth
All tables are also attached as a downloadable Excel file.
Translate every scenario into a share of Wise’s earnings power and into what it means for the valuation at today’s share price
Close with whether the market is right to shrug all of this off, and what I’ll be watching next
The full analysis starts here!
Become a paying subscriber to read the rest of this post and get access to all of my other research, including valuation spreadsheets, deep dives (e.g. well-known mid- and large caps such as LVMH, Duolingo, Meta, Edenred as well as more hidden gems such as Digital Ocean, Ashtead Technologies, InPost, Timee, and MANY more), and powerful investing frameworks.
As a member, you get:
Complete Access: Every deep dive in our library (65+ and counting). The most thorough analyses you will be able to get your hands on (including downloadable models).
Access to my 150+ Global Watchlist: And How To Use It to Outperform the Market!
Slide Decks: Every deep dive now comes with a companion slide deck. It’s the whole argument in compressed form – the hypothesis, the business, the competitive position, the valuation, and the case against – for the days when you don’t have an hour to spare but still want the shape of the thing. Paid subscribers get both, the long piece and the deck.
The Community: Real-time discussion in the various subgroups of the subscriber chart, and networking opportunities with like-minded investors.
Digital Investing Conferences: Around three times a year, we also hold digital conferences where members present and share stock ideas, and discuss broader themes, and we’d love for you to join in!
Downloadable Visual Blueprints: Direct access to high-resolution PDF reference sheets distilling timeless investment classics, insights from my proprietary investing framework, and essential valuation mechanics into structured visual architecture. Print them, save them, and build your own institutional reference binder.
Incredible Value: Full access to all of this for less than €1/day.
PS: Using the app on iOS? Apple doesn’t allow in-app subscriptions without a big fee. To keep things fair and pay a lower subscription price, I recommend just heading to the site in your browser (desktop or mobile) to subscribe.
You can find an overview of the companies I shared a deep dive on in the visualization below.