

Interactive Brokers has been in my portfolio for close to three years now if I recall correctly, and in all that time I have never dedicated a post to it (to be fair, I only started writing on this blog around two years ago).
Strictly speaking, I discussed it in “Not All Reinvestment Is the Same: How Two Companies Reinvented Growth Strategies“
Given how much ink I spill on far smaller positions and names that don’t make it into my portfolio, that may strike you as odd.
The explanation has little to do with the company itself, and a lot to do with the kind of attention it asks of me as a shareholder. Or rather, the attention it doesn’t ask for.
When drafting this post (it’s not my typical deep dive, following my typical structure, but I believe it covers the thesis quite nicely nonetheless), I remember a distinction I drew in a post last year. More specifically, in an update on Wise back in mid-2025, I drew a line between two types of holdings:
“Every portfolio has its needy stocks – the ones that seem to require constant attention, where each earnings call might reveal a twist or signal a derailment. You watch them closely, read between the lines, scrutinize segment margins, and debate strategy with yourself. They’re not necessarily bad businesses, but they often come with more moving parts, more competitive risk, or more volatility in execution (which may have led to an attractive valuation in the first place).
Then there’s the other bucket: the ones you don’t have to babysit. You check in, not out of fear something’s gone wrong, but out of habit and discipline. These companies quietly go about compounding intrinsic value. Wise fits squarely into this category. I still read the full report. I still think critically about what might break the thesis. But the exercise is different. I’m not looking for a story to unravel – I’m tracking the same handful of long-term KPIs I’ve been following for months or sometimes years. And each time I check, I’m reminded why it’s in the portfolio.”
Funnily enough, Wise has since switched buckets. Between the stablecoin debate, mounting regulatory scrutiny, and the denial of its U.S. national trust bank charter, it has run into an almost perfect storm of headwinds that currently dominates the narrative, and I suspect it is clouding a lot of investors’ judgment.
That’s a topic for my next post, which I have planned already. Today, however, belongs to IBKR, which has always been my textbook example of the second bucket.
A few days ago, while reflecting on my first decade as an investor, I tweeted the following:
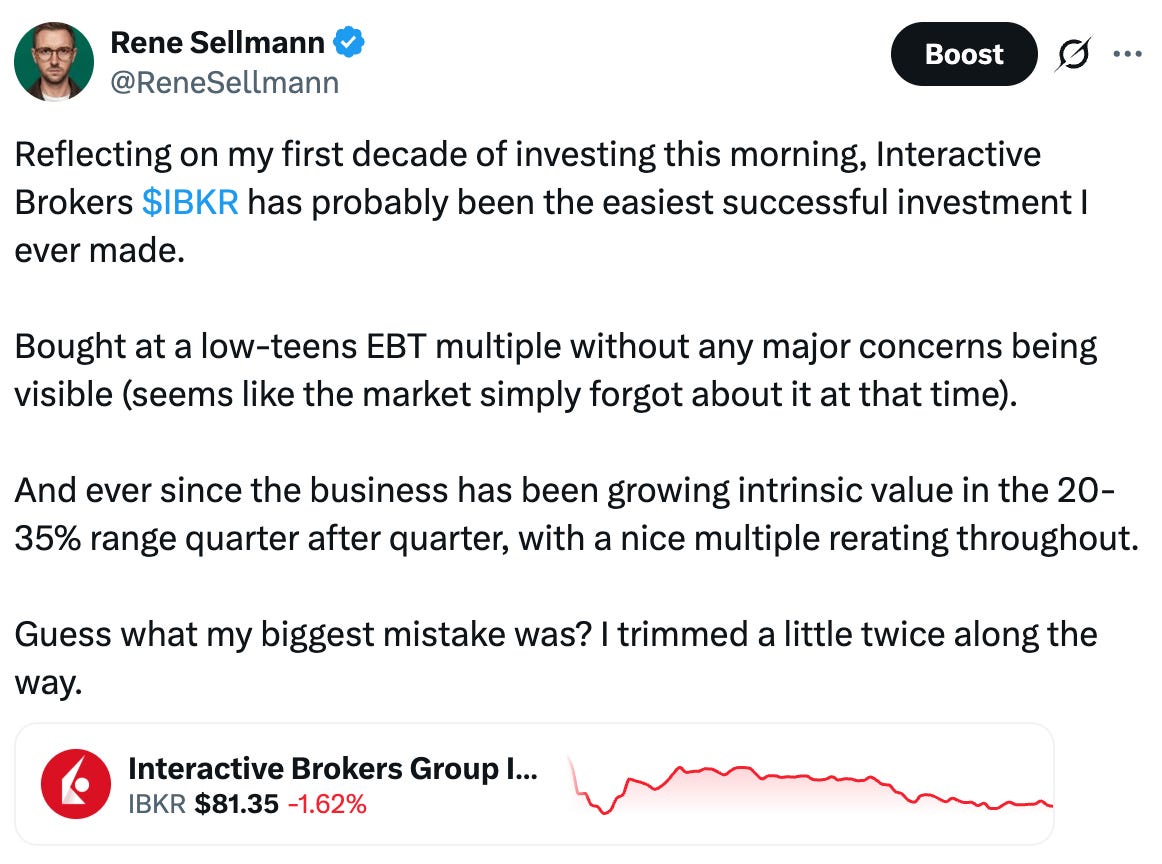
I meant every word of it. If anything, the business has outrun the expectations I had when I first bought it. Number of accounts, client equity, margin balances, and pretax earnings have all compounded faster than my base case, and the move from a low-teens to a now mid-20s EBT multiple (and higher at the recent peak) came on top of that.
My own contribution was mostly limited to getting in the way twice. Lesson noted.
So why write about it now? I still believe there isn’t a great deal to say about IBKR in any given quarter, and that’s precisely what makes it such a pleasant holding. But the third quarter was a little different. For the first time in a while, a few numbers softened, and trading activity cooled noticeably. The market noticed too. IBKR’s stock is now down close to 17% from its previous high, uncomfortably close to the 20% drawdown that technically marks bear market territory.
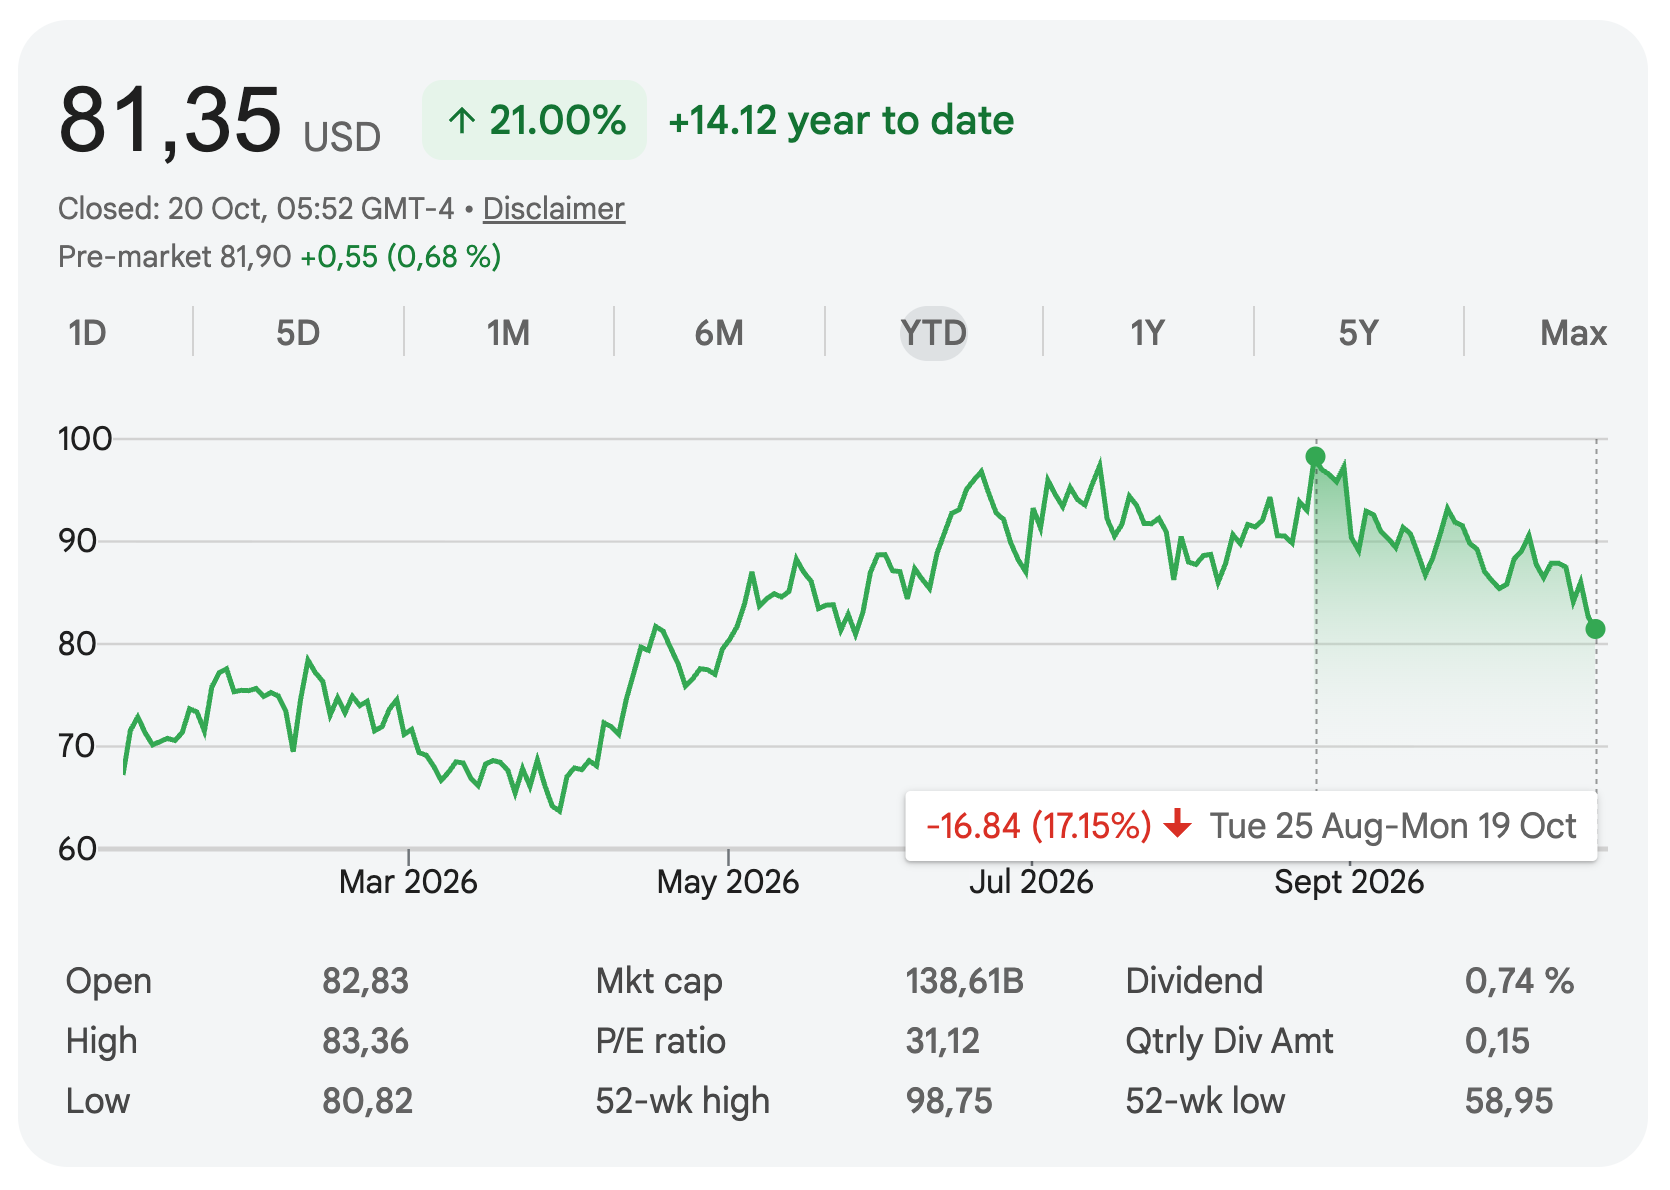
At the same time, I did something I hadn’t done since initiating the position in early 2024. I added to my IBKR position for the first time.
On the surface, those facts may seem to pull in opposite directions: a cooling business, a falling stock, and an investor buying more.
The rest of this post explains why I think they fit together. Before I get to the interesting parts, though, let me just very briefly walk you through the quarter itself.
Disclaimer:
As of the date of publication, the author OWNS SHARES in the company; but that may change. The analysis presented in this blog may be flawed and/or critical information may have been overlooked. The content provided should be considered an educational resource and should not be construed as individualized investment advice, nor as a recommendation to buy or sell specific securities. I may own some of the securities discussed. The stocks, funds, and assets discussed are examples only and may not be appropriate for your individual circumstances. It is the responsibility of the reader to do their own due diligence before investing in any index fund, ETF, asset, or stock mentioned or before making any sell decisions. Also double-check if the comments made are accurate. You should always consult with a financial advisor before purchasing a specific stock and making decisions regarding your portfolio.

A Record Quarter With a Soft Underbelly
On the surface, the third quarter was another record. Net revenues rose 16% to $1.91 billion ($1.87 billion adjusted), and pretax income climbed 14% to an all-time high of $1.50 billion.
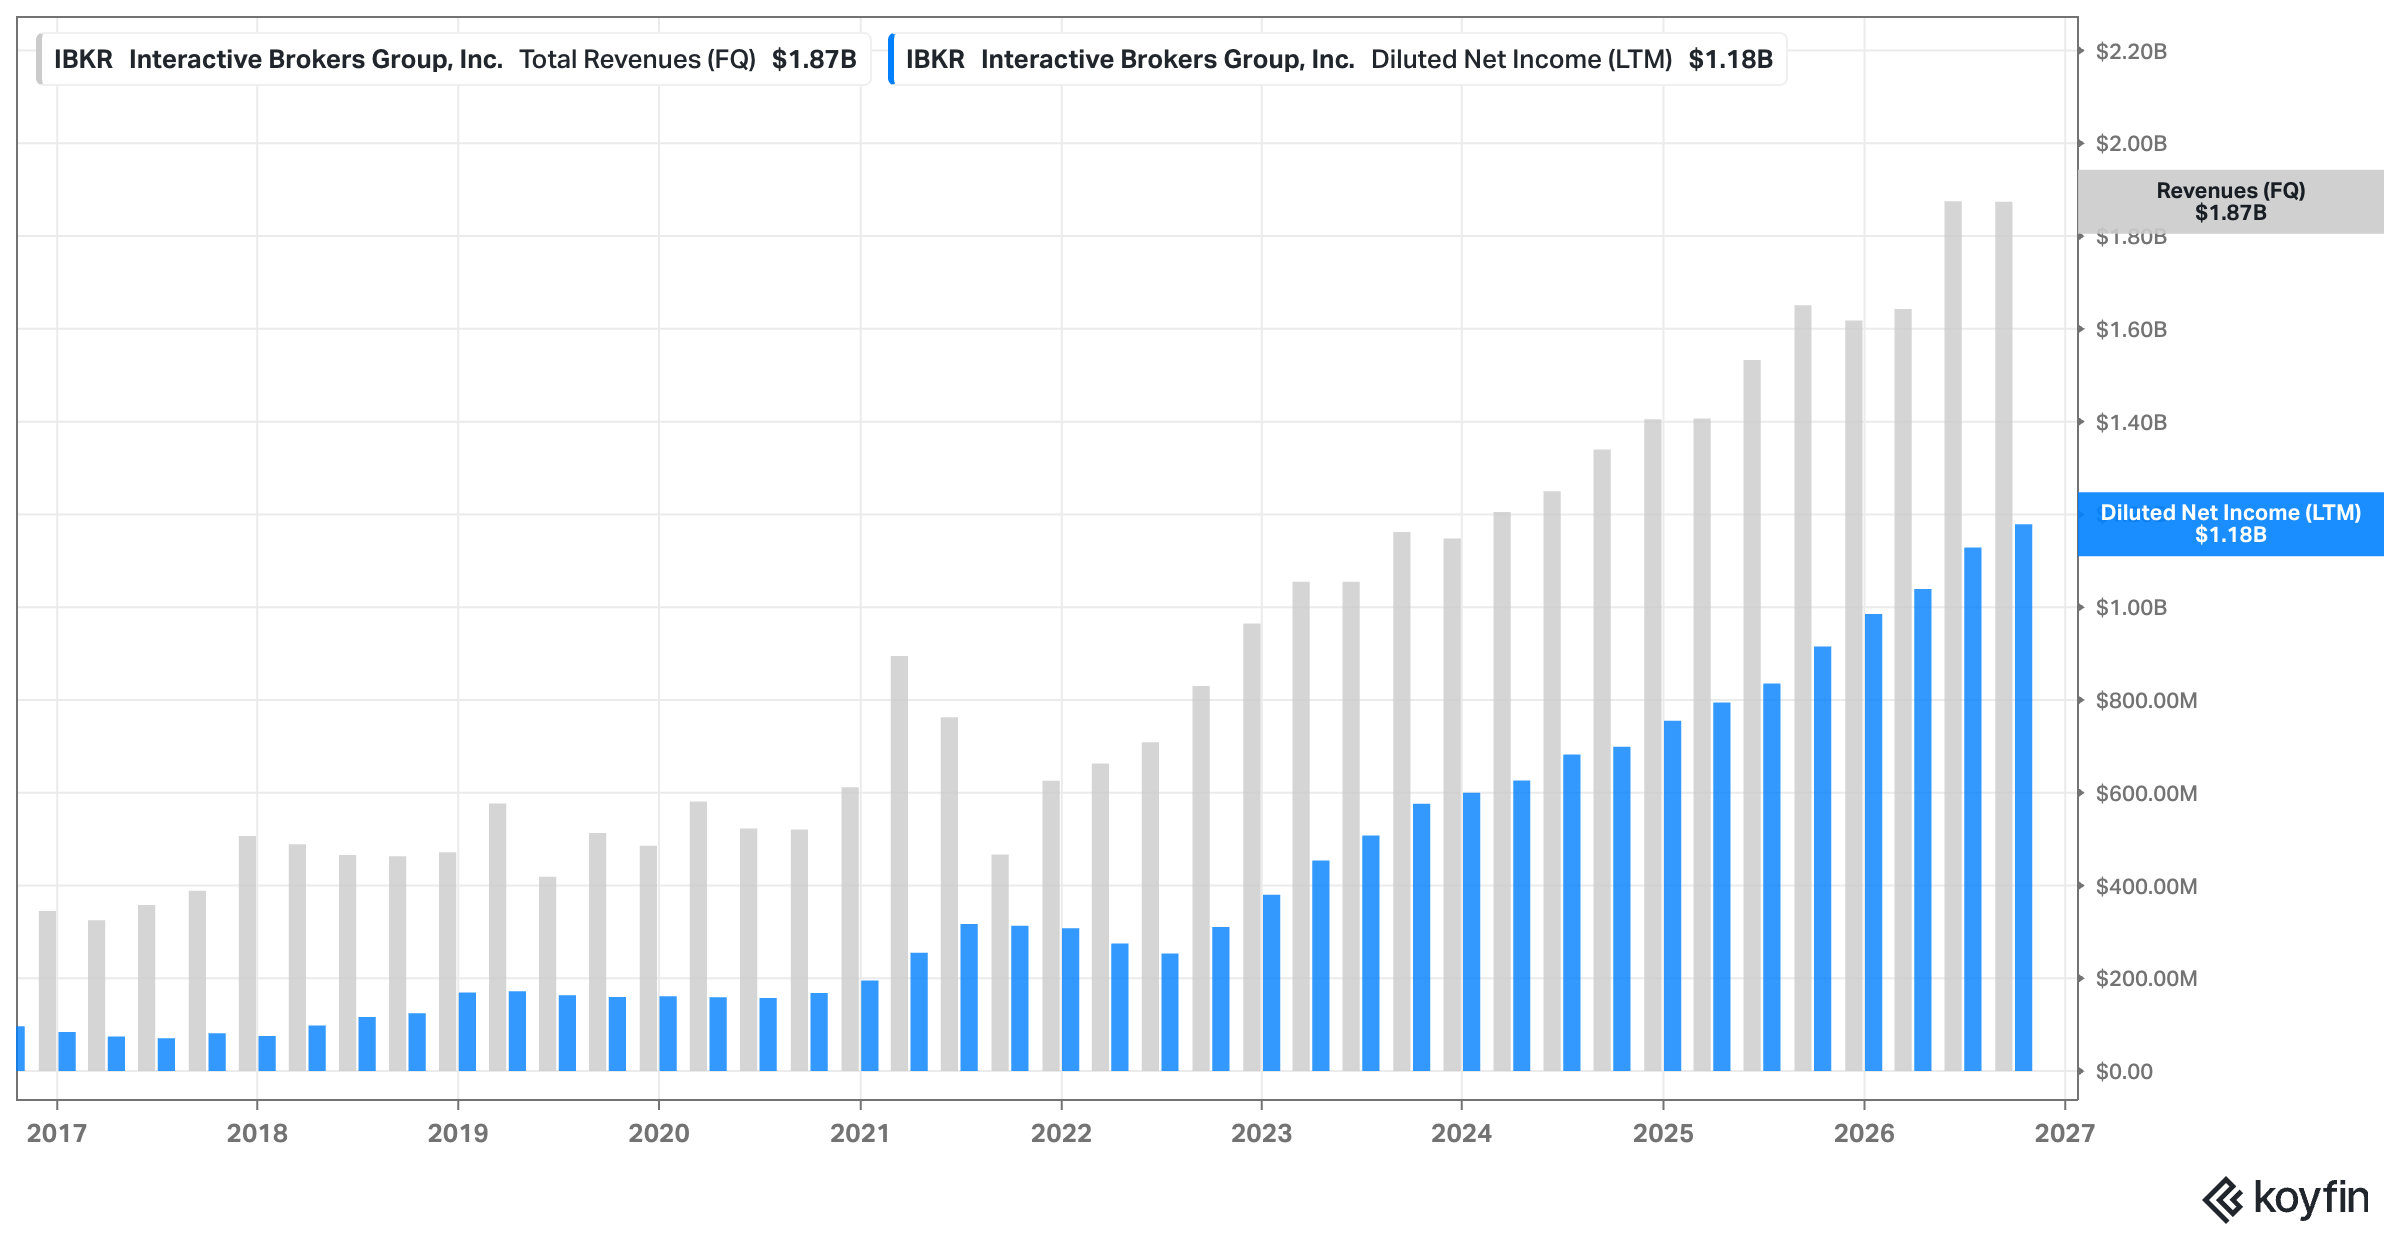
The pretax margin came in at 78%, a hair below the 79% of the year-ago quarter but the eighth consecutive quarter above 70%. Seventy percent!
GAAP diluted EPS grew 17% to $0.69. The board also raised the quarterly dividend from $0.0875 to $0.15, a 71% increase. At a share price of $81.35, that still translates into a yield of less than 1%. Nobody owns IBKR for the income.
The metrics that matter most to me over the long run looked like this:
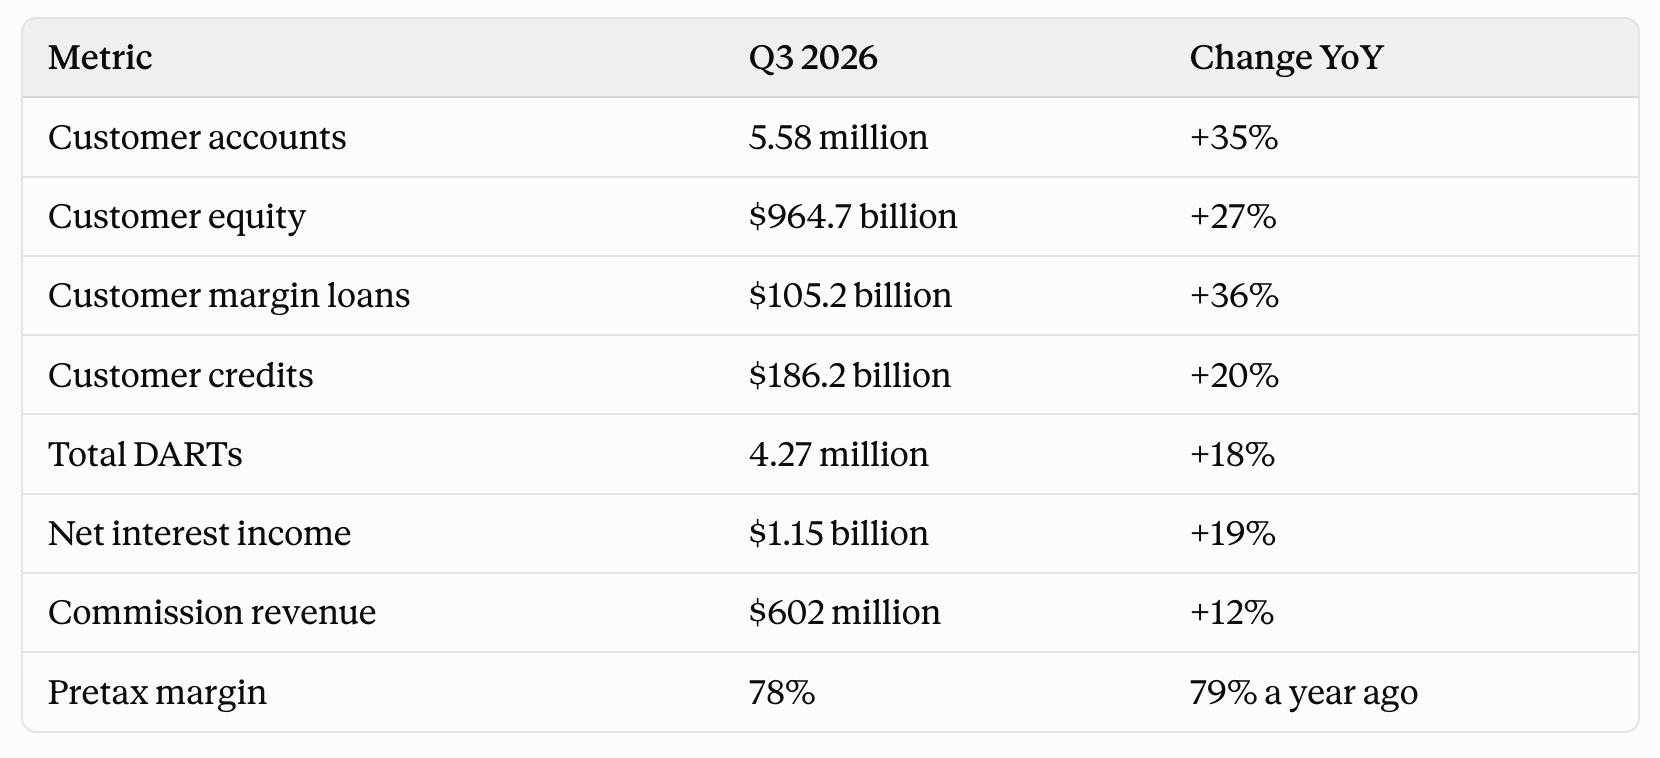
The account number deserves a moment of attention. IBKR added roughly 391,000 net new accounts in a single quarter, which is 8% sequential growth, at a time when existing clients were pulling back on trading.
IBKR has now posted eight consecutive quarters of >30% YoY account growth. Unbelievable!
Customer equity has been compounding north of 24% since April 2023, peaking north of 40% in 2024.
Margin loans crossed the $100 billion mark for the first time, and client credit balances reached $186 billion.
These balance sheet figures drive the business over a full cycle, and none of them shows any sign of fatigue.
It’s also worth keeping in mind how the revenue mix has shifted. Net interest income now makes up about 60% of net revenues, while commissions contribute just over 30%. That composition will matter a great deal later in this post.
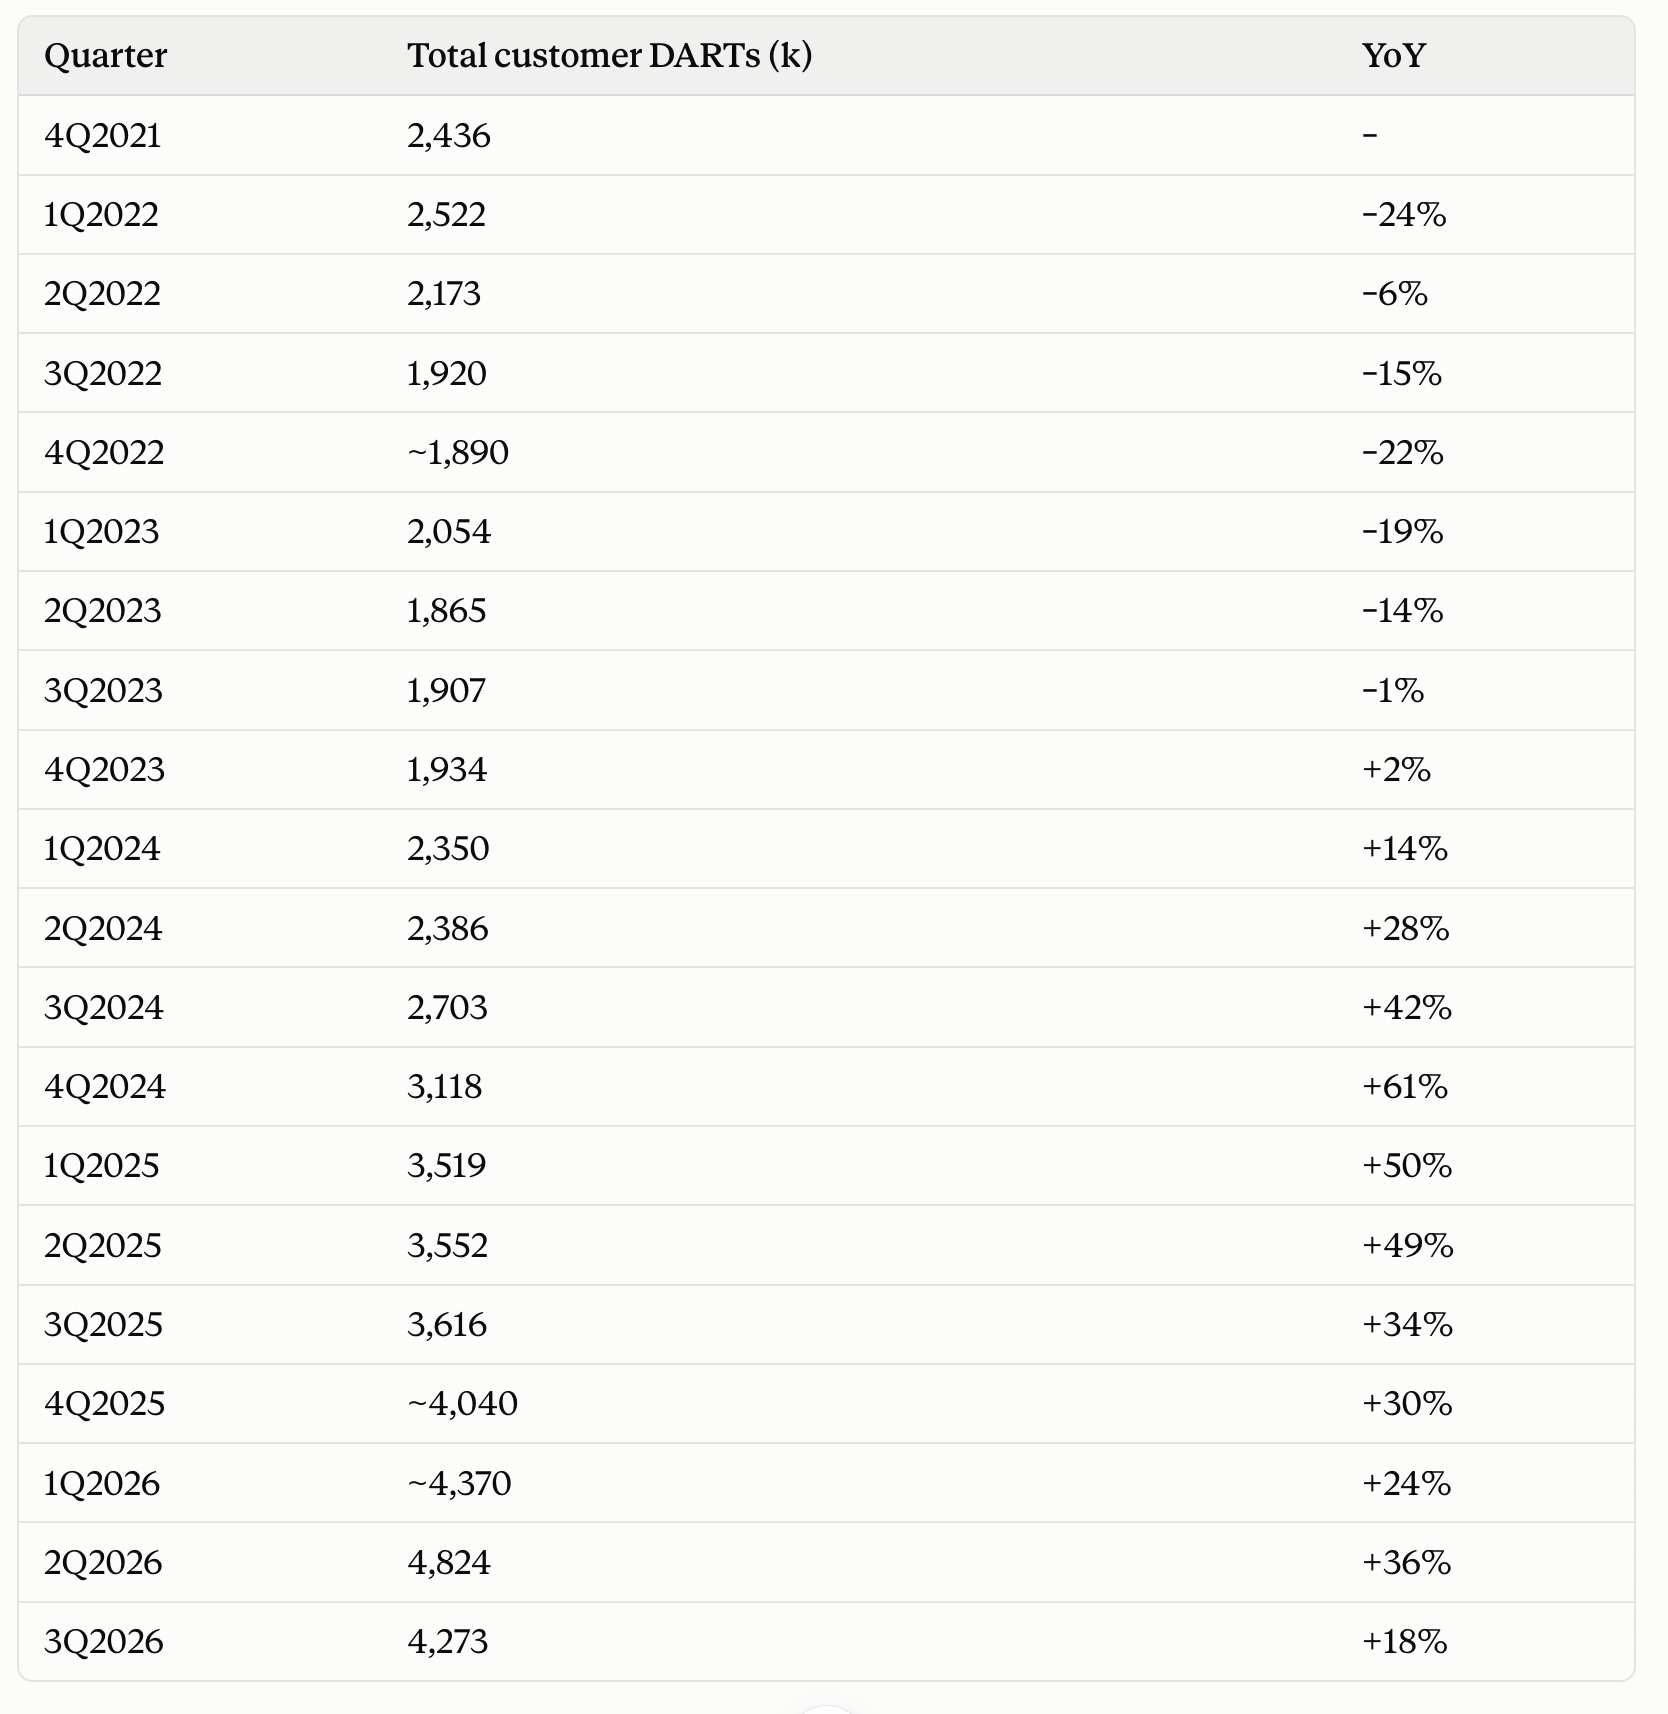
Now for the underbelly. Total DARTs (daily average revenue trades) fell 11% from the second quarter’s record of 4.82 million to 4.27 million.
More telling is activity per account. Cleared DARTs per account (annualized) dropped to 168, down from 207 in the second quarter and 195 a year ago.
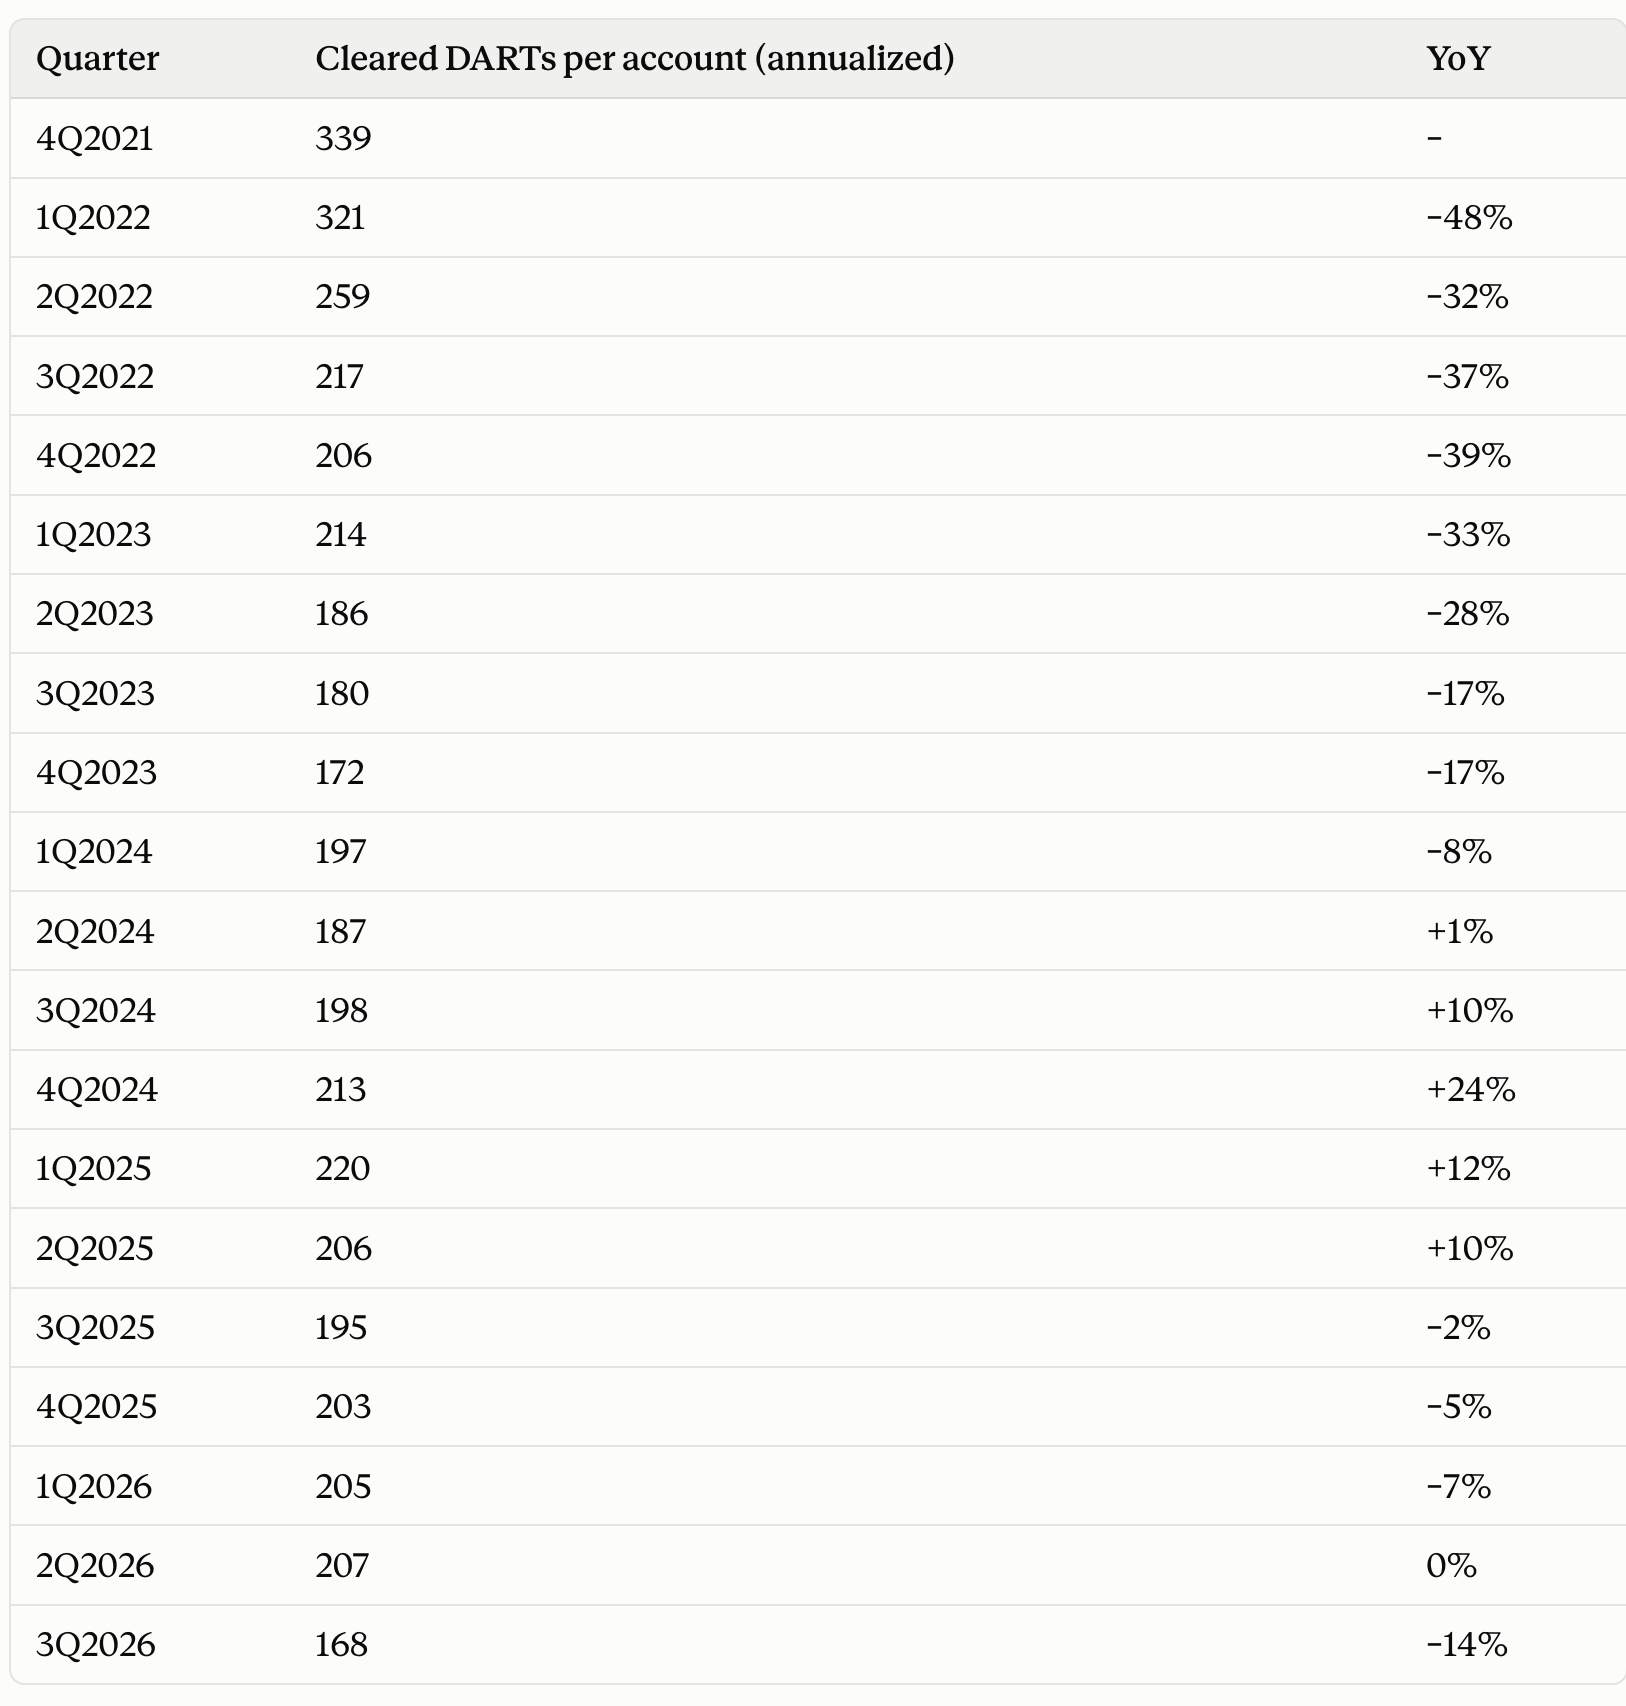
That’s the lowest reading in roughly five years, below even the 172 of the fourth quarter of 2023, when retail activity was in a slump.
The detail underneath is just as soft. Customer stock share volume fell 24% year over year and 17% sequentially. Options contracts were roughly flat (–1% year over year), and only futures held up with a 13% increase. Commission per cleared commissionable order slipped 4% to $2.59. Put differently, the 18% growth in total DARTs looks healthy only because the account base grew twice as fast. The average client traded noticeably less.
Commission revenue deserves a second look too. The 12% headline growth is flattered by higher regulatory fees, mainly from a higher SEC Section 31 transaction fee rate, which IBKR passes through to its clients. The same fees show up on the expense side, where execution, clearing and distribution fees jumped 46%, including a $30 million increase from regulatory fees alone. By my rough math, if you strip out that pass-through, underlying commission growth was closer to 7%. That’s still positive, but it is a far cry from the growth rates of 2025.
The pass-through also distorts the expense line, which grew 22% to $418 million and therefore slightly faster than revenue (up 15.7% to 16% YoY). That looks alarming at first glance, but excluding execution, clearing and distribution fees, operating expenses rose about 13%. Employee compensation was up just 7% while the account base grew 35%.
Few businesses in the world can grow their client base by a third with a single-digit increase in personnel costs, and it’s the clearest illustration of what four decades of automation (and a corporate culture built on it) can do to the underlying operating leverage dynamics.
None of this worries me much. Still, a critical reader should note that this quarter’s “strength” came almost entirely from the balance sheet – more accounts, more client cash, more margin lending – while the transactional engine sputtered.
That raises the question at the heart of this post:
What happens to a broker like IBKR when the party starts to wind down?
Late Innings, Narrow Breadth
I have said before that I believe we are in the later stages of this bull market, although I still think it may have legs for another two to three years.
I don’t pretend to know the timing. Calling tops is a reliable way to look foolish, and I have no intention of selling my holdings on a macro hunch.
That said, where I think we are in the cycle influences how I look at businesses with cyclical exposure, and few businesses are more exposed to investor sentiment than a broker.
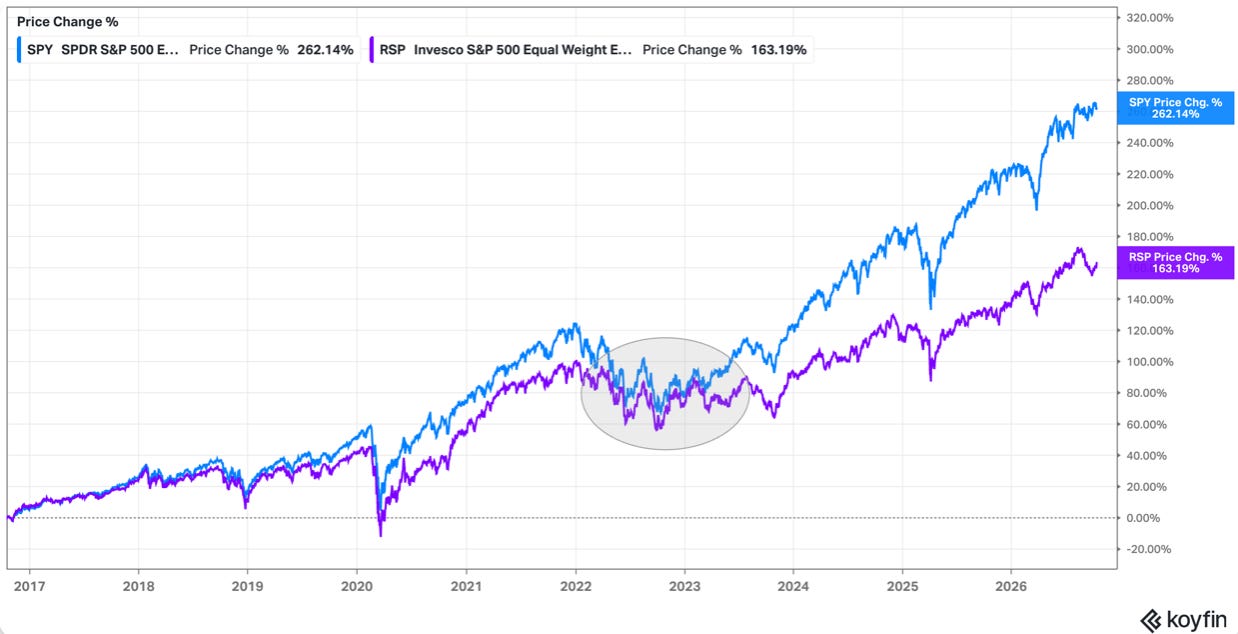
Late-cycle markets tend to follow a familiar pattern. Returns concentrate in fewer names, enthusiasm narrows around a single dominant theme, and trading activity spikes around headline events before it tapers off.
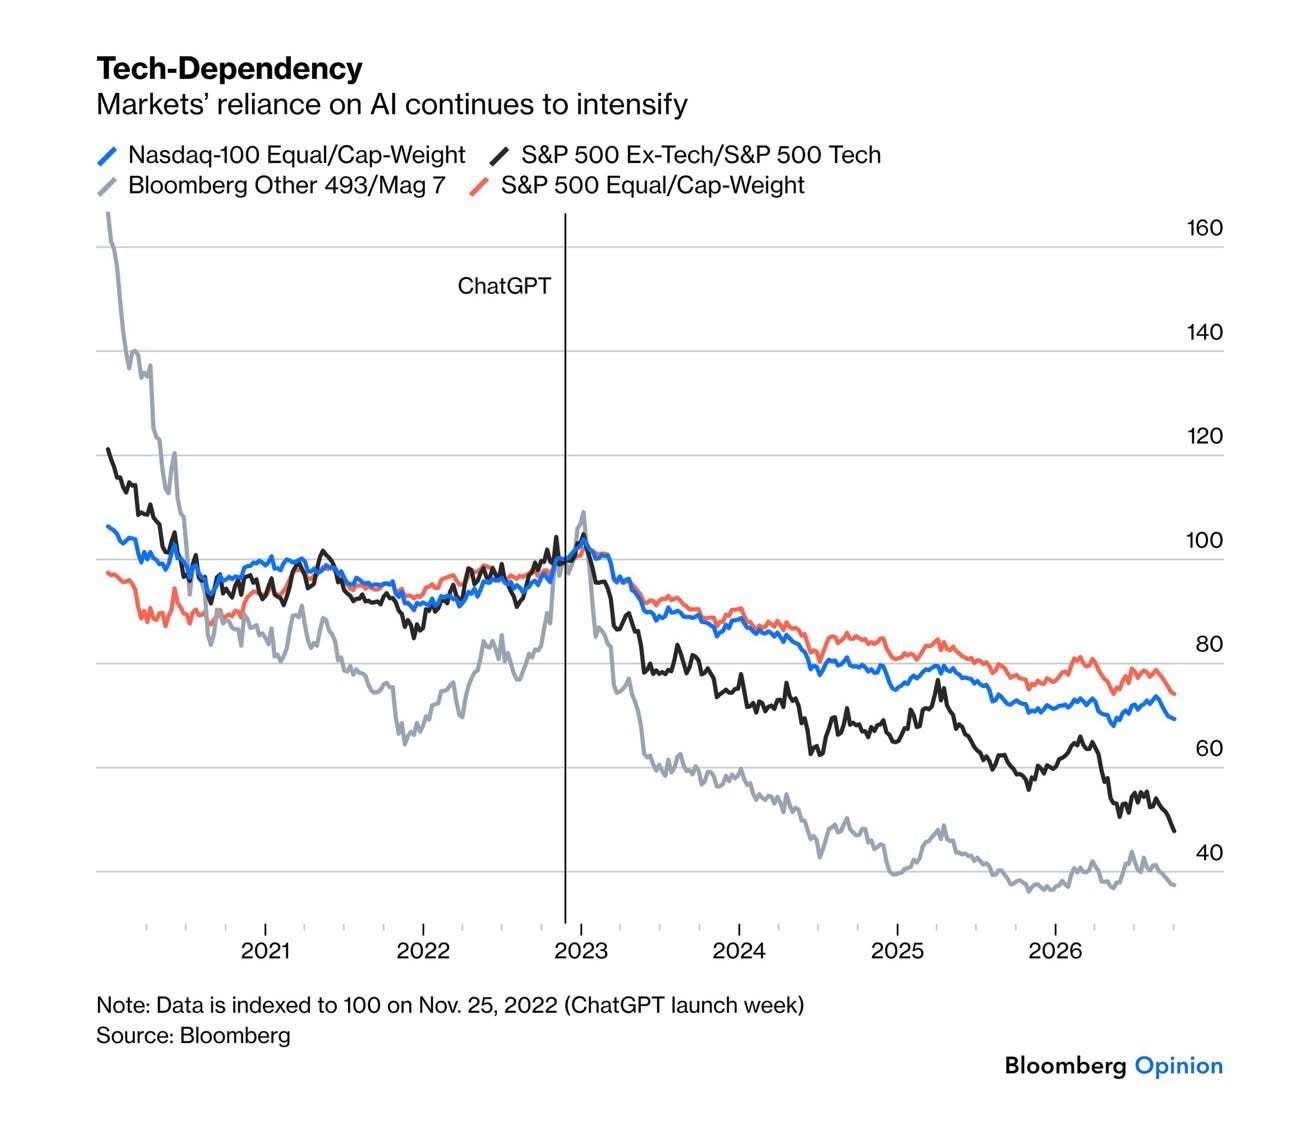
Management itself described exactly this pattern on the third quarter call:
“The S&P 500 was up 2% this quarter after rising nearly 15% last quarter, maintaining its resilience even as interest rates moved higher due to enthusiasm for both large technology companies and artificial intelligence. However, this performance masked somewhat narrow market breadth as large technology names represented the majority of the S&P 500’s gains this quarter. The 10 largest U.S. technology stocks now represent nearly 40% of the total value of the index, which has become more concentrated over the course of the year. The most actively traded names on our platform this quarter continued to be global technology names. Their growth and business traction appeal to investors around the world, who want the ability to invest directly and gain ownership in them and convert their currency inexpensively into USD to do so. Investors hold these stocks across accounts in hedge funds, in their personal accounts and in their retirement accounts.”
That 40% figure deserves a pause. At the peak of the dot-com bubble, the ten largest companies made up somewhere around a quarter of the S&P 500. Today the ten largest technology names alone account for close to 40%, and almost all of them are priced on the same AI narrative.
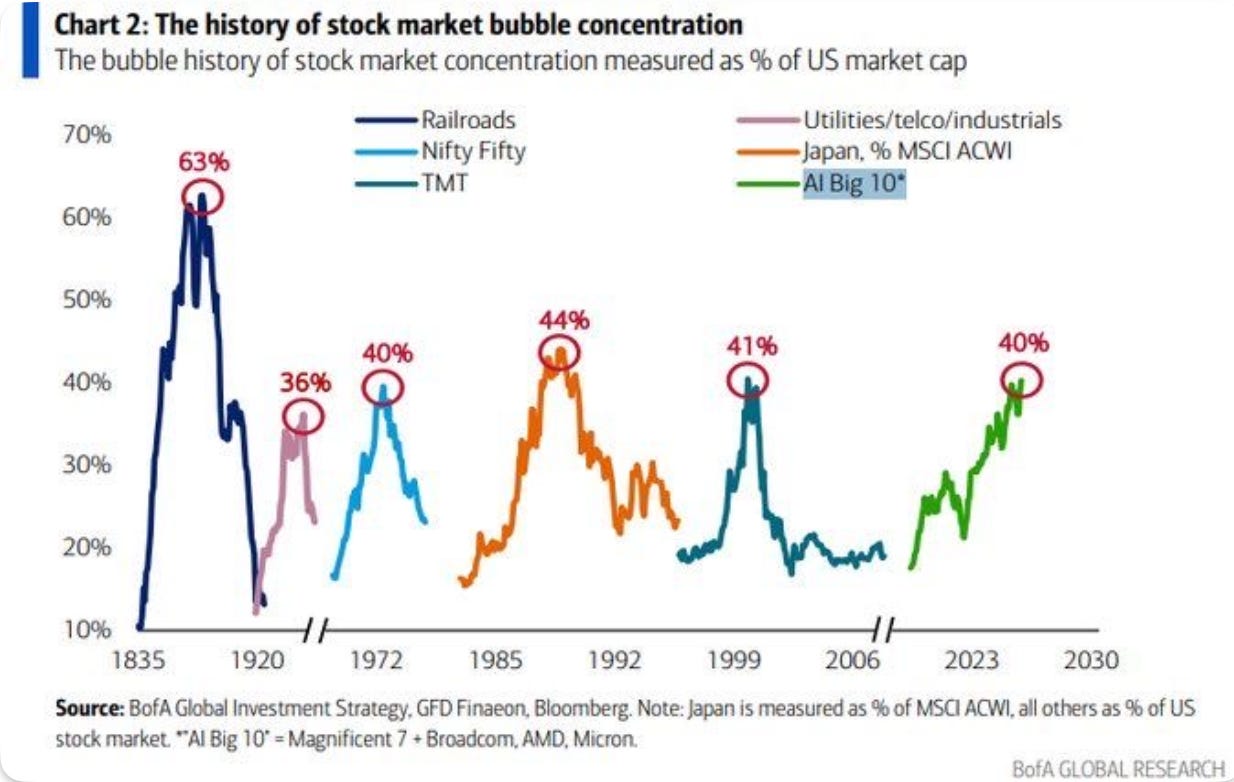
I don’t consider that alone a crash signal. Concentration can persist for years, and some of these companies are earning extraordinary profits to justify their weight. But it tells you how much of the index’s performance depends on a handful of businesses and one shared story.
When breadth is this narrow, the margin for disappointment shrinks.
Here’s the twist for IBKR shareholders. Interactive Brokers is effectively a toll collector on this concentration. Its most actively traded names are global technology stocks, and a large share of its clients sit outside the United States.
I remember Peterffy once revealed an astonishing figure. Back in Q4 2024, he said:
“So the Magnificent 7 is still the bulk of where most people’s dollars go, trading dollars. And the second may be crypto-related companies and the coins themselves. And thirdly, maybe the chip sector. But still the Magnificent 7 takes over 70% of the trading volumes.”
They pay to convert their currency into dollars, pay commissions to buy the shares, often borrow against them, and lend them out through IBKR’s securities lending program. When the theme is hot, every one of those revenue lines benefits at once. The second quarter was a vivid illustration.
The flip side is less comfortable. The same concentration that boosts activity also sits, indirectly, on IBKR’s balance sheet. Customer margin loans reached $105 billion, and while IBKR doesn’t disclose what collateralizes them, I would be surprised if a substantial portion weren’t made up of the very megacap tech names that dominate trading on the platform. If the AI trade unwinds abruptly, collateral values fall together, margin balances shrink, and trading activity likely drops at the same time. In other words, when IBKR’s clients are concentrated, its earnings are concentrated too.
I’m not losing sleep over this, and the main reason is IBKR’s risk management. The firm runs continuous, automated margining: when an account falls below its margin requirement, positions are liquidated automatically, with no margin calls and no grace periods. That approach frustrates some clients, but it explains why customer bad debt amounted to just $10 million over the first nine months of 2026 on a loan book of more than $100 billion.
It isn’t infallible, though. Automated liquidation works when prices move continuously, and it fails when they gap. In January 2015, when the Swiss National Bank abruptly abandoned its cap on the franc, currency prices jumped so violently that IBKR couldn’t liquidate client positions in time and absorbed a loss of roughly $120 million.
A sudden, gapping sell-off in the most crowded stocks on the platform is the scenario I’d watch for, and the fact that margin loans have grown faster than customer equity over the past year, a point I’ll return to later, doesn’t make that tail risk any smaller.
With all that in mind, and as the owner of two publicly traded brokers, I find it useful to think through what a cooling phase actually means for a business like this. Two considerations keep resurfacing for me.
The first concerns the way IBKR’s income statement is structured, and it’s a feature I believe most investors underappreciate.
The second concerns how you should think about trading activity as a long-term shareholder, and which of the past year’s tailwinds are likely to outlast the cycle.
Point One: Embedded Hedging
The first point is that brokers are internally hedged to a degree most investors underappreciate. Higher interest rates usually dampen speculative appetite, which hurts commissions.
Yet the same higher rates lift the interest a broker earns on client cash.
“In a bull case, investors stand to benefit if interest rates stay elevated for the next few years. In a bear case, investors will not lose if rates are cut to zero. There is a natural hedge built into the set-up where higher rates equate to higher earnings through improved net interest margin and lower rates equate to valuation support and an improvement in trading activity. Either way, Interactive Brokers will likely come out ahead.“ - LVS Advisory in 2023
To be fair, interest on margin loans also tends to drop in a bear market, as clients deleverage. Still, the two revenue streams tend to move in opposite directions often enough to smooth the overall earnings line.
2022 is the textbook case. In the fourth quarter of that year, Interactive Brokers’ net interest income jumped 92% to $565 million on higher benchmark rates and client credit balances, while total DARTs fell 22% to 1.89 million. The hedge worked even though customer margin loans shrank 29% to $38.9 billion as clients cut their leverage during the bear market. Client credit balances, meanwhile, grew 9%. Commission revenue barely moved (+3%), net revenues rose by roughly 60%, and the pretax margin expanded from 62% to 71%.
A punishing year for traders turned out to be one of the best years in the company’s history.
More context: In Q4 2021 the Fed funds rate sat near zero. By Q4 2022 it was around 4%. Interactive Brokers earns interest in two places: on the margin loans it makes to clients, and on the client cash it holds and invests, mostly in short-term government securities. When the benchmark rate goes from roughly zero to roughly four, the yield on both pools rises sharply, and that effect overwhelms a change in volume.
The mechanism also works in reverse. In the second quarter of 2020, with the Fed having slashed rates to zero, net interest income fell 24% year over year. Yet DARTs more than doubled (+111%) as locked-down retail investors flooded into the market, and commissions rose 55%. One leg went down, the other went up.
We may now be heading into a setup that resembles 2022 more than 2020. On September 16, the Fed raised rates by 25 basis points to a range of 3.75% to 4.00%, its first hike since July 2023, citing stubborn inflation driven in part by an oil price shock. Shortly afterward, the 10-year Treasury yield climbed above 5.2%, its highest level since 2007. Management addressed the effect on the call:
“Several central banks raised rates in September, providing a minor tailwind to net interest income in the third quarter and further benefit going forward. Together, these factors drove a rise in interest income on margin loans and customer segregated cash, partially offset by higher interest expense on customer cash balances.”
Reading the fine print to understand the underlying dynamic
When I first looked at IBKR a few years ago, I initially struggled a little with fully comprehending the mechanics behind this (how interest rate changes impact IBKR’s interest income).
“Interactive Brokers continues to set the benchmark for cost efficiency, offering margin rates and high yields on idle cash that consistently outperform the competition. For the active trader, these are not just perks — they are material contributors to the bottom line.” - StockBrokers.com, May 04, 2026
Interactive Brokers pays IBKR Pro clients the benchmark rate minus 50 basis points on their cash (IBKR Lite clients receive the benchmark minus 1.5%).
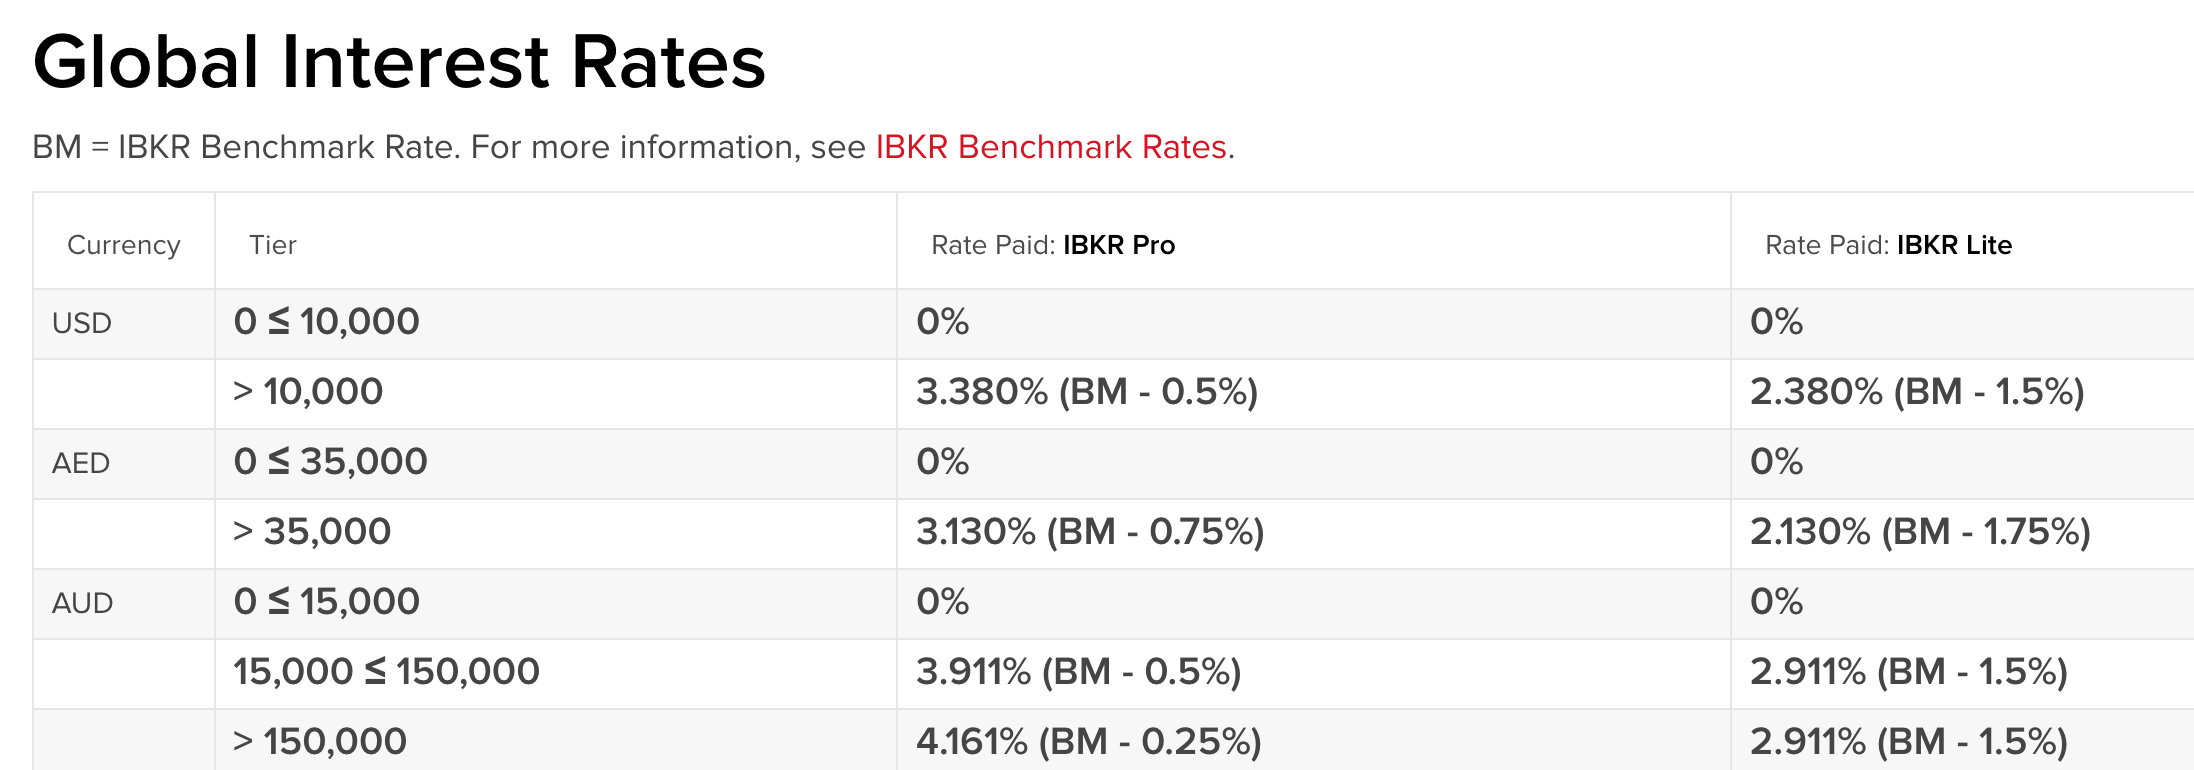
So, intuitively, I assumed the spread, and with it the interest income, should stay roughly/exactly the same whatever the level of rates. After all, the spread is fixed, right?
That intuition is wrong, and the reason sits in the fine print. Only accounts with a net asset value of $100,000 or more get the full rate. Smaller accounts receive a proportionally reduced rate, and the first $10,000 of cash earns nothing at all.
Take an account worth $60,000 with $20,000 in cash. At a 4% benchmark, Interactive Brokers earns $800 a year on that cash. It pays the client 60% of 3.5% on the $10,000 above the threshold, which comes to $210. It keeps $590, an effective spread of almost 3%. At a 1% benchmark, the broker earns $200, pays $30 and keeps $170, an effective spread of 0.85%.
The 50 basis point haircut turns out to be a small part of the economics. Most of the earnings come from cash on which the broker pays nothing or very little, and that portion earns the full benchmark rate.
Below a benchmark of 0.5%, the client rate floors at zero, and the spread shrinks to whatever the market rate is.
Here is another example. Assume a $100,000 account sits entirely in cash, so it qualifies for the full rate (!), and IBKR invests all of it at the benchmark. The client earns nothing on the first $10,000 and the benchmark minus 0.5% on the remaining $90,000.
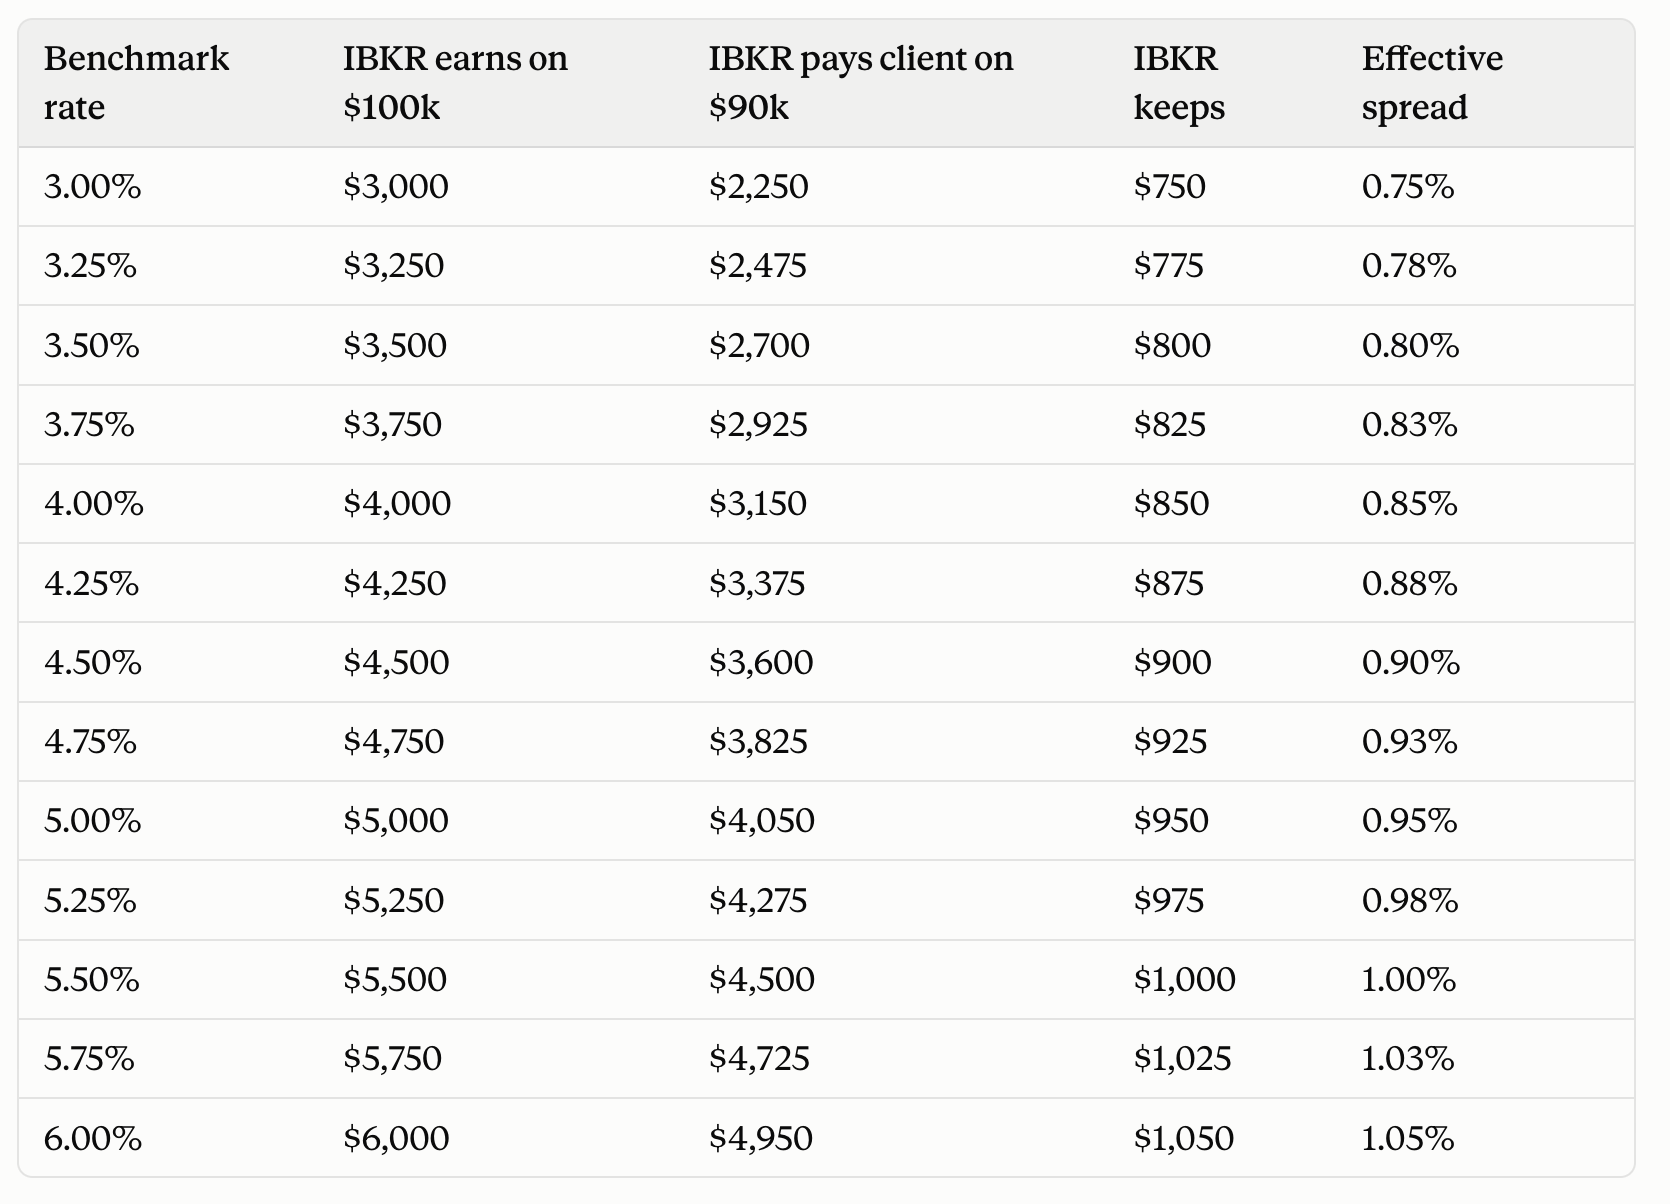
IBKR’s take splits into two pieces. On the $90,000 that earns interest, IBKR keeps exactly 0.5%, a constant $450 regardless of where rates are. On the first $10,000, it pays the client nothing and keeps the entire benchmark rate, so that slice earns $300 at 3% and $600 at 6%. Every 25 basis point move therefore adds or subtracts $25 a year. Going from 3% to 6% lifts IBKR’s income on this account by 40%, from $750 to $1,050, even though the quoted spread never changed.
This account is actually the least rate-sensitive kind, because nearly all its cash earns the near-full rate.
The effect gets much larger in smaller accounts. Take a $50,000 account held entirely in cash. It receives only half the client rate on the $40,000 above the threshold. At a 3% benchmark, IBKR earns $1,500, pays $500 and keeps $1,000. At 6%, it earns $3,000, pays $1,100 and keeps $1,900, so its take nearly doubles. Multiply that by the millions of accounts below $100,000 and you get a sense of why the firm’s net interest income moves so much with rates.
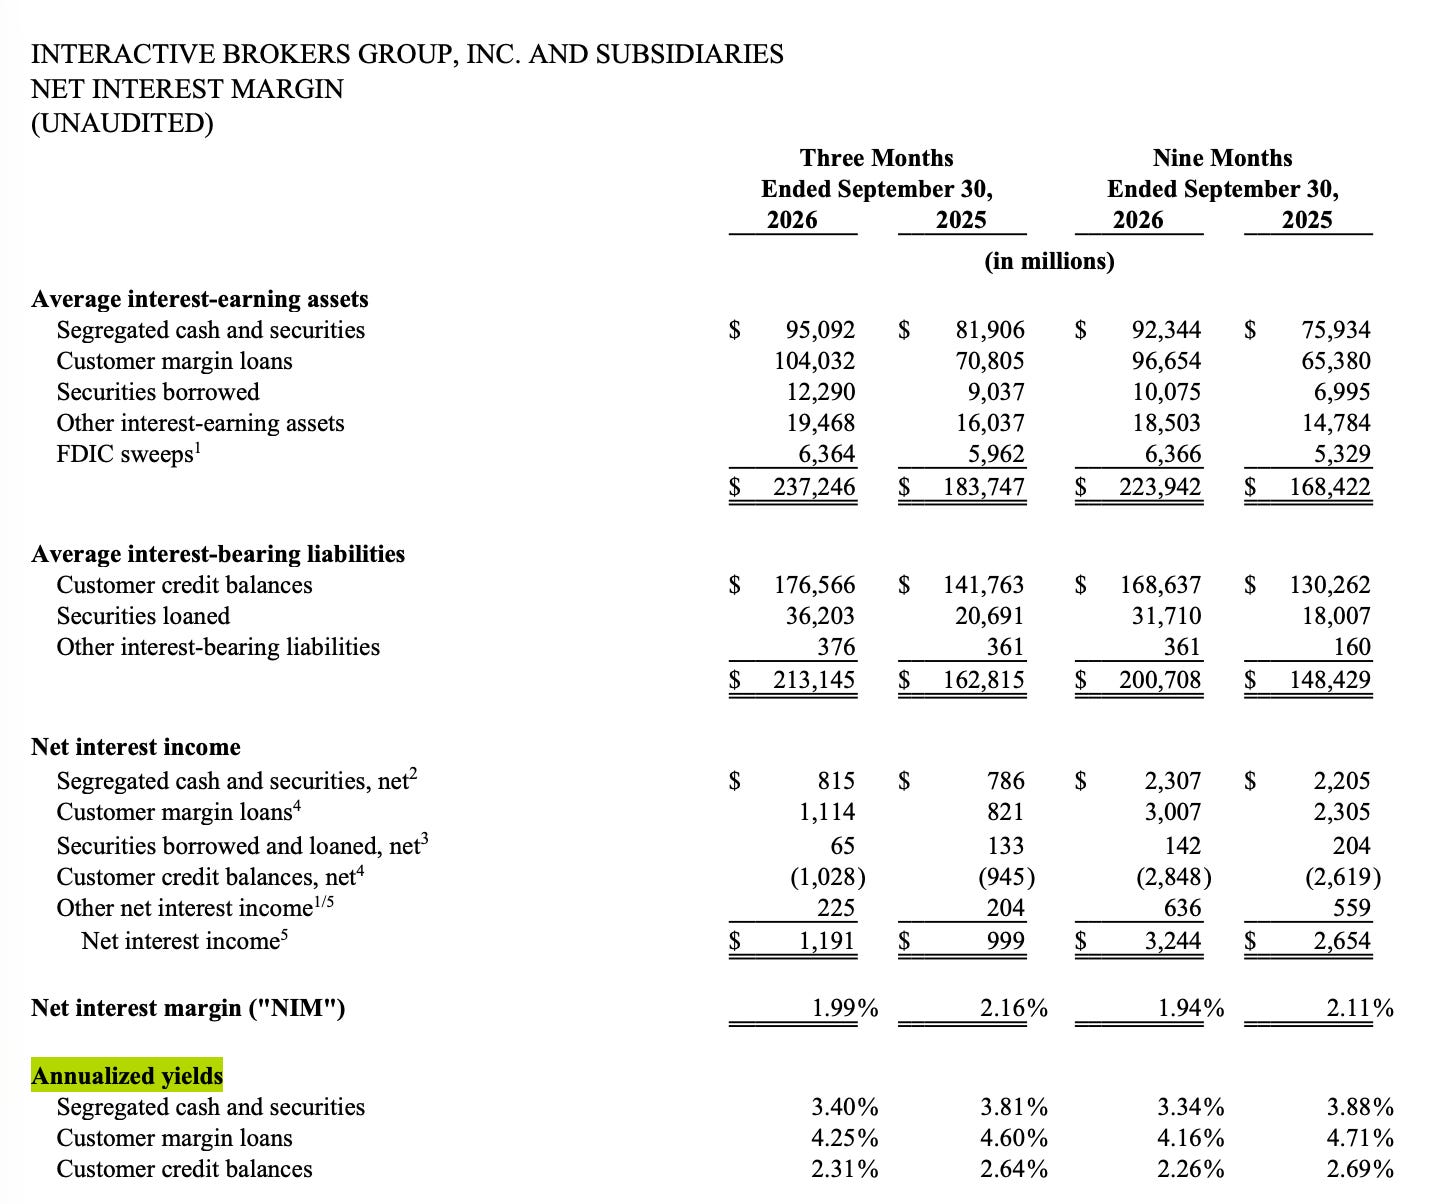
You can actually see this in the reported numbers. In the third quarter, IBKR paid an average annualized rate of 2.31% on customer credit balances (see screenshot below), at a time when the U.S. benchmark averaged roughly 3.6% to 3.7% (my own estimate derived it from the Fed’s path during the quarter). Part of that gap reflects lower rates on non-dollar balances. A good part of it, though, is the $10,000 threshold and the proportional rule doing their work across 5.6 million accounts.
My friend Andrew Letendre raised a few more useful points on the interest income subject when we discussed this this week.
The first is that while the zero-interest $10,000 slice looks small for any individual account, it adds up across millions of them. We mentioned this above already.
The second is that IBKR holds a substantial amount of its own capital on the balance sheet, and that capital earns the full benchmark rate too with no client to share it with. That part is easy to forget.
The third is behavioral: as rates climb, he assumes clients tend to move into cash (as the risk-free rate rises and becomes more attractive) faster than they reduce margin borrowing.
Interestingly, the current cycle doesn’t fit that last point neatly. Not yet. Over the past year, margin loans grew 36% while credit balances grew 20%. Clients are borrowing more aggressively than they are hoarding cash, even as rates rose in September. That’s good for net interest income today, since margin loans yielded 4.25% this quarter. It’s also a sign of late-cycle risk appetite, which I flagged in the previous section.
Management quantifies the overall sensitivity on every call:
“We estimate the effect of a 25 basis point increase or decrease in the benchmark fed funds rate to be $83 million higher or lower, respectively, in annual net interest income. Note that our starting point for this estimate is September 30, with the fed funds effective rate at 3.88% and balances as of that date. Any growth in our balance sheet and interest-earning assets would increase these impacts. About 30% of our customer interest-sensitive balances is not in U.S. dollars, so estimates of a U.S. rate change exclude those currencies. We estimate the effect of a 25 basis point increase or decrease in all the relevant non-U.S. Benchmark rates would increase or decrease annual net interest income, respectively, by $35 million.”
It’s worth putting those figures into perspective, because I think the hedge is often overstated. A 25 basis point move in the Fed funds rate shifts annual net interest income by about $83 million. Even if every other relevant central bank moved by the same amount at the same time, the total effect would be around $118 million.
Management gave two separate sensitivities in that call quote:
$83 million for a 25 basis point move in the U.S. Fed funds rate only.
$35 million for a 25 basis point move in all the relevant non-U.S. benchmark rates.
Annualized, the third quarter puts net interest income at roughly $4.6 billion and pretax income at about $6 billion. A full 100 basis points of Fed cuts would therefore cost IBKR around $330 million a year, a little over 5% of pretax income. Even in the extreme case where all major central banks cut by 100 basis points together, the hit would be around $470 million, less than 8% of pretax income. That hurts, but it’s no disaster.
The more important lesson here is that balance growth swamps rate moves. Over the past year, the average Fed funds rate fell 63 basis points, or 15%. Yet IBKR’s margin loan interest rose 36%, and its segregated cash interest rose 4%, both carried by higher balances.
Rates set the weather. Account and balance growth determine the climate.
The quality of this income stream also deserves emphasis:
“The average duration of our investment portfolio remained at less than 30 days. Because of the timing of the Fed rate hikes in mid-September, most of their impact will be realized in the fourth quarter. The U.S. dollar yield curve is generally positive in the short to medium term, and we have responded by pushing our duration out a bit while still maintaining a relatively tight maturity match between our assets and liabilities.”
A portfolio duration of less than 30 days means two things.
First, rate hikes flow through to earnings almost immediately, which is why the fourth quarter should show a clearer benefit from September’s move than the third did.
Second, IBKR is not taking the bet that sank several banks in 2023 and caused headaches at Charles Schwab. That bet was locking client cash into long-dated bonds that lose value when rates rise, while clients move their cash elsewhere in search of better yields. IBKR’s interest income is essentially overnight money matched against overnight liabilities. It’s about as low-risk as interest income gets. The slight extension in duration that management mentioned is worth monitoring, but it doesn’t change that picture.
Some caveats are in order. Net interest margin fell to 1.99% from 2.16% a year ago, as yields on segregated cash (3.40% vs. 3.81%) and margin loans (4.25% vs. 4.60%) declined faster than the rate paid on client credits (2.31% vs. 2.64%). That’s the lagged effect of the rate cuts in late 2025, and September’s hike should start to reverse it.
Securities lending looks weaker at first glance too. Reported net interest from securities lending fell to $65 million from $133 million, against an unusually strong prior-year quarter with several very popular hard-to-borrow names. Management argues the reported figure misses most of the economics, and the release backs that up. Including the interest earned on the cash collateral tied to these transactions, total securities lending net interest rose to $427 million from $314 million, a 36% increase.
The more important caveat concerns where the hedge breaks down. It works well ..
when rates rise and trading cools (2022), and
when rates collapse and trading booms (2020).
The painful scenario is the one where both legs fall at once. Picture a sharp, recessionary sell-off that forces central banks into emergency cuts while a burned-out retail crowd stops trading and pays down margin. In that world, commissions, margin balances, and the spread on client cash would all shrink together.
That scenario isn’t my base case, but a shareholder should know that the hedge is partial and works best in the environments we’ve seen more recently.
Who Else Wins If Rates Stay Higher for Longer?
All of this got me thinking about a broader question, which I also posed on X the other day:
“Which companies benefit from a higher rates for longer environment?
Brokerage businesses like $IBKR benefit by higher interest income (which typically hedges against lower trading activity as rates rise). Every 25bps increase contributes $83m in income as of yesterday’s call. Companies sitting on a lot of cash, especially relative to market cap, benefit too – $TIGR as one of my portfolio companies comes to mind. $NTDOY too. Businesses benefitting from float of course come to mind too. Edenred $EDEN is one candidate.”
The logic is simple enough. Any business that holds money it doesn’t pay much for, whether it's its own cash or other people’s, earns more when rates rise. Tiger Brokers fits the cash-rich half of that description, and Nintendo does too, with a cash pile that makes up a meaningful share of its market value. Edenred benefits from float, since companies prefund their meal and benefit vouchers well before the merchants are paid (Edenred reported earnings this morning by the way in case you are interested). ADP and Paychex are classic examples of the same mechanism, since both earn interest on client payroll funds before they’re paid out. Insurers and clearing houses like CME, which hold large amounts of collateral, belong in this conversation as well.
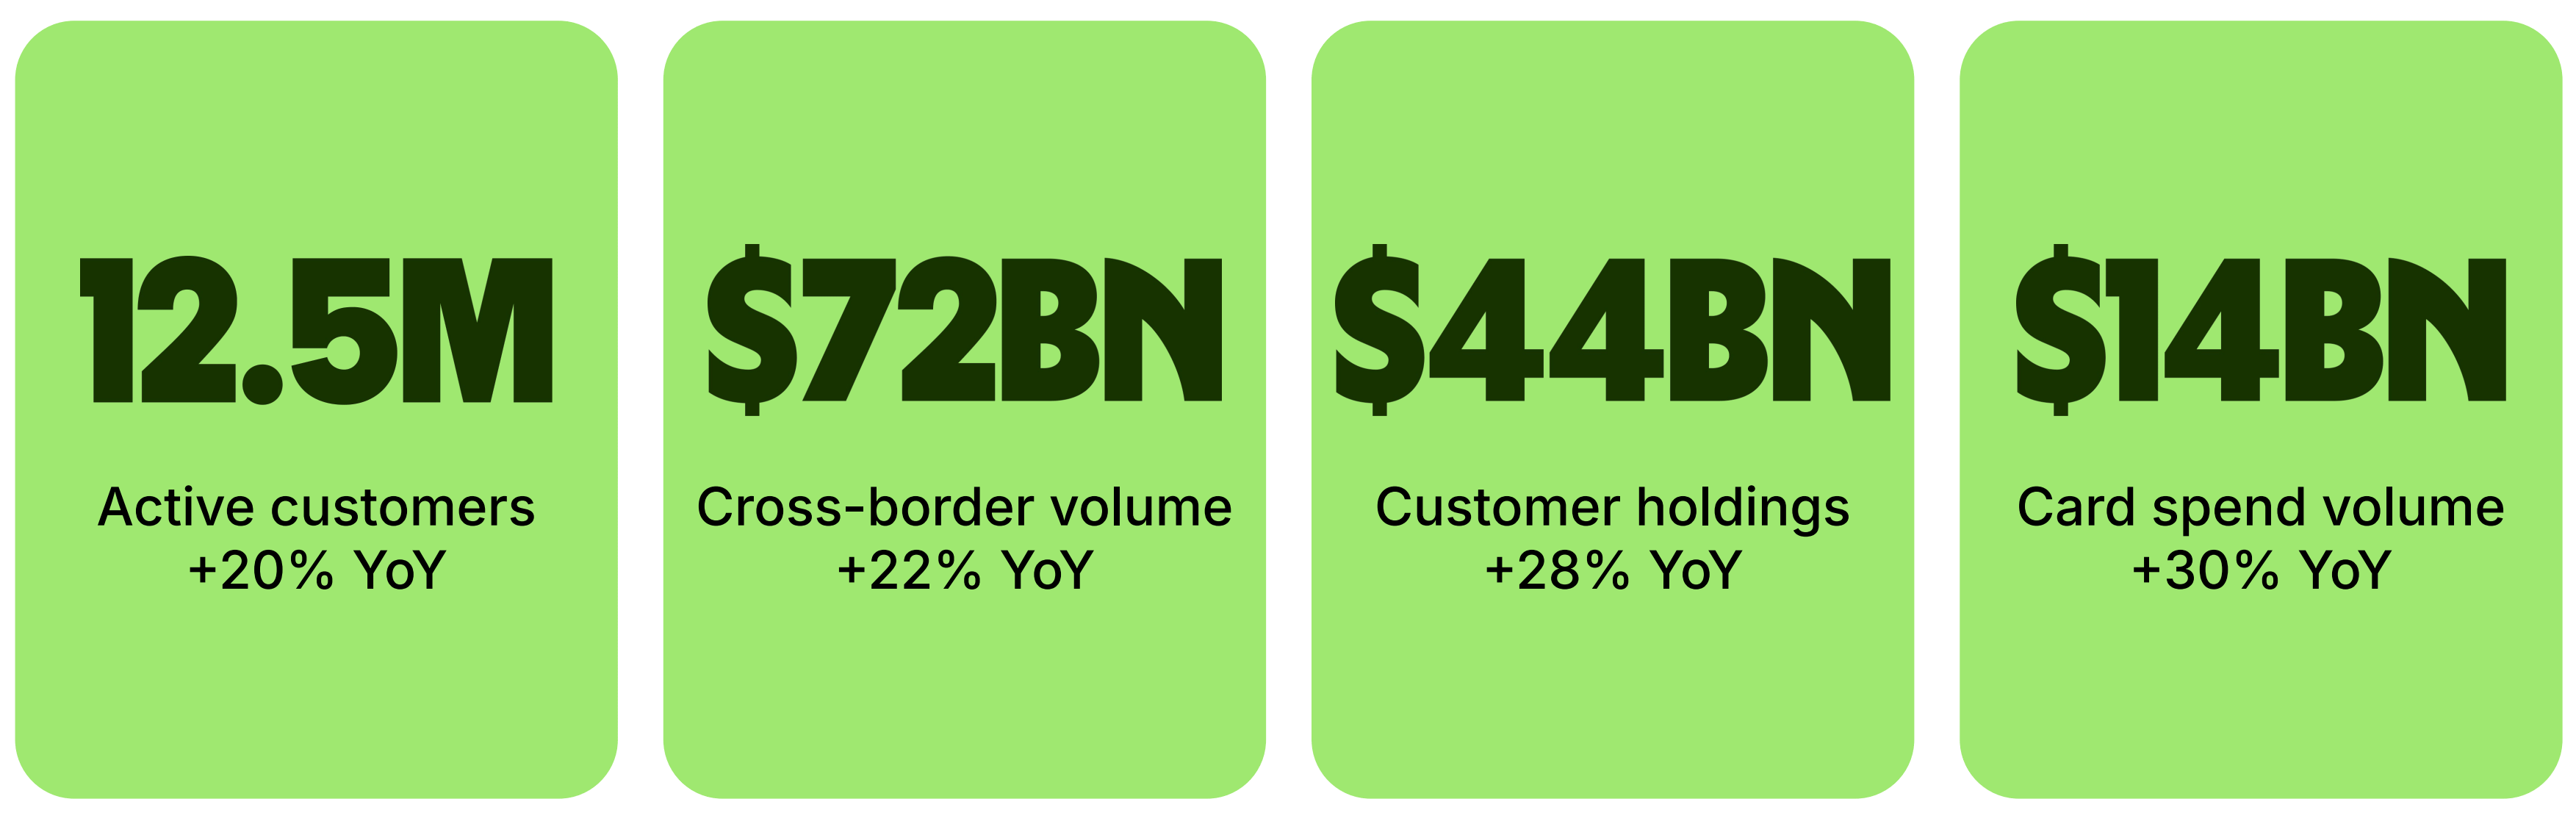
Wise belongs in the same bucket, though with a twist that’s easy to miss. Customers held $44 billion with Wise at the end of June, up 31% year over year. Its policy is to keep the full yield on the first 1% and only 20% of interest income above that, returning the rest to customers. That self-imposed cap makes Wise a more modest beneficiary than the headline balances suggest. At least, in theory. In practice, Wise hasn’t yet been able to pay out most of that excess, which is why it guides to a pretax margin at the top of a 20% to 25% range, above its medium-term target of 15% to 20%. Higher for longer simply keeps that cushion in place for longer, and allows Wise to earn more of its market cap back in interest income before it is legally allowed to implement its long-term policy.
Before you rush out to build a “higher for longer” basket, a few caveats. First, the phrase means different things in different currencies. The Fed has just hiked. But Nintendo’s cash earns yen rates, Edenred’s float is, at least partly, tied to euro and Brazilian real rates (I’d have to check the exact breakout). A Fed hike does little for a company whose float sits in euros if the ECB stays put. Second, interest income is in some regard a low-quality profit stream, because management has no control over it. Sure it’s incredibly high margin, but if a company’s earnings growth comes mostly from its treasury desk, I’d value that portion at a much lower multiple than earnings from a firm’s growing core operations. Third, and most importantly, higher for longer is a headwind for valuations generally.
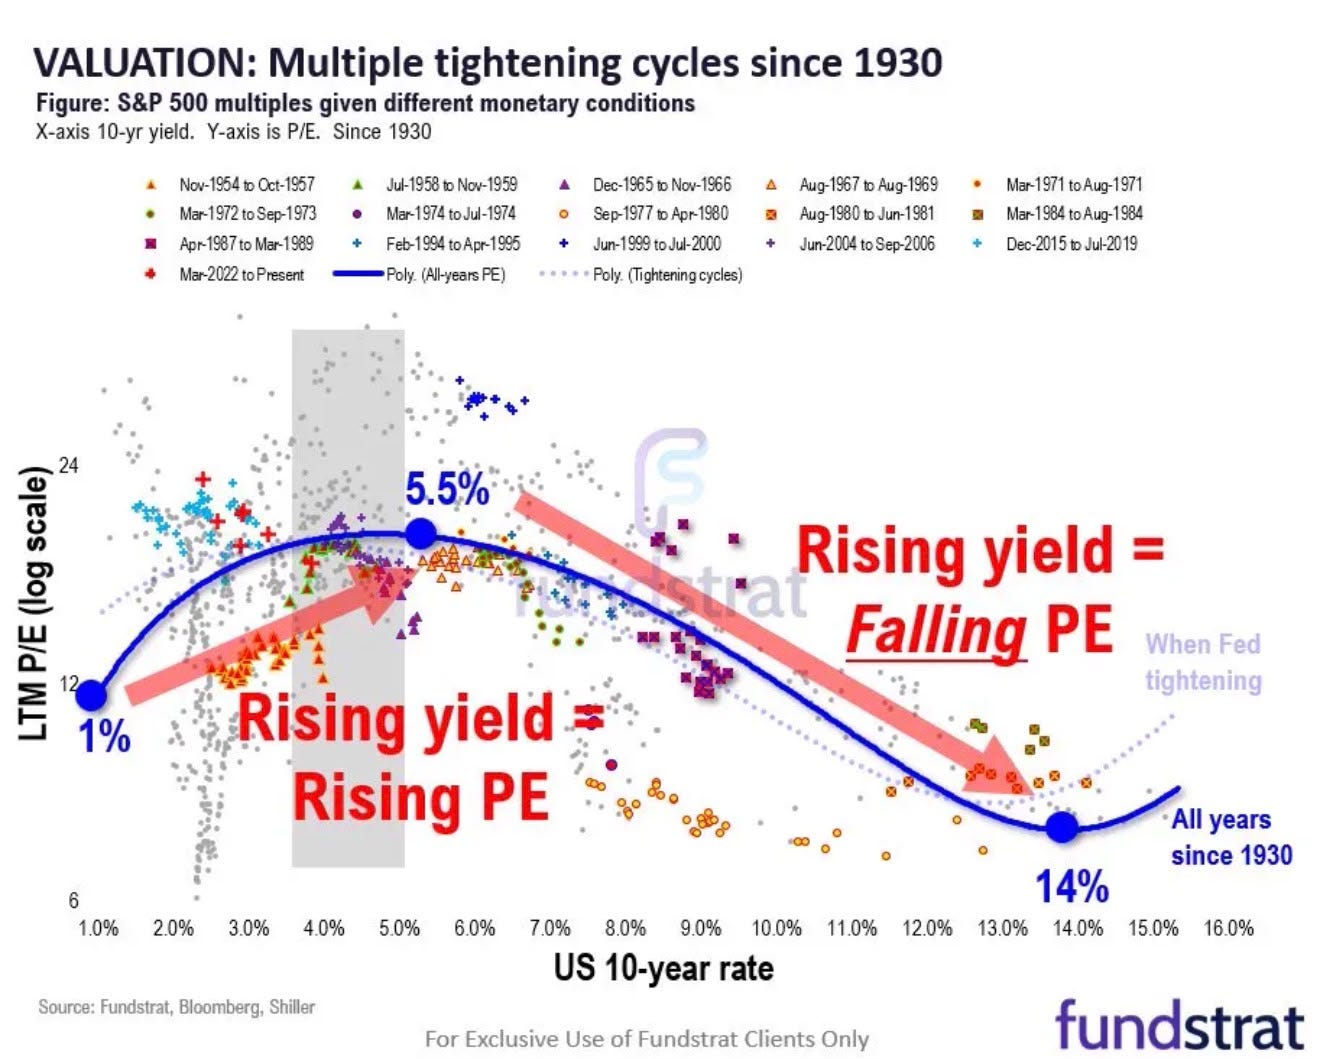
Long-duration compounders, a category that includes IBKR at more than 30 times earnings, are especially sensitive to higher discount rates. A business can earn more on its cash and still see its share price fall, simply because the market applies a higher discount rate to its future cash flows. And for some of these names, regulation matters more than rates. Brazil’s overhaul of its meal voucher program in late 2025 was a far bigger issue for Edenred than any move by the Fed.
I’m curious which other candidates you would add to the list. Feel free to share them in the comments.
Was the First Half of 2026 Ever Sustainable?
The second consideration is one every long-term shareholder of a broker has to accept: trading activity is deeply cyclical. To me, the first half of this year never felt sustainable. The euphoria was palpable. Investors chased anything related to AI and semiconductors, particularly among the megacap tech names, and the IPO window swung wide open.
The defining moment of 2026 came in June. SpaceX went public on June 12, raising $75 billion at a valuation of about $1.77 trillion, the largest IPO in history. Within three trading days, it had overtaken Amazon in market value. The trading frenzy around it was hard to believe, even by the standards of recent years. One report at the time put it like this:
“On Friday, its first day on the market, SpaceX saw $85 billion dollars worth of shares trade hands. Nearly $46 billion of shares traded on Monday, followed by almost $68 billion on Tuesday, averaging out to $66 billion in the first 3 days.
That’s more trading than what took place in popular exchange-traded funds Q and SPY, which averaged $33 billion and $46 billion, respectively, over that stretch. Meanwhile, Nvidia, the world’s most-valuable company, saw dollar volume averages of around $27 billion, more than double Apple at $12 billion. As for other tech IPOs, Cerebras recorded average dollar volumes of a little more than $6 billion in its first three days of trading. Facebook saw $23 billion worth of shares trade hands on its opening day and an average of $11 billion over its first three.” - CNBC
I read that volume works out to roughly six times Facebook’s average over its first three days. Some of that activity ran through IBKR’s platform, and it helped make the second quarter a record for DARTs. Comparing the third quarter against that backdrop is a little like judging a restaurant’s business by the week after New Year’s Eve.
Management made the same point on the call, and it’s worth reading the exchange in full:
“Q: You have seen some moderation in client activity in terms of trading. Curious at a high level if you see anything at a customer or geographic region where you anticipate maybe a continued slowdown or anything underneath that would be concerning in terms of looking ahead around growth or anything else?
A: Nothing really concerning. As you know, the trading activity is not always the same. In the previous quarter, we probably benefited from some activity that was related to the IPO.”
The IPO pipeline looks stalled rather than empty. Renaissance Capital pointed to “a string of postponements near quarter end” and named rising bond yields, concerns about AI spending, and weakness in growth stocks as headwinds.
OpenAI has pushed its listing into 2027, while Anthropic is reportedly preparing to start its roadshow as early as the week of November 9, which could put its debut before Thanksgiving. If that deal happens, it will be one of the largest listings ever and exactly the kind of event that brings retail traders back to their screens.
“There were some IPOs that were supposed to come online this quarter. They have been delayed. We expect the volatility to somewhat increase as we approach the midterm elections. As the volatility increases, our traders and clients tend to trade more. No concerns whatsoever.”
Add the midterm elections, which tend to bring volatility, and the fourth quarter could look quite different from the third. I wouldn’t bet on a return to second quarter levels, though. “No concerns whatsoever” is a confident statement, yet I’d rather judge it by the numbers when we get them.
What outlasts the cycle?
Beyond the cycle, I see lots of structural tailwinds that I believe will outlast any short-term cyclicality.
Short-term orientation
Market participants have become more short-term oriented. Retail investors play a much larger and more active role than a decade ago. By most estimates, they account for somewhere between a fifth and a quarter of U.S. equity volume on a typical day, roughly double their share in the mid-2010s. Zero-commission trading, fractional shares, options trading on mobile apps and the global reach of platforms like IBKR have lowered the barriers for millions of people outside the United States who want to own Nvidia or SpaceX directly.
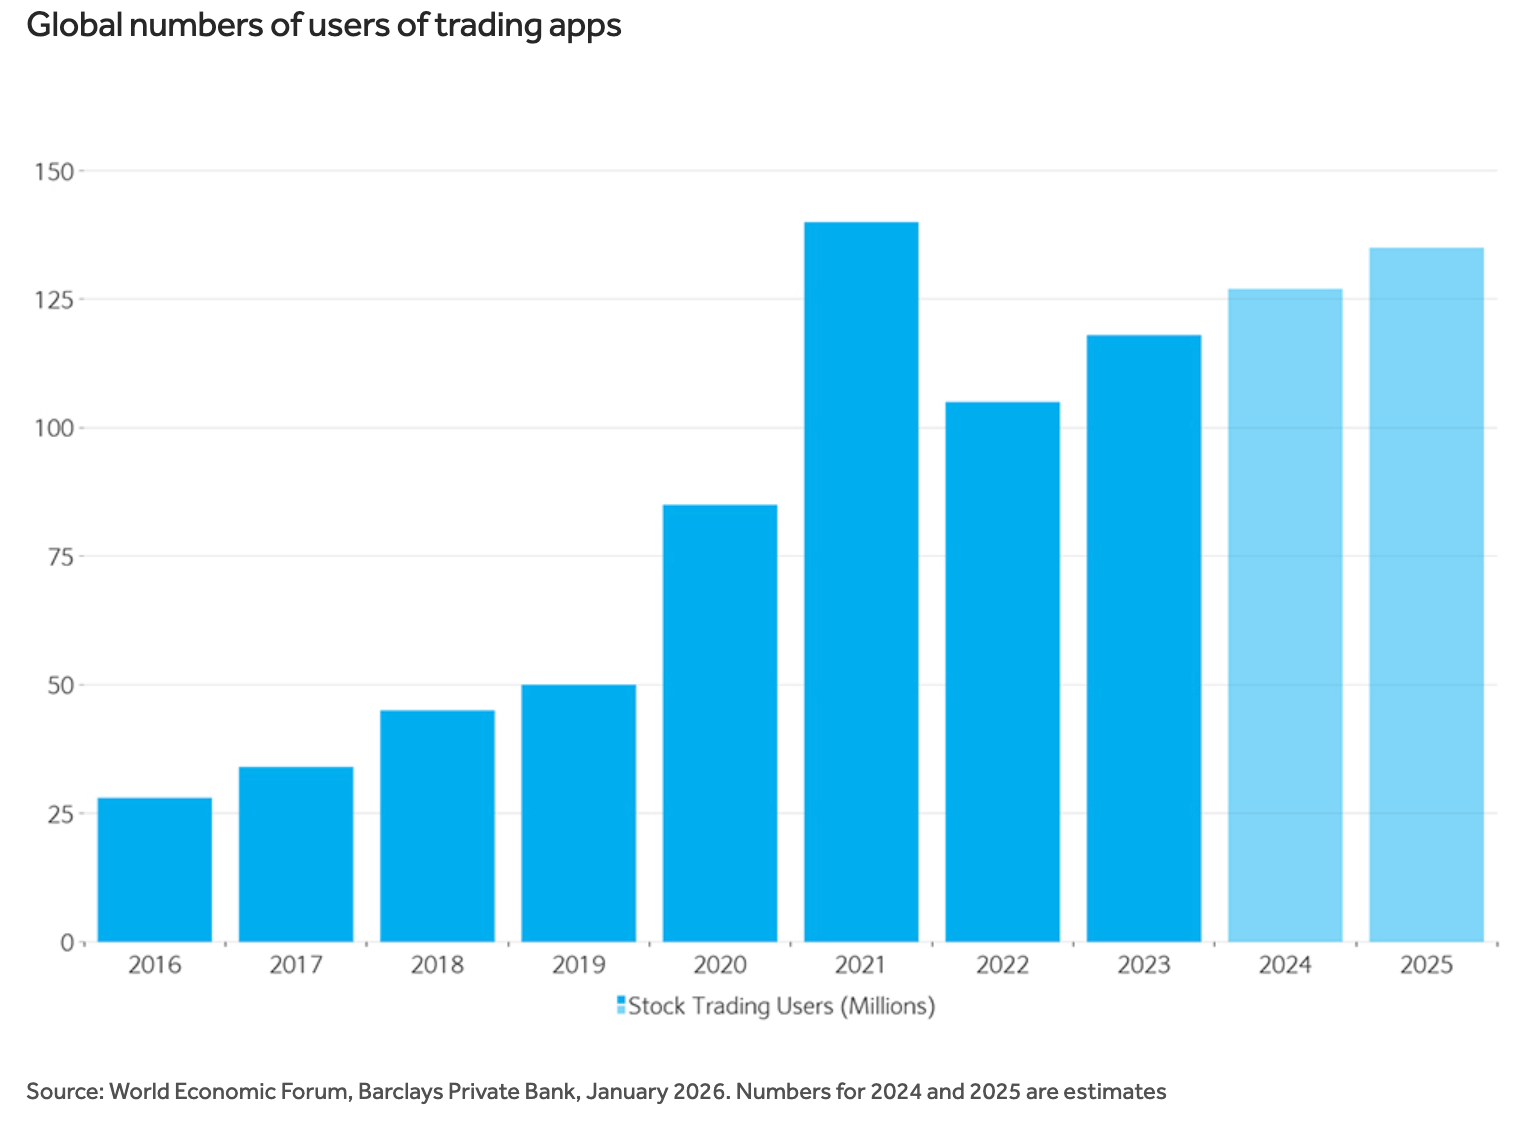
That said, it would be a mistake to picture the average IBKR client as a WallStreetBets regular trading meme stocks on a phone between meetings, managing some $10k in assets. IBKR’s sweet spot has always been the professional and semi-professional end of the market: hedge funds, proprietary trading firms, financial advisers, introducing brokers and sophisticated individuals who trade actively across asset classes and countries.
The numbers reflect that. IBKR’s customers hold an average of about $173,000 per account.
Robinhood, the poster child of the retail boom, reported $369 billion in platform assets across 28.4 million funded customers at the end of June, or roughly $13,000 per customer. The two firms count accounts and customers a little differently, but the gap of more than ten times tells you all you need to know about who each platform serves.
What I find more interesting is that the professional end of the market is evolving too. Professional traders are becoming more sophisticated in the tools they use and hungrier for a wider range of instruments. Zero-day-to-expiry options are the most striking example. In the third quarter, SPX options expiring the same day reached a record average of 3.2 million contracts a day at Cboe, roughly two-thirds of all SPX options volume. Commonly cited estimates put that share at well under 10% only a decade ago. Add overnight trading sessions, event contracts, crypto, futures on every conceivable underlying, algorithmic execution, and now AI agents connected directly to brokerage accounts. The professional trader of 2026 wants access to more products, in more markets, more hours of the day, through more automated tools than ever before. That’s precisely the demand IBKR’s platform was built for, and it’s a trend I’d expect to persist regardless of where we are in the market cycle.
A Thought Experiment
Let me add one wild thought experiment, which I offer as speculation rather than a forecast. Suppose AI delivers even part of what its biggest proponents promise, and over the coming decades a meaningful share of people end up working fewer hours. John Maynard Keynes predicted something similar in 1930, when he speculated that his grandchildren would work 15-hour weeks and that humanity’s main challenge would be what to do with all that leisure. What would people do with their newly freed-up time? I suspect a good number would speculate. We’ve already seen a small-scale version of this experiment. In the second quarter of 2020, with people stuck at home, sports cancelled and stimulus checks arriving, IBKR’s DARTs more than doubled year over year. Boredom, spare time and a smartphone proved a powerful combination for trading activity. If AI-driven productivity gains ever create that environment on a lasting basis, brokers and prediction markets would be among the most obvious beneficiaries.
I can easily argue the other side, though. People who work less may also earn less, leaving them with less money to speculate with. Trading driven by boredom has a habit of ending badly for those doing it, and a society in which large numbers of people gamble to fill their days would almost certainly invite a regulatory backlash. And this crowd would likely gravitate toward the simplest, most gamified apps rather than IBKR’s famously dense interface. It’s a fun scenario to think through, but it plays no part in my investment base case.
Prediction Markets
Prediction markets could add an entirely new category of activity on top of that. Thomas Peterffy has been one of their most vocal advocates. He has said that prediction markets could become “a larger market, in my view, than the equities market, maybe in 15 years or so,” and earlier this year he called himself “incredibly bullish on this space, especially with elections coming this year.”
Bernstein estimates that prediction market volume roughly tripled to about $51 billion in 2025. It projects around $240 billion this year and $1 trillion annually by 2030. IBKR has been building for this since it launched ForecastEx in 2024. This quarter, it added short-duration event contracts with hourly and 15-minute expirations in crypto, metals and energy.
I’d be careful about getting carried away, for three reasons. First, the economics per contract are small still. Many event contracts trade at well under a dollar, so even impressive volume figures translate into modest revenue compared with options or futures. Second, the regulatory picture is far from settled, particularly where event contracts overlap with sports betting. A 15-minute contract on the price of oil isn’t far from a casino product, and regulators may eventually see it that way. Third, Peterffy himself noted that “more and more prospective participants are trying to enter this market and there doesn’t seem to be any barrier.” A market with no barriers to entry is a great market for users and usually a poor one for the companies serving it. I see prediction markets as a free option for IBKR, but I wouldn’t build my thesis around them.
On Account Growth vs. Customer Equity Growth
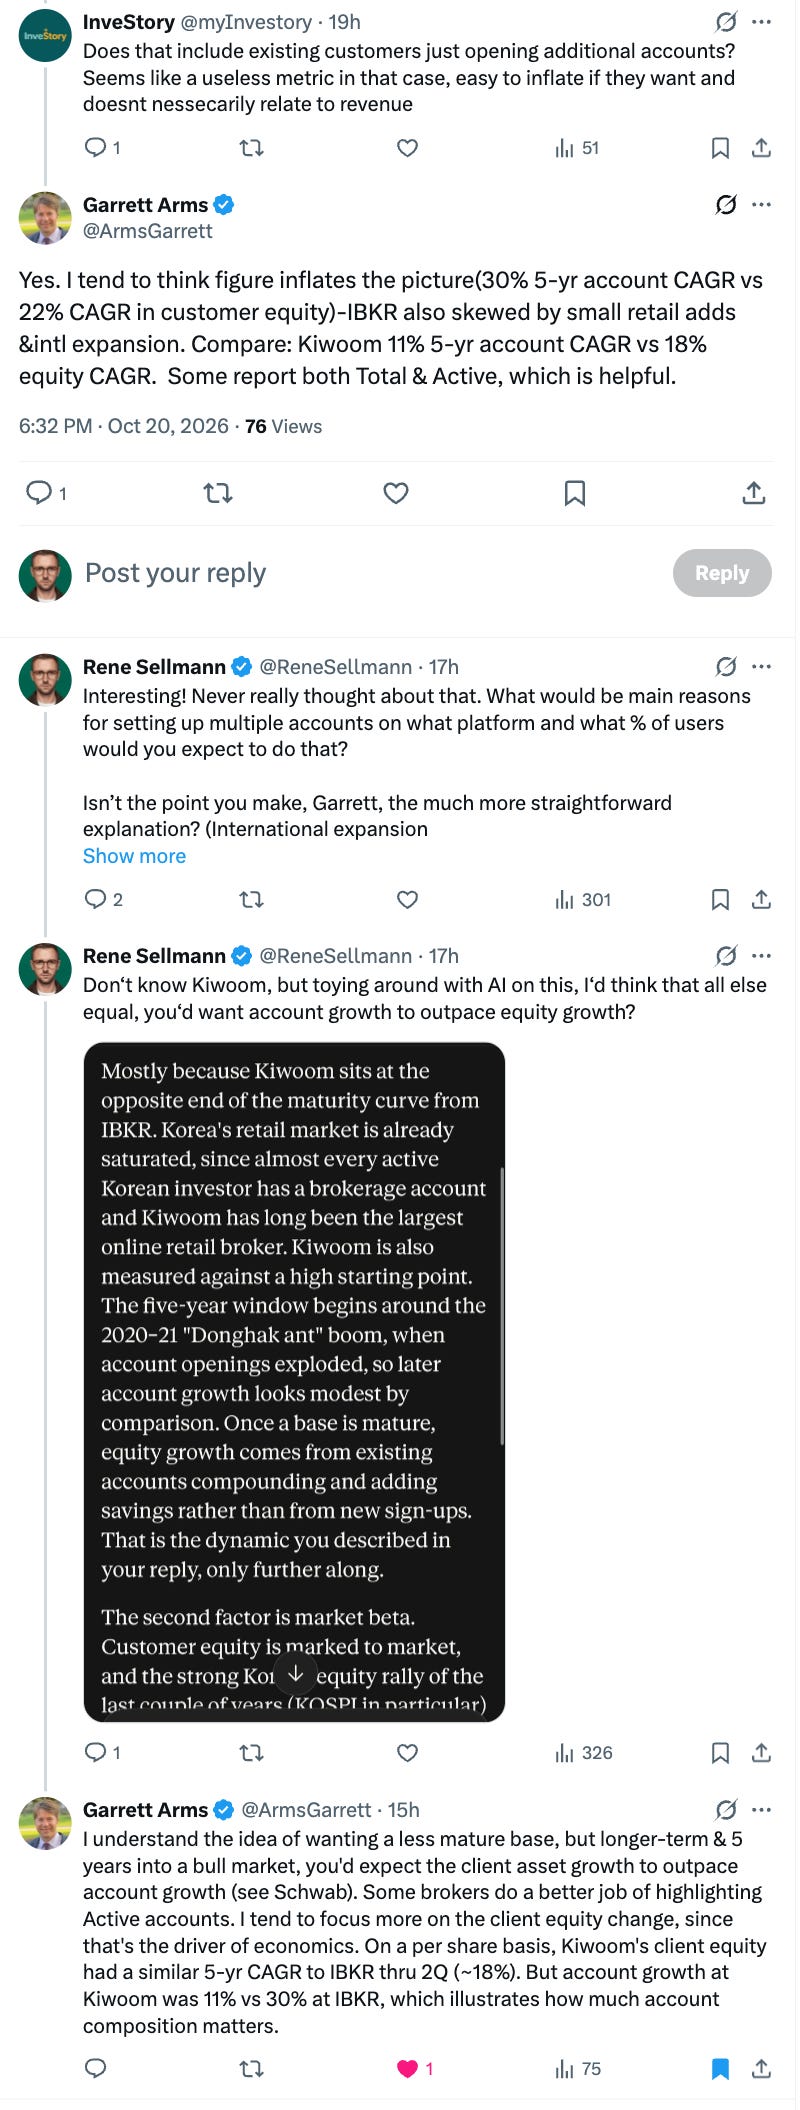
Two more data points deserve attention. Customer equity per account fell about 6% year over year, from roughly $184,000 to $173,000, despite a strong market. The most likely explanation is that many of the newest accounts are smaller, and possibly less sophisticated, than IBKR’s traditional client base. That’s normal for a broker expanding into new (international) markets and segments, but over time it could dilute the quality of the client base that has always set IBKR apart.
Garrett Arms also shared some interesting thoughts on this on X. I’m just going to attach a screenshot below with a bit of a discussion that followed. I’ll have to give this some more thought. So far, I’ve always viewed account growth as the best proxy for intrinsic value growth, but I might want to challenge that view.
Meanwhile, margin loans have grown faster than customer equity, rising from about 10.2% to 10.9% of client assets over the past year. Clients are borrowing more relative to what they own, which is great for net interest income in a rising market and less great at the moment the music stops.
Still, for my thesis, account growth is the variable I watch most closely, because it compounds through every cycle while trading intensity comes and goes. Customer equity may be an equally good KPI to track (or a superior one) and it’s actually part of my UP Fintech thesis. Overall, as long as the new accounts keep coming and the average quality of the client base doesn’t deteriorate meaningfully, a quarter or two of cooler trading (or more) is noise to me.
The Moat Keeps Widening While Nobody’s Looking
One reason IBKR rarely makes it into my “babysit” bucket is that management never seems to stand still, even in quarters when the headline numbers are soft. The list of what the company shipped in the third quarter alone would fill a year’s roadmap at most competitors.
On the market access side, IBKR added the Bucharest Stock Exchange, one of the best-performing markets of the past decade, as well as the new Texas Stock Exchange, where it already sees average daily volume of about 2.5 million shares.
It also connected to a new options exchange designed to improve liquidity for larger, mostly institutional options orders.
In Brazil, it launched trading of B3 futures on financial indexes, cryptocurrencies and commodities, expanding its Latin American footprint.
It began a limited rollout of cryptocurrency staking.
In Japan, it can now offer margin lending, its fully paid securities lending program and Gaika+, a proprietary product that lets Japanese clients earn interest on eligible non-yen cash balances.
And on the prediction market front, it introduced the short-duration event contracts I mentioned earlier.
Then there’s AI. IBKR’s AI connector is, by management’s account, one of the fastest-adopted features the company has ever launched. This quarter, IBKR added Perplexity as an official partner and opened the connector to any AI tool built on the Model Context Protocol (MCP), including the coding and desktop assistants many of its active clients already use.
It also added account-level P&L, alert management and watch lists, and expanded trading capabilities to two-leg option strategies.
Maybe most notably, it launched autonomous AI trading. Eligible clients can now connect the AI agent of their choice to their account and authorize it to trade on its own, in global stocks and options, across day, overnight and overnight-plus-day sessions. Clients do this by creating and funding a dedicated partition within their existing account, which they can set up in a single session.
I find this impressive and a little unsettling at the same time. From a competitive standpoint, it’s classic IBKR. The company is first to market with something technically demanding, and it targets exactly the sophisticated, tinkering client base it already serves best. Before long, IBKR will likely be the default broker for anyone who wants their AI agent to trade for them. But letting autonomous agents place orders opens a new category of risk. Agents can misread instructions, loop on errors, or pile into the same trades at the same moment if many of them run on similar models.
Should an agent go rogue and blow up an account, the question of liability is unlikely to be settled in IBKR’s favor in the court of public opinion. That’s effectively the concept we previously discussed in my primer on agentic AI already.
Agentic AI: A Primer for Investors

Every market cycle gets its word. In 2021 it was “metaverse,” in 2023 it was “generative AI,” and if you’ve spent any time on financial Twitter, Substack Notes or earnings calls this autumn, you already know the word of 2026:
Regulators haven’t really caught up with any of this yet. To IBKR’s credit, the dedicated partition is a smart design choice, since it caps how much capital an agent can touch. I’d still expect at least one embarrassing headline about an AI agent gone wild on somebody’s brokerage platform in the next few years. The question is whether IBKR’s risk controls make sure it isn’t theirs.
Two growth vectors the market underrates
Two other parts of the call caught my attention, because I think they point to growth opportunities that most analysts aren’t modeling yet. The first concerns registered investment advisers (RIAs):
“For registered investment advisers, we now offer tax-aware long/short strategies to their customers. Given that our platform is designed for active, sophisticated clients and that we have a long-standing prime brokerage offering, tax-aware accounts that use margin, short selling and securities lending are a good fit for us. We are seeing increased interest in our offering, particularly as other brokers impose limits on these strategies. We have 3 tax-aware strategy providers onboarded now with additional ones coming by year-end and more early next year, offering RIAs a broad range of options.”
For those unfamiliar with these strategies, a brief explanation. Tax-aware long/short strategies are essentially the next evolution of direct indexing. Instead of holding only long positions and harvesting losses when individual stocks fall, the account also holds short positions, often in structures like 130/30 or more leveraged variants. This creates far more opportunities to realize losses that offset gains elsewhere in a client’s portfolio, while the overall exposure still tracks a benchmark. For wealthy clients sitting on large unrealized gains, the appeal is obvious. For a broker, these accounts are attractive because they use the services IBKR is built for: margin lending, short selling and securities lending.
The timing is excellent too. The two largest RIA custodians have been backing away from these strategies. Fidelity stopped allowing advisors to open new long/short SMA accounts in December 2025 and started charging higher fees to some advisors using them in May. Schwab raised its asset minimum for long/short SMAs several times this year, most recently from $1 million to $10 million in September, and caps an RIA’s allocation to these strategies at 30%. When the incumbents put up fences, the advisers who want these products have to go somewhere.
Then came a second gift, which an analyst raised directly on the call:
“Q: They recently introduced a minimum asset threshold of $100 million for RIAs on their platform. It goes into effect sometime in the middle of next year. But many people believe that this could bring more small RIAs in motion. That certainly plays to your firm’s strengths. […]
A (Milan Galik): So as you said, this is supposed to happen sometime in the middle of next year. The competitor was Fidelity, I believe, and anybody under $100 million is supposed to find a new home. I completely agree with you. We are one of the obvious choices, if not the obvious choice. That is why – that is part of the reason why some of the work that I mentioned earlier is so relevant and so beneficial. So we have 9 months between now and maybe a little more when this is supposed to happen. So we’re going to be working very hard to show a welcoming home to the financial advisers that need to find one.”
Fidelity is extending its $100 million custody minimum, previously only for new relationships, to existing RIAs, which must meet it or leave by June 30, 2027. Estimates of how many firms are affected range from a few hundred to more than a thousand. Galik also mentioned that IBKR is working to make RIA onboarding smoother and to significantly improve its integrations with multi-custodial platforms. The idea is to persuade advisers who currently custody with competitors to move at least part of their business to IBKR. As for the economics of the tax-aware business, he said they “would be similar to the rates that we offer to large balances and large accounts today.”
Here’s where I’d temper expectations. First, the economics are attractive but thinner per dollar than IBKR’s retail business. Large accounts get IBKR’s lowest margin rates, so the spread on these balances will be well below what the firm earns on a $50,000 retail account. The opportunity is about volume, which is fine, but it won’t move the margin needle. Second, it’s worth asking why Fidelity and Schwab are pulling back. Leveraged long/short accounts consume balance sheet, concentrate risk, and may eventually attract tax and regulatory scrutiny. IBKR’s automated risk management gives it more comfort here than most, but taking on the business the incumbents no longer want deserves a moment of reflection. Third, small RIAs tend to value service and hand-holding, and IBKR has never been known for warm, personal client service, to put it politely. Its platform is built for self-directed professionals. Competitors such as Altruist, which built its model around smaller advisers, are already courting Fidelity’s departing clients, and IBKR will have to win them over on more than price.
Still, I believe this is yet another promising new client channel IBKR (like appealing to hedge funds and winning users via introducing broker partnerships (basically at no CAC); the next nine months will show whether management can turn a lucky break into lasting market share.
The second growth vector is less flashy but probably more important over the long run: introducing brokers, which we just mentioned. These are banks and brokers around the world that offer their own clients global trading while IBKR handles everything underneath. I myself started on Lynx, a Dutch brokerage business using IBKR’s infrastructure, for instance.
Management described the pipeline as strong as last quarter, with a substantial pool of prospects, ongoing onboarding of new partners, and growth among existing ones. A more recent example is DAOL Investment & Securities, a publicly traded South Korean broker that launched a global securities trading platform powered by IBKR’s technology and infrastructure. DAOL keeps the client relationship, the accounts, and the regulatory obligations, while IBKR provides the plumbing. Galik explained the appeal when asked about the pipeline:
“Here, one of our key advantages is that we provide a complete solution from the account opening and front-end trading platforms to execution, corporate actions, clearing, custody, along with, I would say, unmatched global multi-asset offering. So that’s a very key advantage. Another big advantage is that the investments that we make in our direct brokerage business also benefit our IBroker clients. As we expand into new markets or asset classes or add new capabilities, these capabilities become available almost immediately to our IBroker clients as well.”
That last sentence captures what I find so compelling about this business. Every exchange IBKR connects, every product it launches, and every AI feature it builds is developed once and then distributed through two channels at almost no extra cost. When IBKR plugged in the Bucharest Stock Exchange, it did so for its own clients and for the clients of every bank and broker running on its rails. This is where the moat gets wider each year. A regional broker that wants to offer its clients 175 markets has two options. It can spend years and a fortune building the connections itself, or it can sign with IBKR. Most choose the second option, and once they’re integrated, switching becomes painful.
There’s one caveat. Introducing brokers are, at least in part, potential competitors that IBKR arms with its own technology. Some of IBKR’s own direct clients in South Korea may end up using DAOL instead, and the revenue IBKR earns from those clients will differ from what it would earn from a direct account. On balance, though, I’d rather own the infrastructure than fight over the end customer. Galik summed up the broader strategy when asked which geography offers the most growth:
“Well, I wouldn’t single out one particular geography. We believe that we have plenty of room to grow in both established and new markets. See, one of our strengths is that we operate a single global platform that is highly automated and can be easily adapted to local regulations and needs without having to build a separate business in each country. So a huge plus. Now the opportunities are not necessarily the same everywhere. In some markets, we see more interest from individual investors, in others from institutions or intermediaries. But that’s the advantage of our model. We can serve different types of clients across different markets, and we can expand without significantly increasing our cost.”
Thirty-One Times Earnings for a Broker?
Time for some valuation work. Based on a share price of $81.35 (at the time I am writing this; the earnings multiple I calculated in the screenshot below was based on $82.7), IBKR’s total market capitalization comes to roughly $138 billion.
To arrive at that figure, you need to count all 1.70 billion membership interests in IBG LLC, the operating company, rather than just the 453 million shares held by public shareholders; another aspect of IBKR you might have to figure out early on (the research terminal I use seem to have caught up to that structure by now at least).
More on why in a moment. Based on the last twelve months, here’s where the multiples stand:
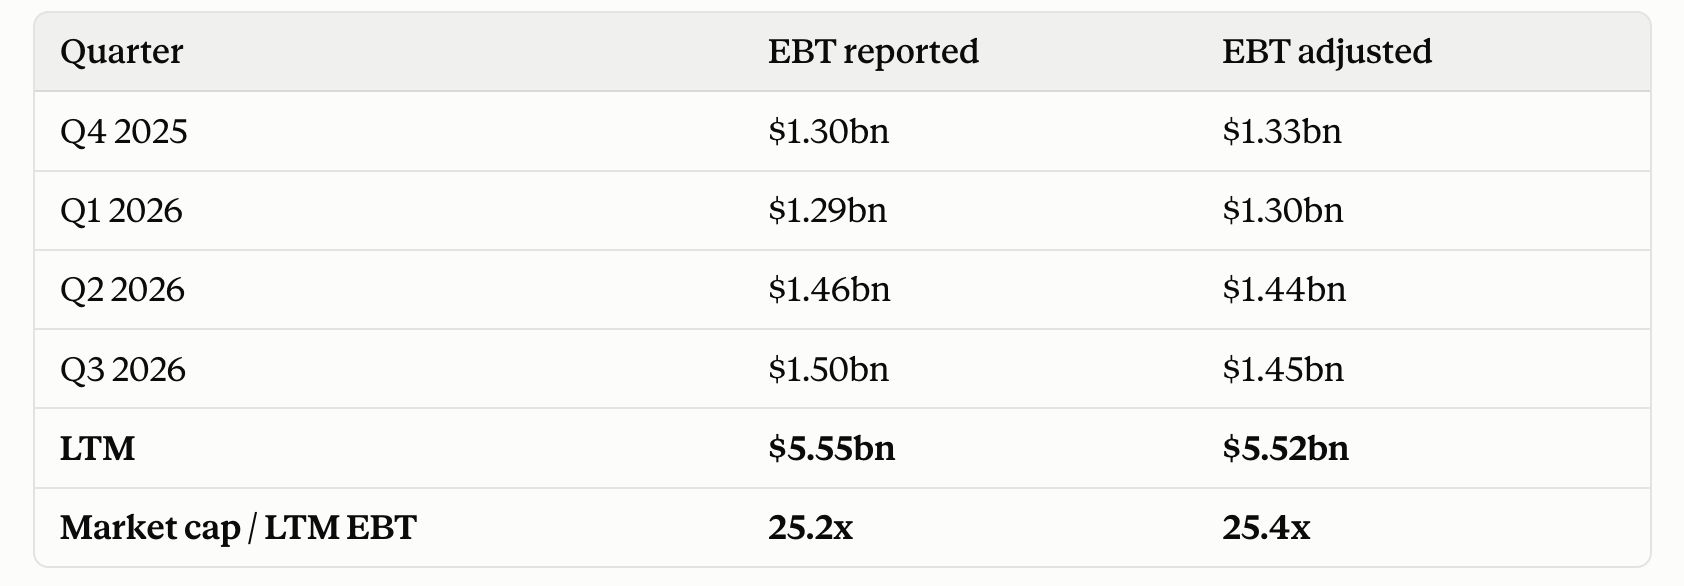
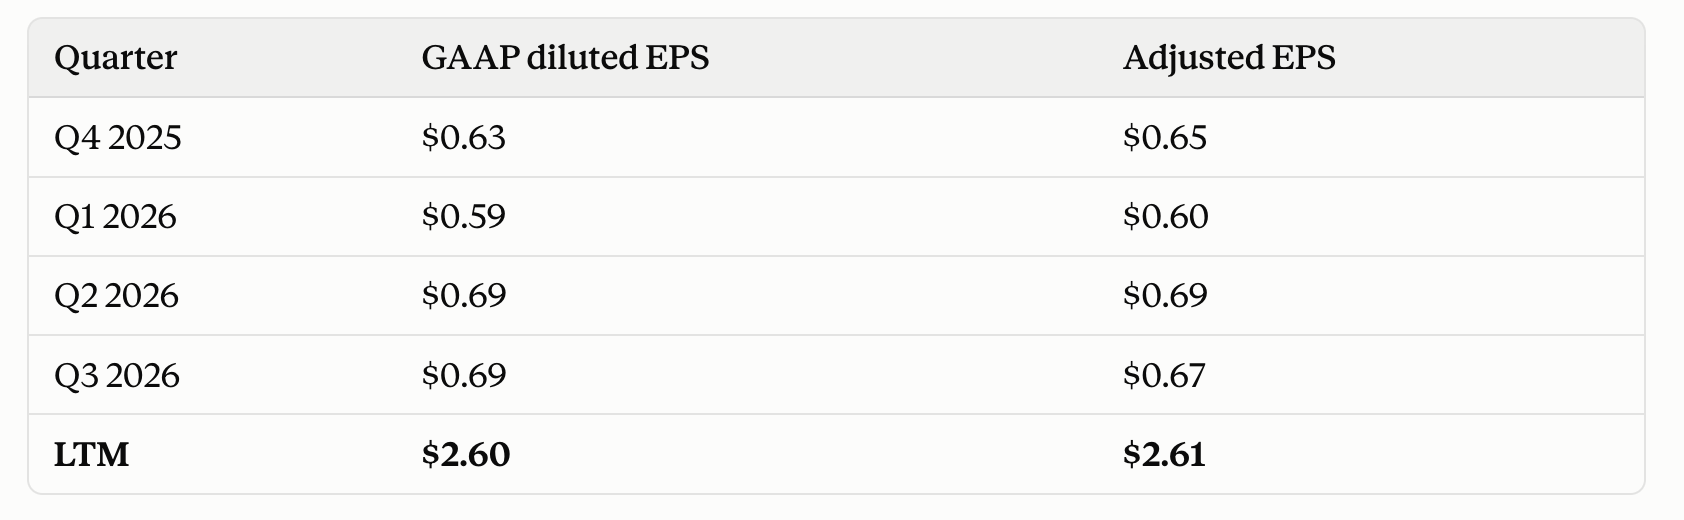
The current price puts IBKR at about 31 times trailing GAAP and adjusted earnings per share, and at roughly 25 times trailing pretax income.
A brief word on why I prefer the EBT multiple for IBKR: The company’s structure is unusual. The listed entity, Interactive Brokers Group, Inc., owns only 26.6% of the operating company. The remaining 73.4% is held by IBG Holdings, the vehicle through which Thomas Peterffy and other insiders own their stakes. Taxes on that 73.4% are paid at the owners’ level, not by the company, which is why the consolidated income statement shows a tax bill of just $148 million on $1.5 billion of pretax profit. If you divide the market cap by the consolidated net income of $1.35 billion for the quarter, IBKR suddenly looks a good deal cheaper than it is. The EPS figure avoids that trap, since it reflects only the public company’s share after corporate taxes. But the cleanest lens is pretax income on the full share count. That treats IBKR as if it were one fully taxed company, and at a tax rate of around 22% it translates into a fully taxed P/E of roughly 32 times. Either way, you arrive at the same conclusion. This stock isn’t optically cheap (more on this below).
You could argue that IBKR sits on a net cash position, and in a sense it does. On the second-quarter call, management put excess capital at about $10.3 billion after regulatory requirements and internal buffers, and there is no long-term debt on the balance sheet.
James Yaro, Analyst: I was hoping you might be able to update us just on your excess capital position today. I know you most recently, I believe, talked about $8 billion of excess capital, but that was a few months ago. And then maybe if you could also just update us on any -- I guess, on the potential acquisition pipeline that you see right now.
Milan Galik: The total excess at this point, if we subtract the various buffers that we have in place, is around $10.3 billion. So it increased by approximately $1.1 billion from the last quarter. Nothing new to report about the acquisitions other than the number of e-mails we receive on a weekly basis with potential acquisition targets from the various investment banks has dramatically increased. There is a lot offered, but nothing so far stood out as worthy pursuing it. That is not to say that we do not look at them.
Strip that out of the market cap and the multiples drop to roughly 23 times pretax income and 29 times earnings per share.
I am not convinced that adjustment tells you much, though. That capital is not sitting idle. It earns roughly the policy rate, which works out to something like $400 million of pretax interest a year, and that money is already inside the earnings I just divided by. If you remove the cash from the numerator, you also have to remove its yield from the denominator, at which point both multiples drift right back to where they started – about 25 times pretax income and 31 times earnings.

Personally, I prefer to value IBKR on its plain market cap, and the reason sits in how the company thinks about its own balance sheet. Interactive Brokers is unusually vocal about its capital strength being a competitive asset. Clients entrusting close to a trillion dollars to a broker care about who stands behind it, and introducing brokers choosing a long-term partner care even more. I have written about this before in “Not All Reinvestment Is the Same: How Two Companies Reinvented Growth Strategies“, and CFO Paul Brody made the point again on the third-quarter call when he described a balance sheet geared toward winning new business by demonstrating strength to prospective clients and partners. Peterffy himself has said he expects the excess capital to keep growing.
Put together, I treat that $10.3 billion as part of the franchise itself, and beyond a dividend that still yields well under 1%, I see little reason to expect it to find its way back into shareholders’ hands.
So back to the current multiple. For a brokerage business, that’s a lofty multiple by any historical standard. When I bought my first shares, the stock traded in the low teens on the same EBT measure.
How does that compare with the market? According to FactSet, the S&P 500 traded at about 26 times trailing earnings and 19 times forward earnings in early October. On headline multiples, IBKR therefore commands a premium of roughly 20% on a trailing basis. Annualizing the third quarter’s EPS of $0.69 puts IBKR at about 29.5 times run-rate earnings.
Anyone who tells you IBKR is cheap relative to the index is ignoring those figures.
There is one belief that sits underneath almost every valuation call I make. Absent any change in valuation, an investor’s return in a stock equals the free cash flow yield plus the growth in free cash flow.
For a broker like IBKR, free cash flow is a slippery concept, so for simplicity I replace it with core operating earnings. At roughly 31 times adjusted earnings, the starting yield is a little above 3%. I think a business of this quality deserves a premium multiple of around 30 times, which is close to where it trades today. If that multiple holds and IBKR keeps compounding its intrinsic value at 20% or more a year, that growth will ultimately be my return, with the earnings yield on top.
My confidence in that runway for intrinsic value growth in that range (and Peterffy himself has been pointing towards 30%+ account growth more recently) comes largely from Peterffy himself. On an earlier call, when IBKR had about 4.5 million accounts, an analyst asked him to size the total opportunity – 50 million accounts, maybe 60 million. Peterffy’s answer was typical of him:
“Well, I think this year, we’re going to have about 1 million new accounts. And next year, we’ll have 1.3 million new accounts. The year after that, we’ll have 1.69 million new accounts. So if you get my drift is – it grows by 30% a year.”
He refused to name a ceiling and simply described compounding. Today IBKR has 5.58 million accounts, 35% more than a year ago, so the business has kept pace with his drift so far.
Now, betting on a 30x exit multiple might be a slippery slope too. I read an interesting post by Jibby the other day, whose thinking I follow on X, and who recently argued that the multiple you assign to high-quality compounders in 2026 deserves to come down for good (he’s not referring to IBKR in the quote below, just to be clear!):
“So to sum up, the world has changed and the discount rate has increased. It’s possible that a fair multiple for the stock is somewhere in the 14-16 range, and given the current valuation this does not provide me with enough upside compared to other opportunities. I think it could take a long time before compounders that once traded at high multiples do so again but we’ll have to see.” - Full tweet here
I take the argument seriously. I fully expect IBKR to trade at a teens multiple again at some point, when lower rates, quieter markets, or some other temporary headwind weighs on earnings and sentiment at the same time. Those episodes tend to feel permanent while they last, and that’s fine with me.
Ultimately, I believe this is one of the best businesses in the world, with a long runway still ahead, and I am comfortable owning it through whatever multiple the market assigns it along the way.
What does the market need to believe?
Instead of arguing about whether 31 times is too high, I find it more useful to reverse engineer the price and ask what kind of growth it implies. The simplest version goes like this: Suppose I buy at today’s fully taxed multiple of about 32 times, hold for ten years, and want to earn 10% a year.
How fast do earnings need to grow, depending on the multiple at which I eventually sell? I’ve ignored the dividend here, since a yield below 1% hardly moves the needle.
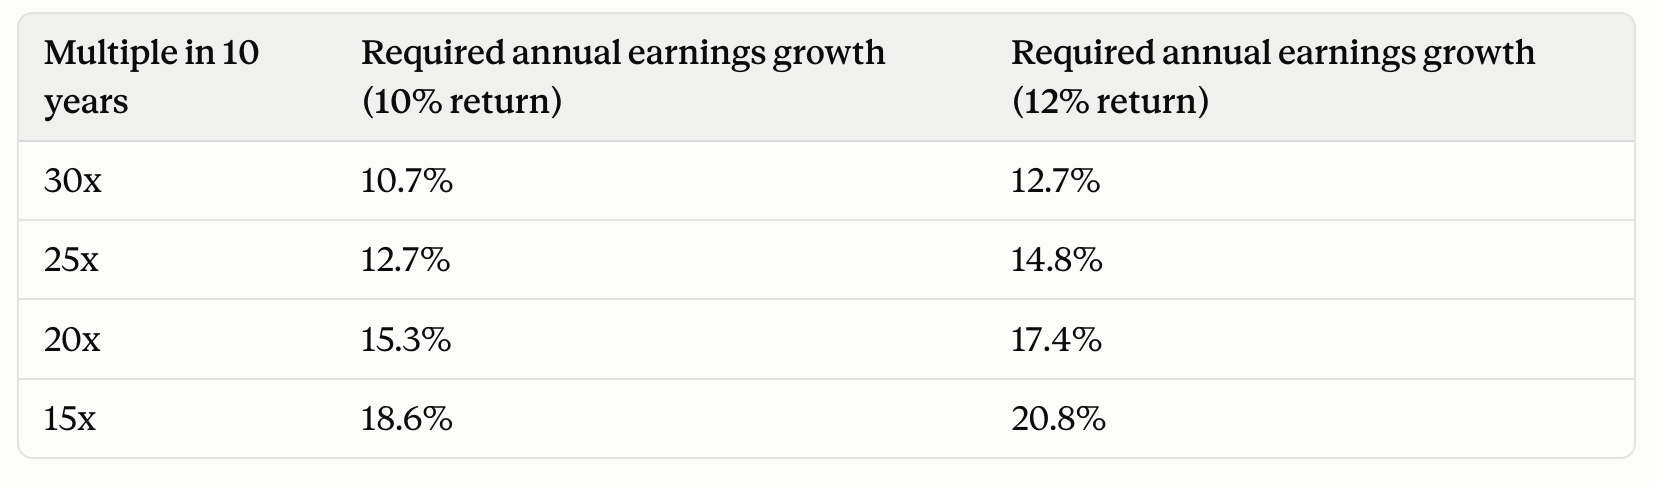
A classic two-stage discounted cash flow model leads to a similar answer. With a 10% discount rate and 3% terminal growth, today’s price implies earnings growth of about 13.5% a year for the next decade. At a 12% discount rate, the required growth rises to about 17.5%.
In plain English, the market is asking IBKR to compound earnings in the low to mid teens for ten years. If you also assume that the multiple compresses toward that of a mature financial company, the bar rises into the high teens.
Is that achievable? My thesis has always rested on one simple idea. As long as interest rates don’t do anything absurd and the quality of the client base doesn’t deteriorate, the best way to track IBKR’s intrinsic value is account growth.
And that growth has been astonishing, far exceeding my own expectations. IBKR ended 2019 with roughly 700,000 accounts. Today, it has 5.58 million, which implies a compound annual growth rate of well over 30%.
Management summarized it on the call:
“As can be seen in our over 30% account growth, strong interest continues in opening and funding accounts. We are seeing growth from both institutional and individual investors and in all regions. Pretax profit was a record, and our 78% pretax margin marked the eighth consecutive quarter with margins above 70%.”
Here, though, I have to push back on my own framework a little, in line with Garrett Arms’ point from above. Earnings don’t grow in line with accounts, and this quarter shows why. Accounts grew 35%, but net revenues rose only 16%.
Measured against end-of-period accounts, annualized revenue per account fell from roughly $1,600 to about $1,370, a drop of around 14%. Part of that reflects lower rates over the past year and part reflects cooler trading. But part of it is structural, since the newest accounts tend to be smaller and less active.
So the accurate napkin-math formula is:
Account growth minus revenue dilution per account, plus whatever operating leverage the automated platform provides.
In good years, that has still added up to 20% to 35% growth in intrinsic value. In a quarter like this one, it was closer to 14%.
The other thing that has to give is the account growth rate itself. Compounding 5.6 million accounts at 20% a year for a decade would get IBKR to roughly 35 million accounts, in the same ballpark as Charles Schwab today. That’s not impossible for a global platform serving a growing middle class of investors in Asia, Europe and Latin America, plus introducing brokers and RIAs.
Still, it’s a tall order, and the growth rate will almost certainly decline from the current 35% over time.
Putting it all together, I land on the following view:
If IBKR can grow accounts at 15% to 20% a year over the next decade, keep its revenue dilution per account modest and maintain margins in the 70s, earnings growth in the low to mid teens looks realistic, perhaps with some upside.
That makes today’s price roughly fair for a 10% return, with an attractive outcome if IBKR keeps outperforming the way it has for years – winners usually keep on winning.
If growth slows faster or rates fall sharply, you’re probably looking at high single-digit returns, which would be disappointing but not catastrophic. What I don’t see at $81.35 is a margin of safety in the Benjamin Graham sense.
The stock offers a fair price for an exceptional business, and as a “value buyer and growth holder,” I have to be honest that I’m leaning on the second half of that phrase here.
Why I Added: A Hedge Against My Own Worst Instincts
So why did I buy more IBKR, for the first time since initiating the position in early 2024? Let me be clear: it’s certainly not because the stock is trading in slam-dunk territory. The previous section should have made that obvious. I’ll write a separate post on my recent portfolio moves soon, but in a nutshell, I sold another position entirely (not Ashtead; we got news on that front today too), and used part of the proceeds to add to IBKR. I didn’t add materially I should say, but then again, not an insignificant amount either (I probably increased the bet by 15% or so; quick napkin math).
There were two reasons.
The first is somewhat embarrassing, but I prefer to be honest about it. I also added to more speculative names recently, and I know myself well enough to recognize the temptation to keep going. Cash burning a hole in my pocket has rarely led to my best decisions. By parking a meaningful chunk of the proceeds in IBKR, I limited how much capital could flow into higher-risk ideas.
In a way, my IBKR increase is a hedge against my own stupidity.
That may sound like an odd reason to buy a stock, but I think behavioral guardrails are underrated in portfolio management. The best decision is sometimes the one that prevents a worse one.
The second reason is how I’ve come to think of IBKR within my portfolio at this valuation level. I view it almost like an ETF. That may not be the best framing, but it reflects how the position feels to me: a safe harbor for capital that’s likely to yield at least 10% a year over the long run. Of course, IBKR isn’t internally diversified like an index fund, since it’s one company with essentially one platform. Then again, the S&P 500 is hardly a picture of diversification these days, with its ten largest technology names making up close to 40% of the index. IBKR is diversified globally, across client types (individuals, hedge funds, proprietary trading firms, advisers and introducing brokers) and across revenue streams that respond differently to the cycle. I also know the company incredibly well, far better than I could ever know 500 companies in aggregate. Knowing what you own is part of my risk equation. Add a competitive advantage that I’d rank among the strongest of any company I follow, several secular tailwinds and intrinsic value growth well above that of the average S&P 500 company, and I believe IBKR’s setup is more attractive than the index’s over the long run, even at a higher headline multiple.
What would prove me wrong
In keeping with how I approach every position, I prefer falsifiable hypotheses to stories. Here are the signals that would make me reconsider IBKR’s place in the low-maintenance bucket:
Net account growth falls below 15% year over year for several consecutive quarters without a bear market to explain it.
Customer equity per account keeps declining faster than market movements can explain, signaling that the client base is getting meaningfully smaller and less sophisticated.
The pretax margin falls below 65% while rates remain at roughly today’s level, which would suggest the cost discipline is eroding.
Customer bad debt rises sharply, or a single loss event exceeds a few hundred million dollars, indicating that the risk management system has failed when it mattered.
Margin loans keep growing faster than customer equity, pushing the ratio well above today’s 10.9% and turning a late-cycle signal into a structural vulnerability.
As long as none of these lights flash red, I’ll keep doing what I’ve done for almost three years: read the report each quarter, check the same handful of KPIs, and get back to my life. IBKR remains firmly in the bucket of stocks I don’t have to babysit. A quarter of cooler trading doesn’t change that. If anything, it reminded me how well this business is built for periods like this one. The one thing I’ve learned from owning it is that my biggest mistake was trimming it twice. This time, I didn’t trim. I added.
Disclaimer:
As of the date of publication, the author OWNS SHARES in the company; but that may change. The analysis presented in this blog may be flawed and/or critical information may have been overlooked. The content provided should be considered an educational resource and should not be construed as individualized investment advice, nor as a recommendation to buy or sell specific securities. I may own some of the securities discussed. The stocks, funds, and assets discussed are examples only and may not be appropriate for your individual circumstances. It is the responsibility of the reader to do their own due diligence before investing in any index fund, ETF, asset, or stock mentioned or before making any sell decisions. Also double-check if the comments made are accurate. You should always consult with a financial advisor before purchasing a specific stock and making decisions regarding your portfolio.
Great article. IBKR is a beast of a company. They got included in the S and P 500 recently and have enjoyed a bit of multiple expansion as well. The margins are just insanely good, and I think that's why it deserves a premium. there's going to be a great wealth transfer in Europe I think IBKR is gonna be a beneficiary long term. just a few raw thoughts.