
Deep Dive: Paycom ($PAYC)
Paycom’s Business Model & the Factors Behind Paycom’s Historic Stock Decline

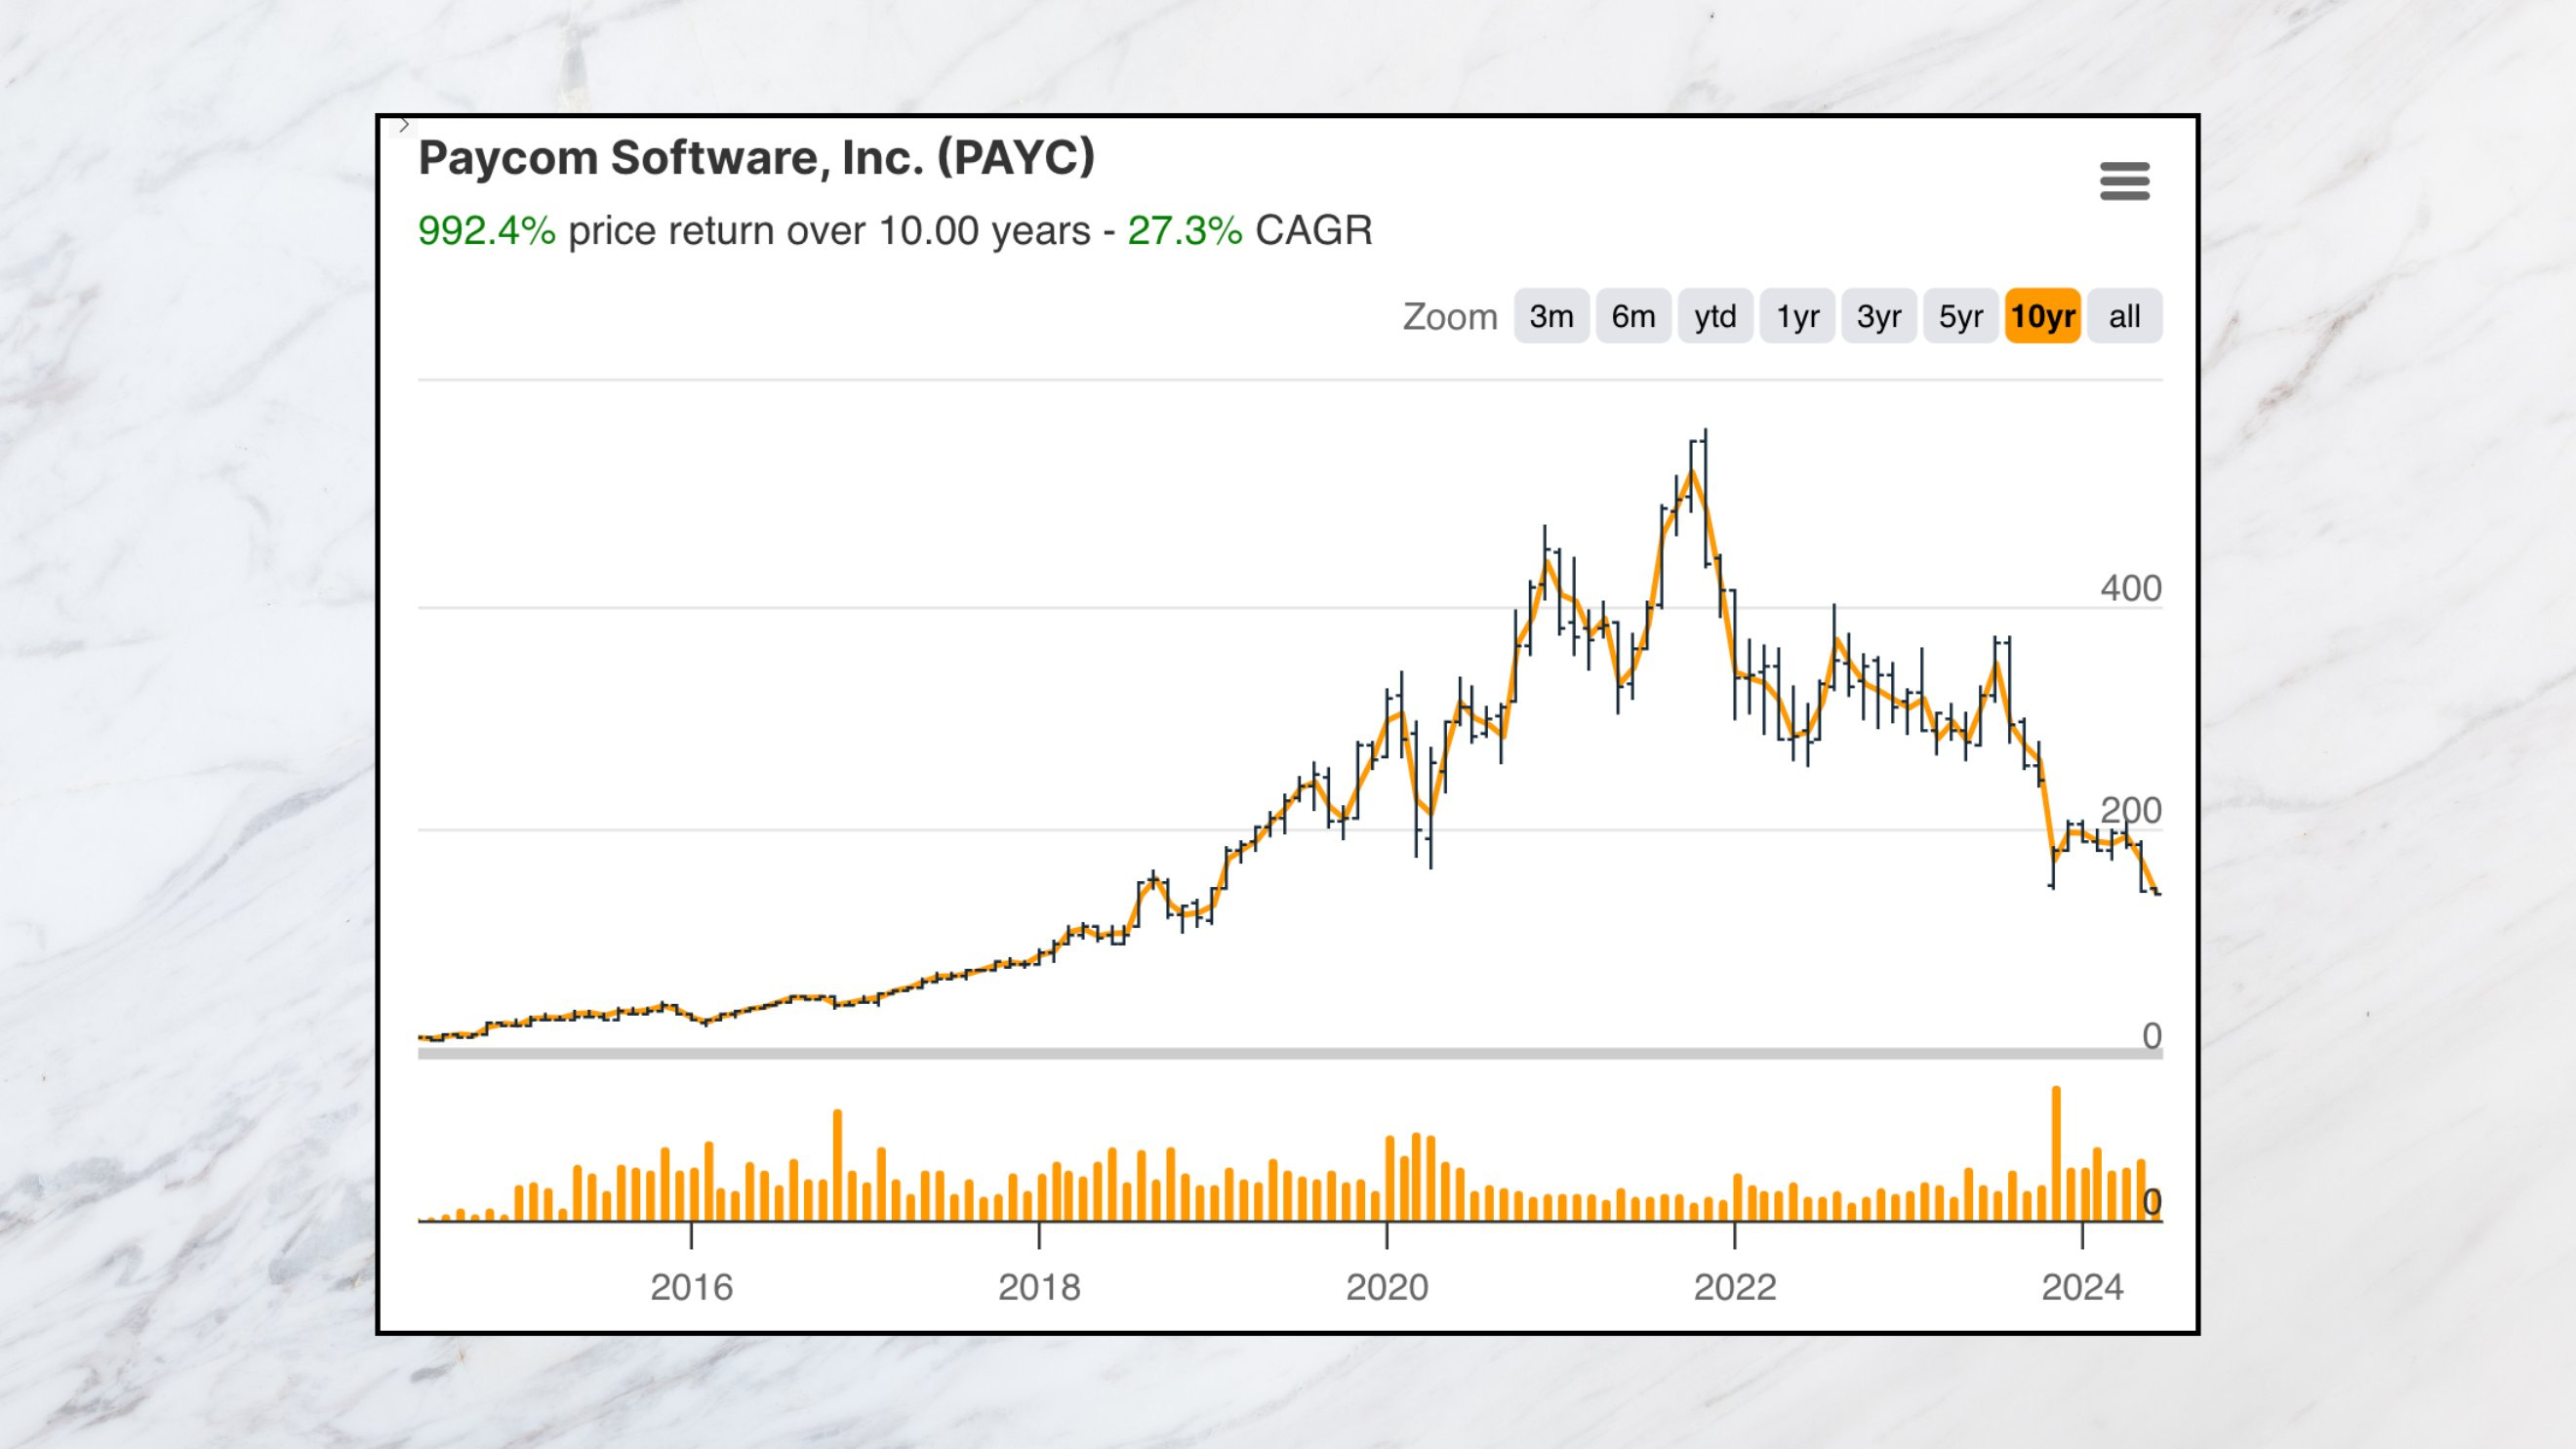
Paycom Software $PAYC used to be a high-flying tech darling and saw its share price soar past $500 in 2021, a 3,571% gain from its debut price of $14 per share in 2014.
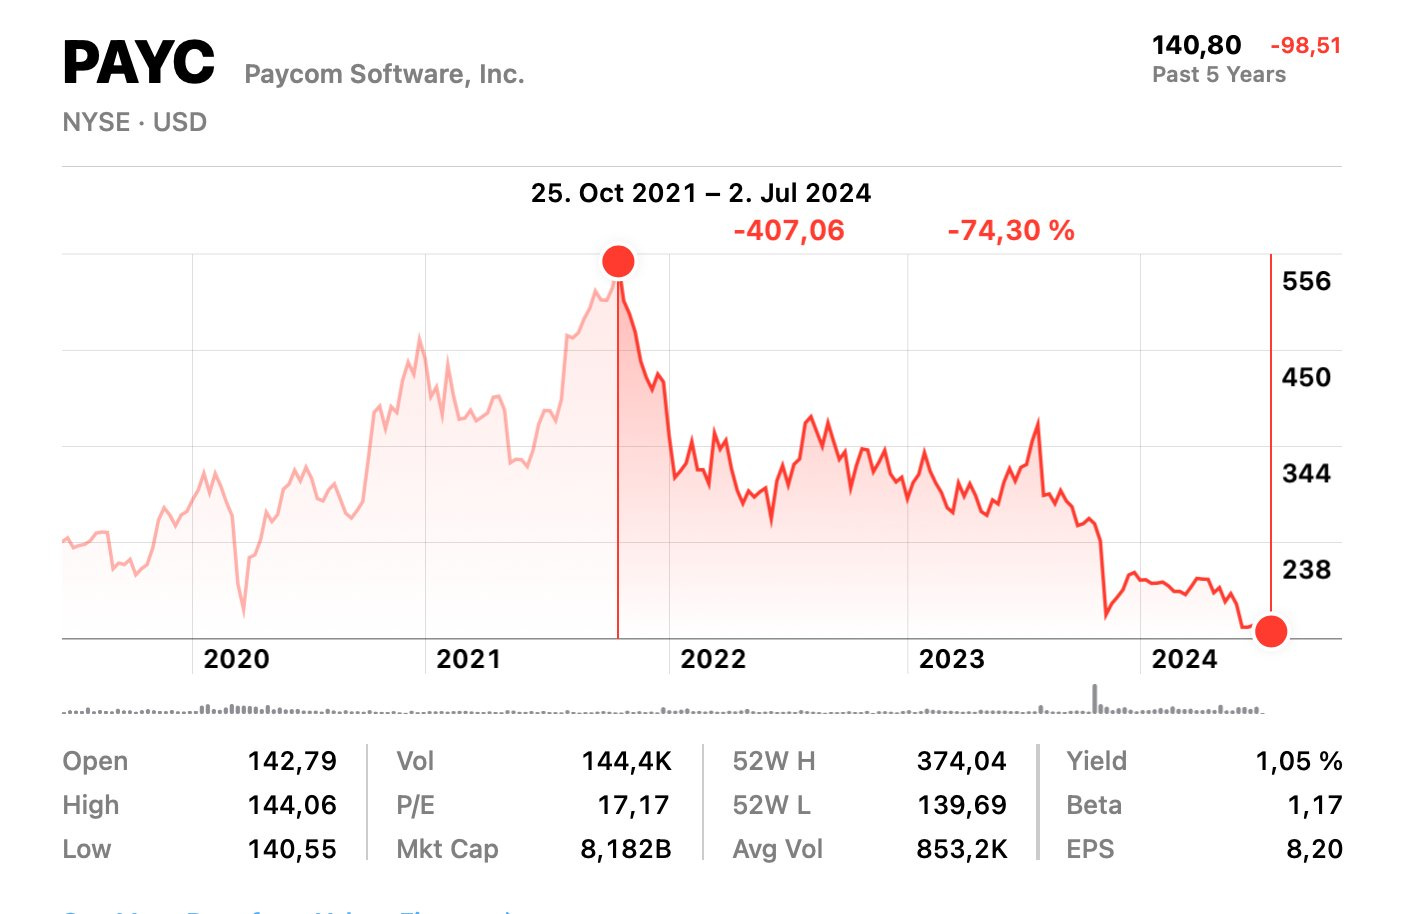
Today, Paycom’s stock is down some 74% from that peak and now trading in the $140 range.
In this post, I’ll explore a) the stock & business performance of Paycom, b) the factors behind Paycom’s stock decline, and c) Paycom’s business model.
Chapter 1: Paycom’s Stock Performance
Paycom’s more recent stock performance was truly abysmal!
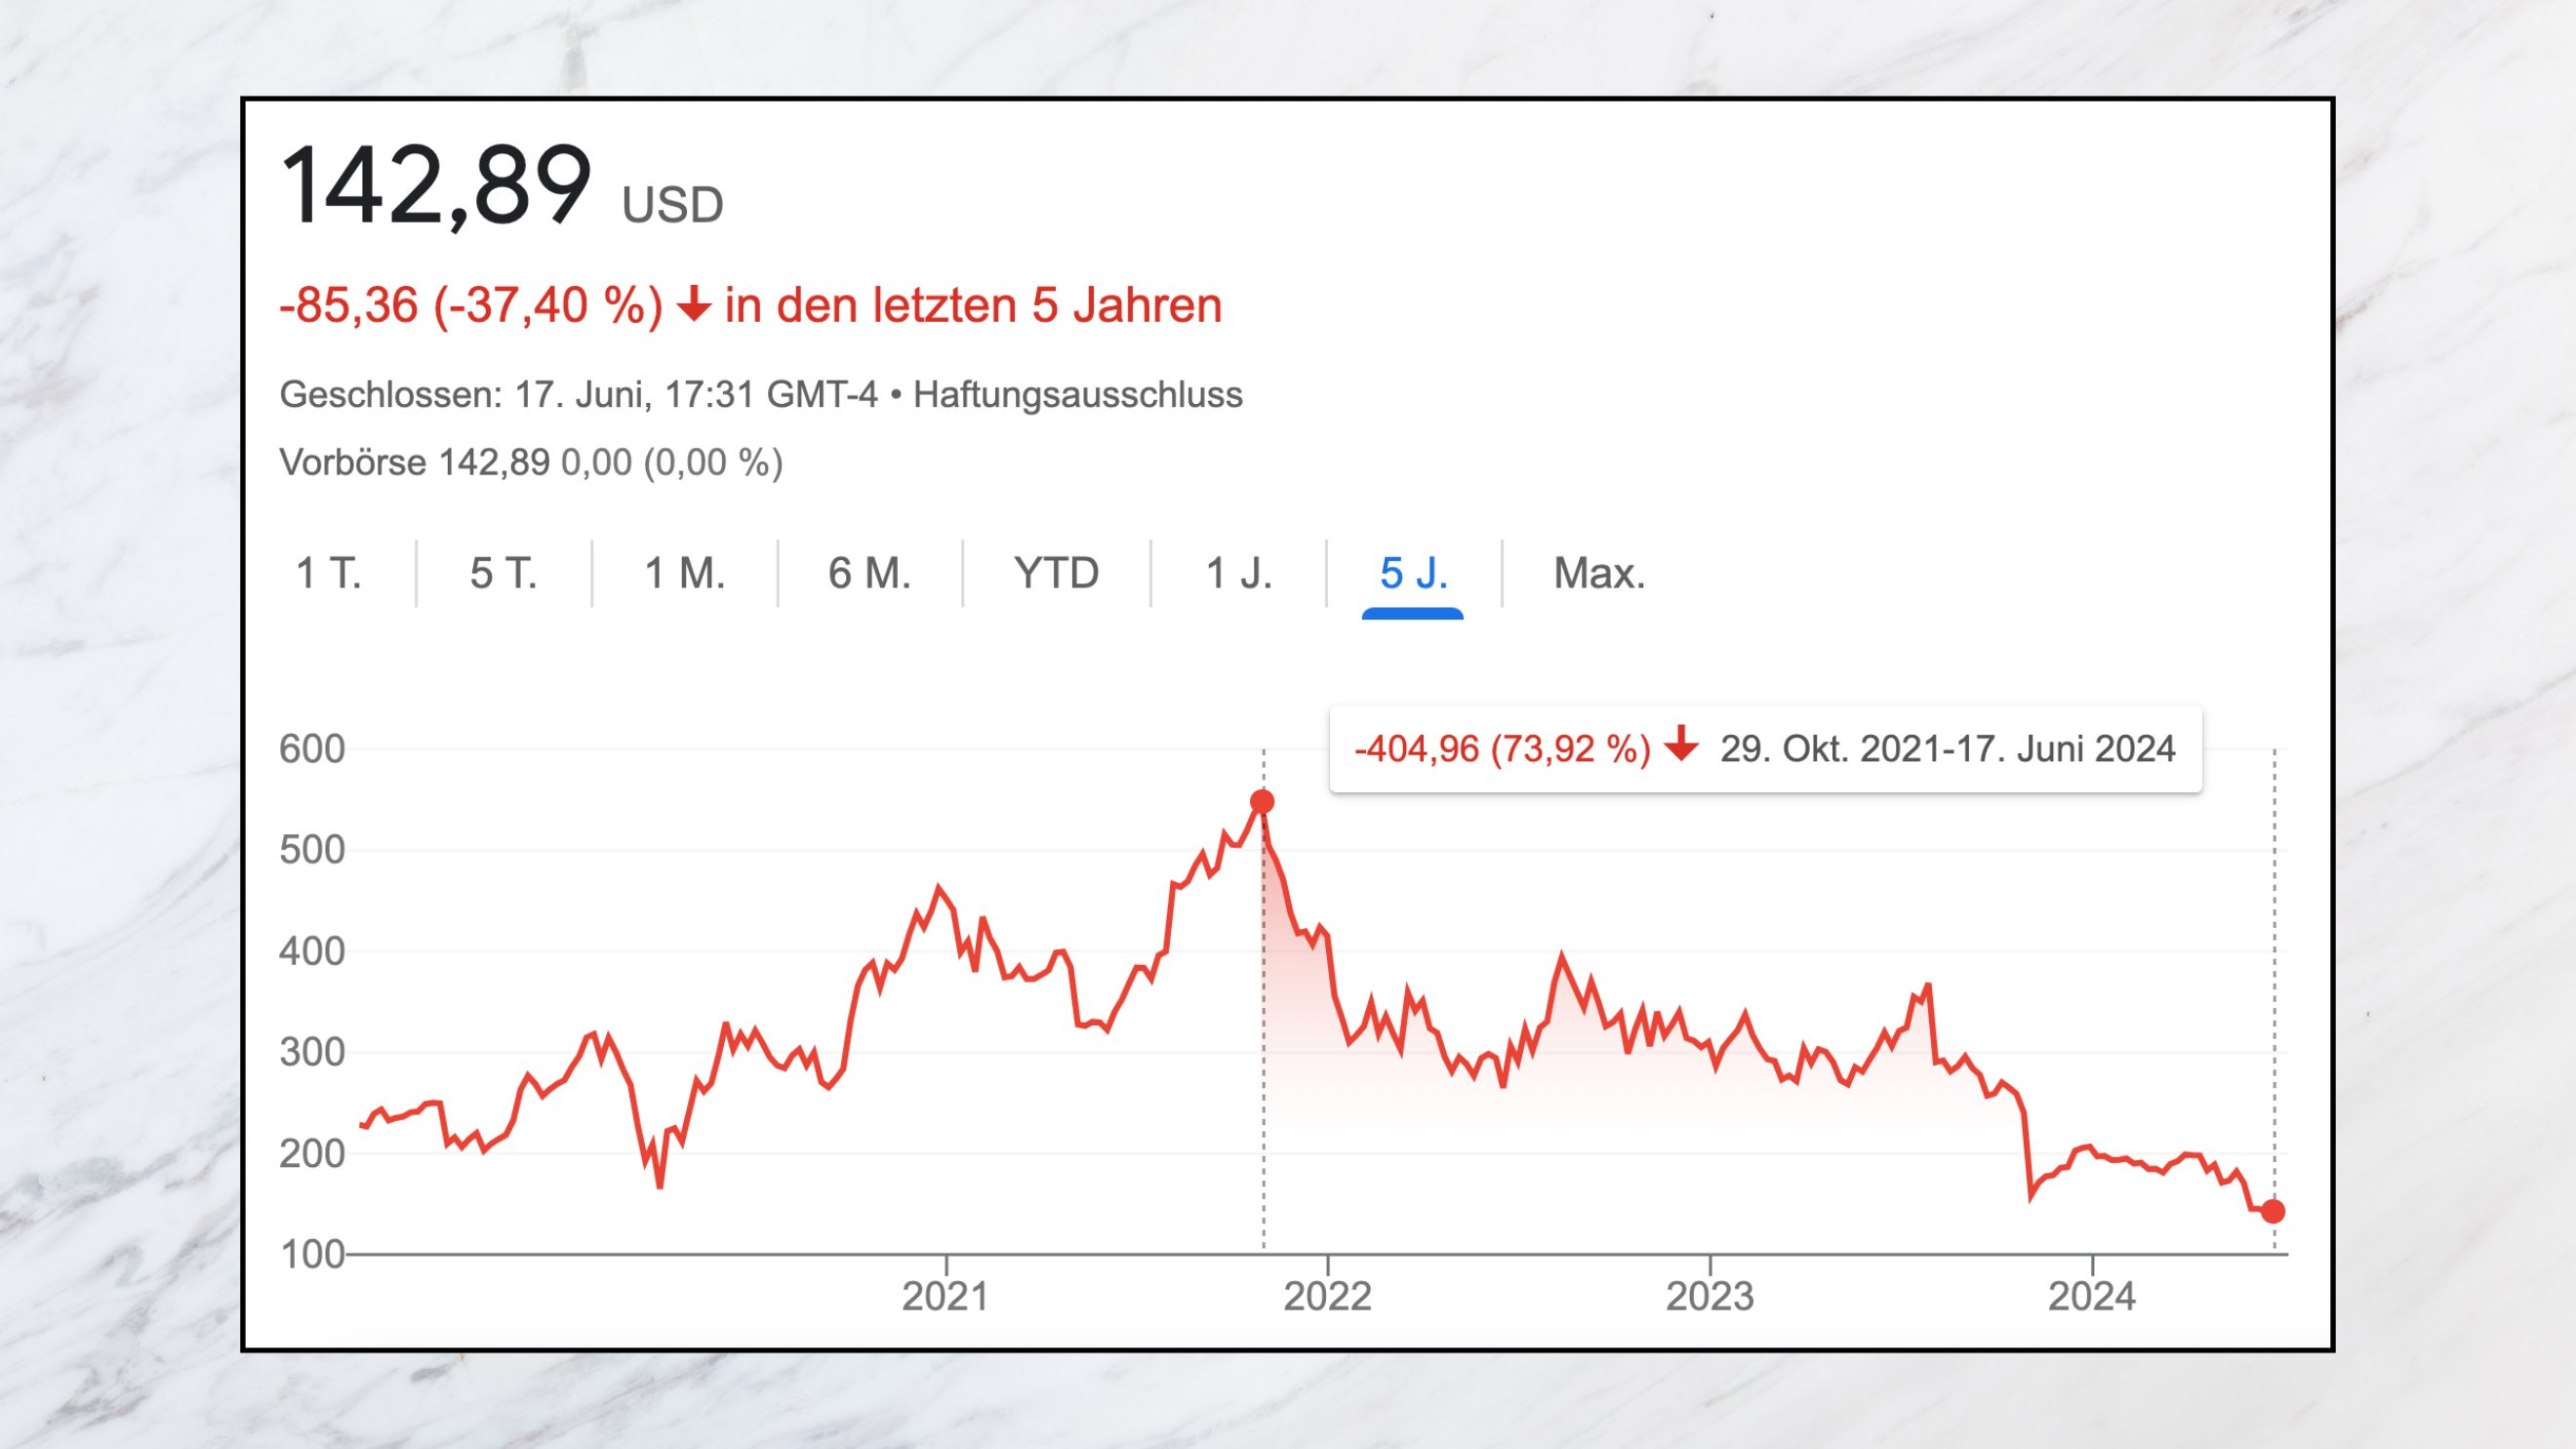
The stock is down 30% year-to-date
The stock is down 55% over the last twelve months
And finally, Paycom’s stock suffered a remarkable decline of 74% from its 2021 peak.
However, longer term, the stock compounded at a rate of 27% annually (!) despite the recent selloff and 10x-ed investors’ money, massively outperforming common indices.
Chapter 2: Business Performance
If you compare the recent stock performance with the fundamental business development, things start looking interesting! Here are some of the highlights:
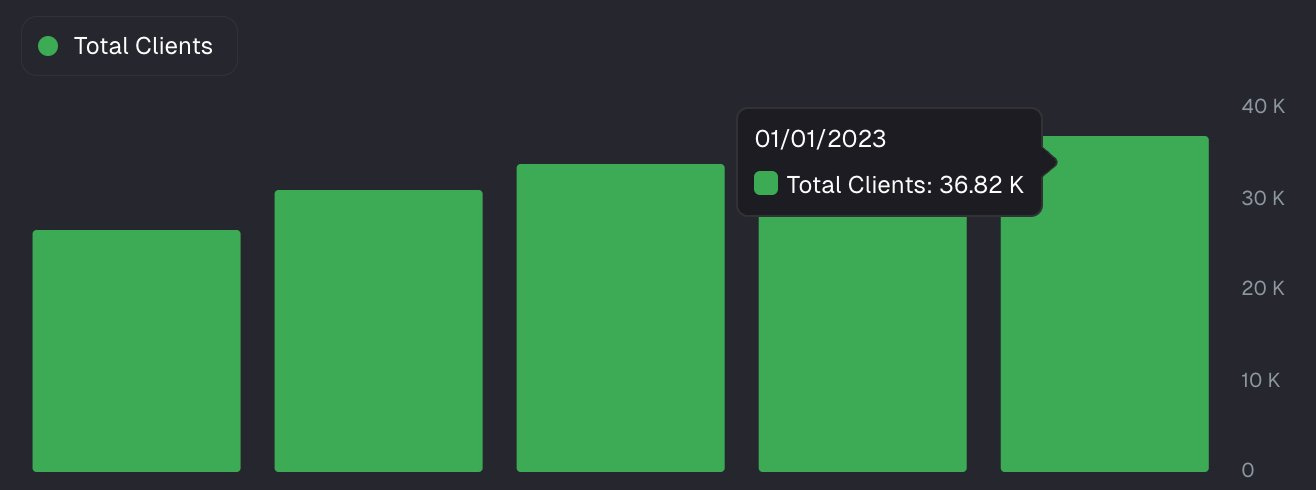
The number of customers is growing:
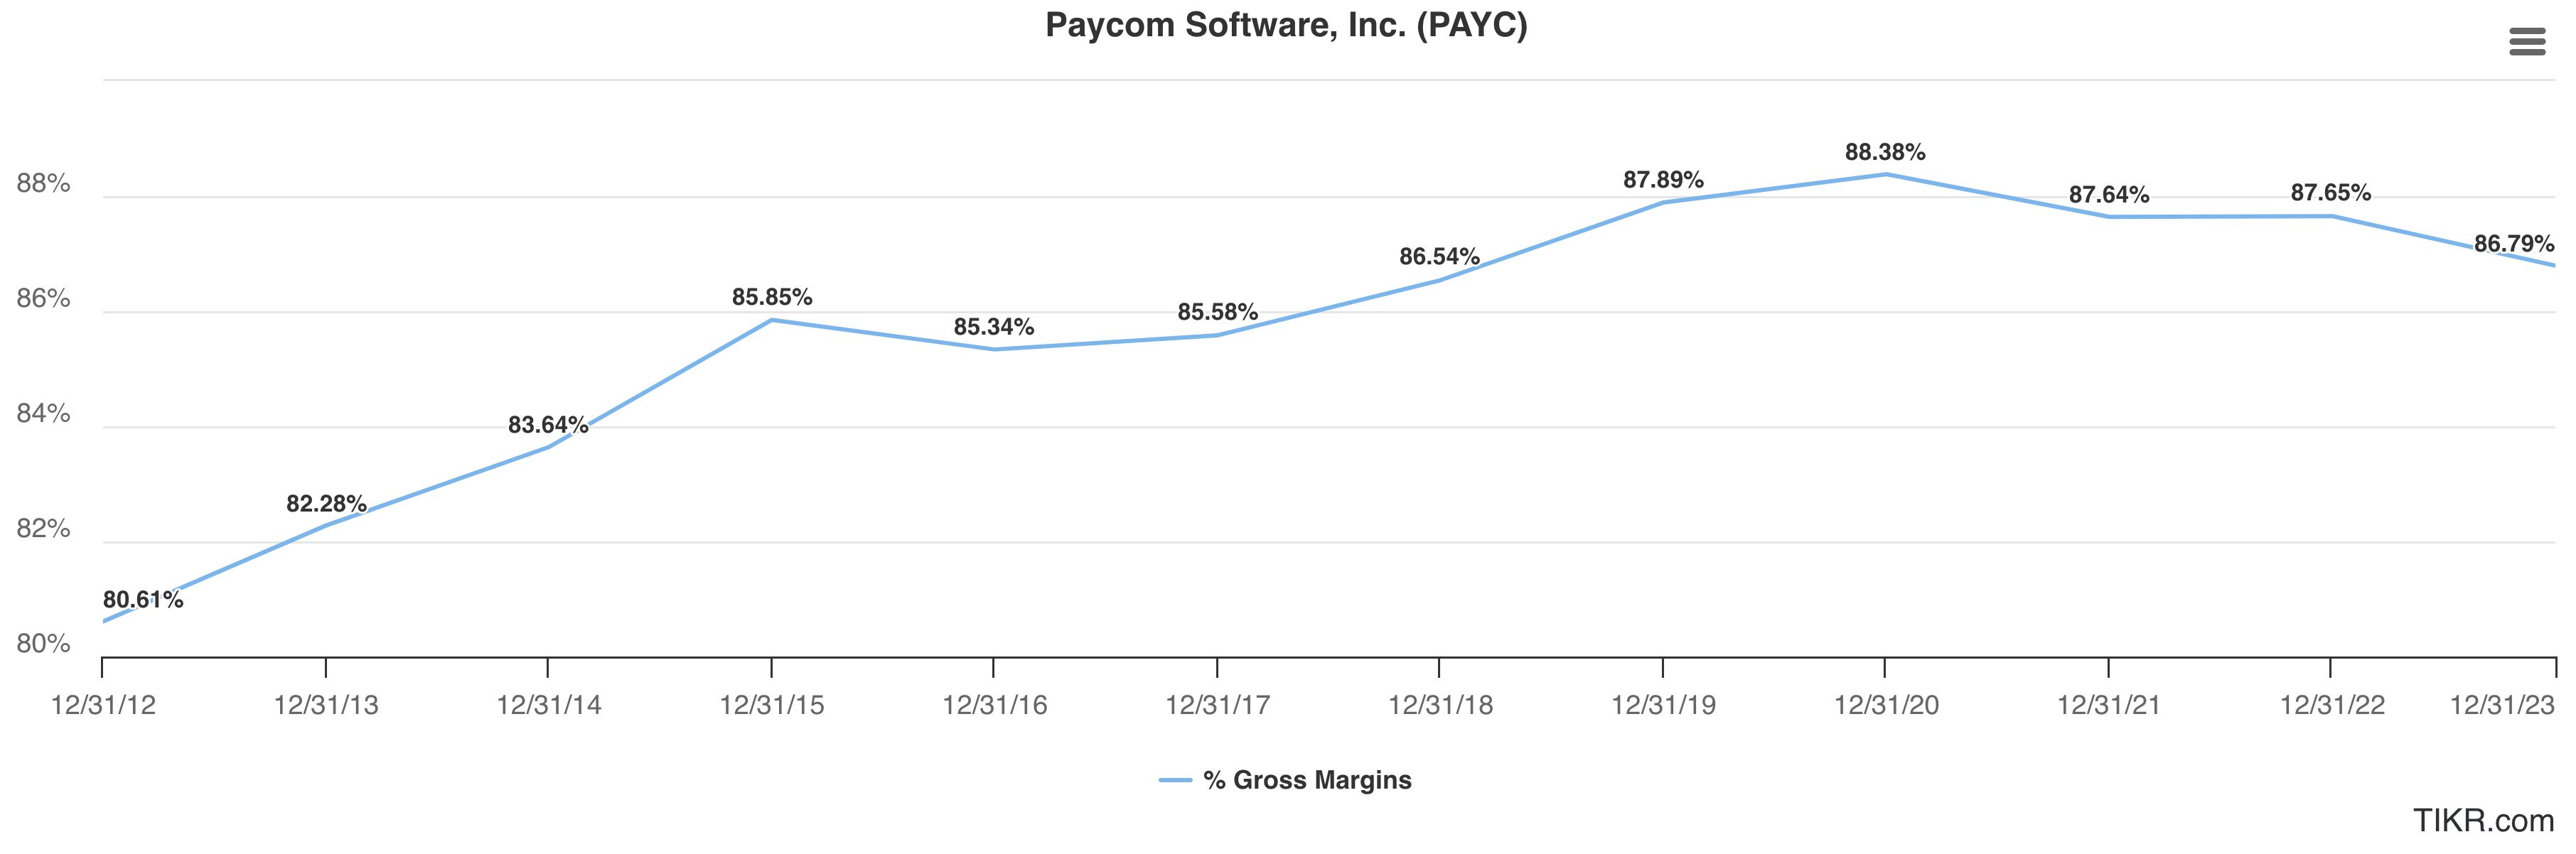
Gross margins well above 80%:
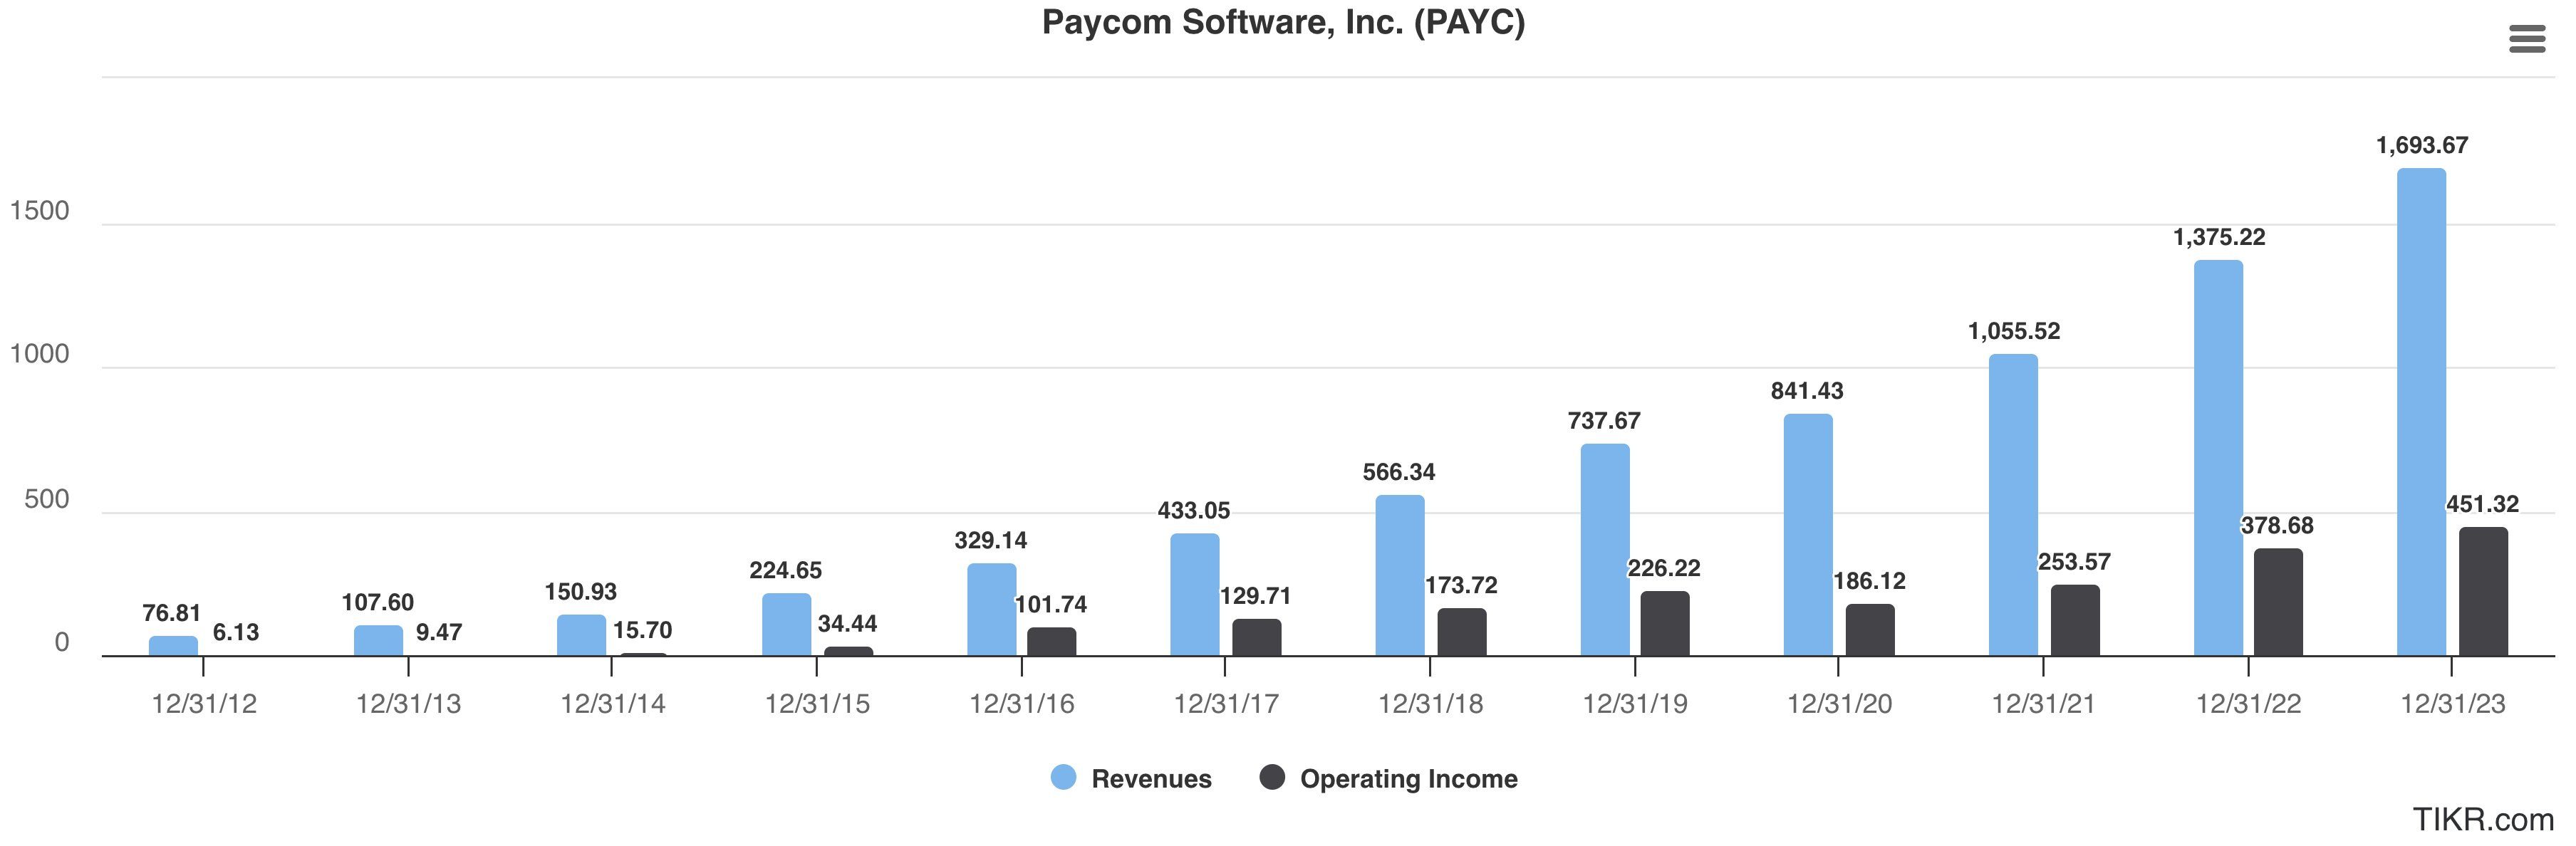
Revenue grew from 76M in 2012 to 1.7B today which represents a compounded annual growth of 33%:

As the operating profit margin expanded from 8% (that’s $6M on a $76M revenue), to 33% in 2023, representing more than $500M and almost $600M in EBIT over the last twelve months. Hence, operating profit grew at an even faster rate than revenue! A CAGR of more than 50% ...
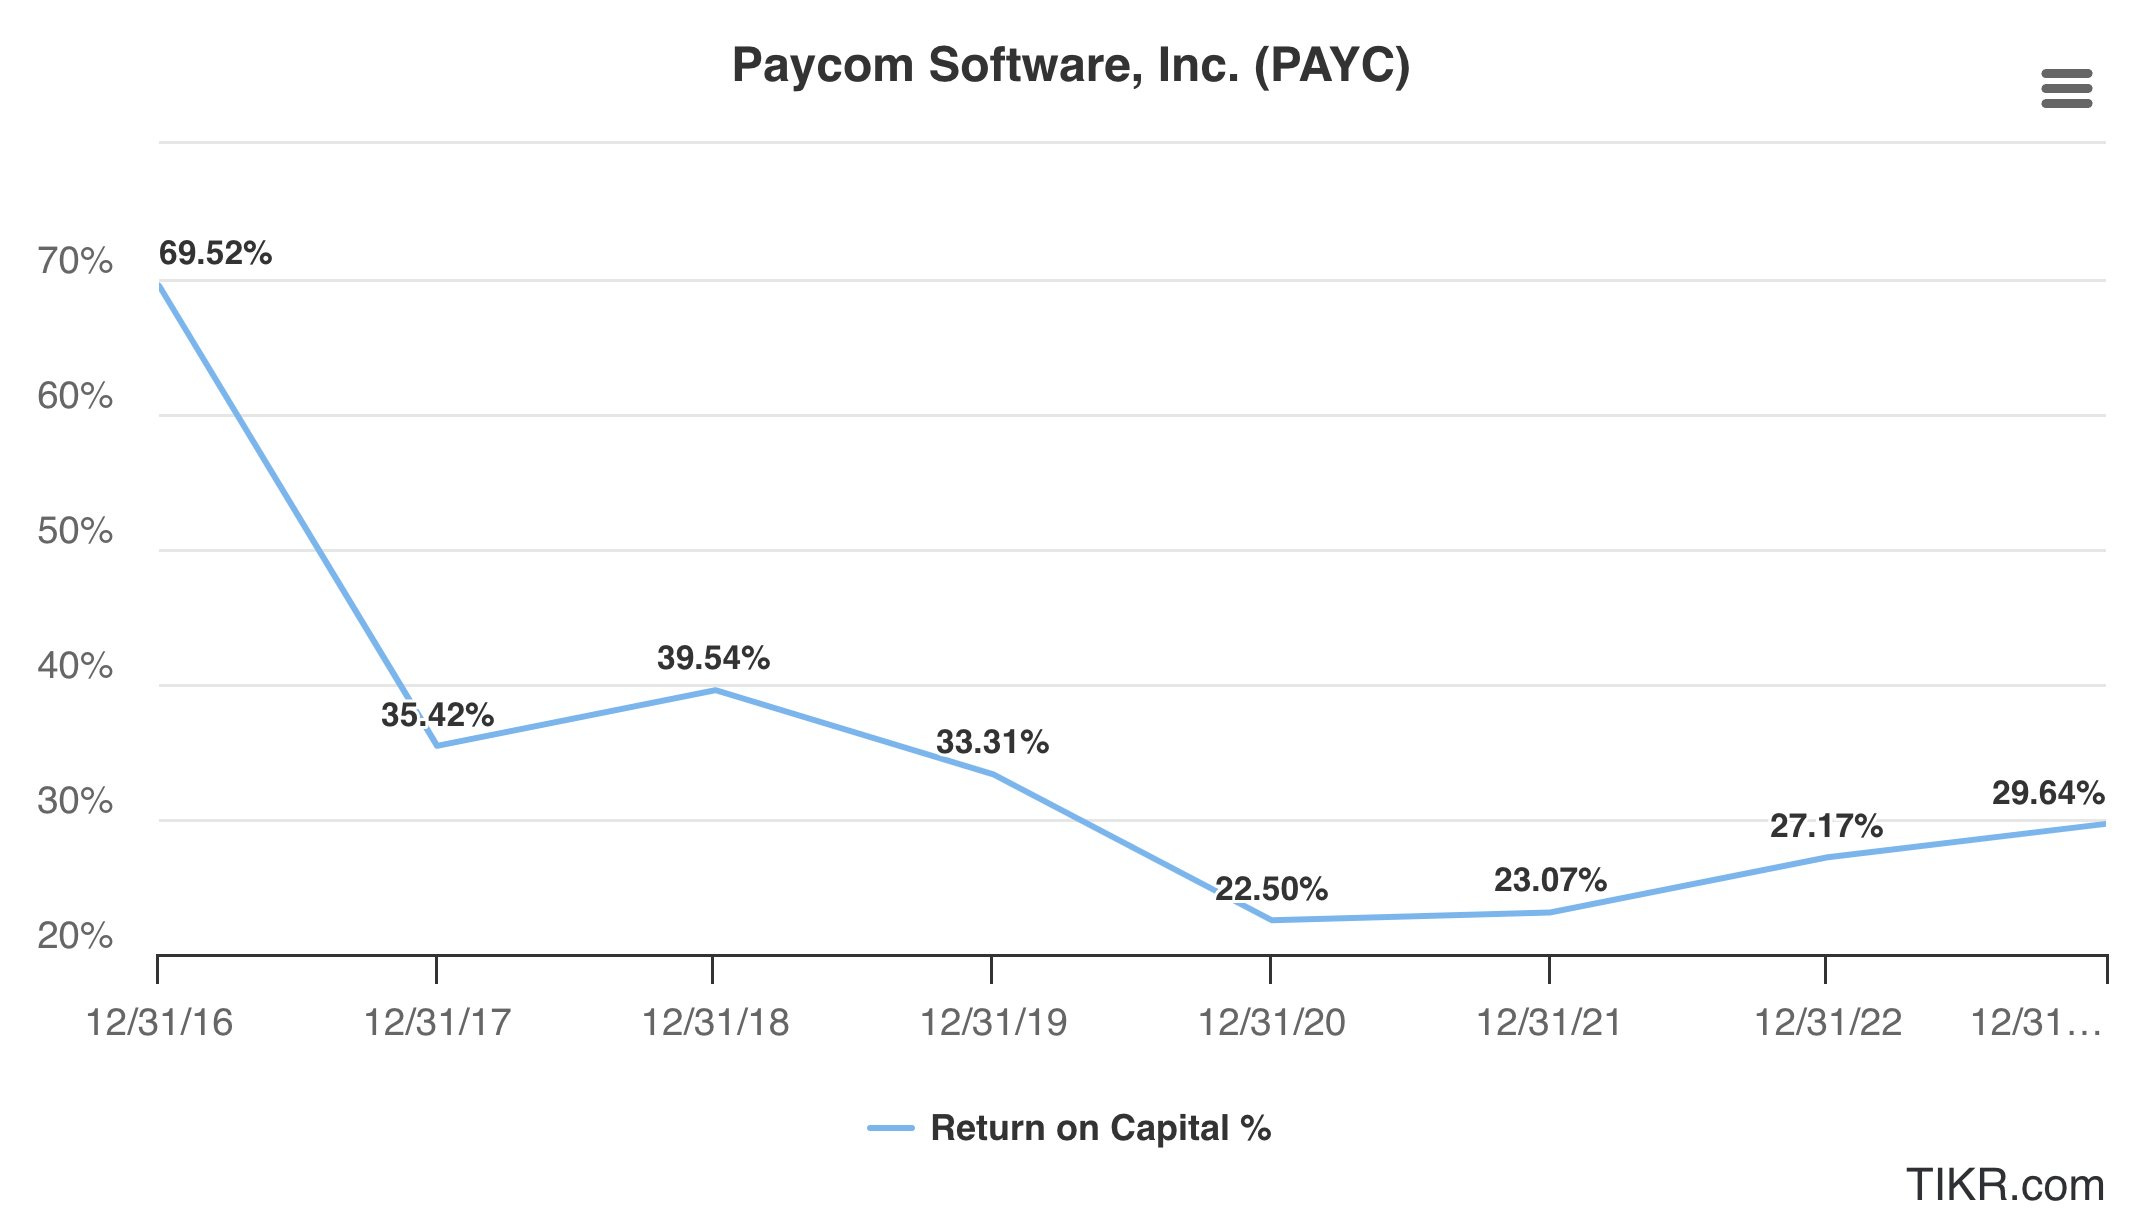
Based on the numbers above, it should come as no surprise that Paycom earned a very good return on its internal investments: between 20% and 30% in most years.
As of today, Paycom pays out 18.4% of its profits as a dividend, giving investors a dividend yield of 1%.
