

Revenue fell, margins jumped, and the most useful number in the release had almost nothing to do with the Switch 2.
Three months ago, in May, I published a long deep dive on Nintendo in which I argued that the market was still pricing a growth inflection as a legacy hardware cycle. I framed it as a hypothesis rather than a thesis, precisely so that quarters like this one could do their job, which is to tell me where I am wrong.
Deep Dive: Nintendo ($NTDOY)

Nintendo is no ordinary company. Founded in 1889 as a playing card manufacturer, it’s a story of survival, reinvention, and unlikely triumph.
Today, Nintendo reported its first quarter of the fiscal year ending March 2027, and I want to walk through what the print actually says, what it says about the seven pillars I laid out in May, and where my view has shifted. The full Q&A is not out yet, as I write this (I have to catch a plane in around three hours from now), so the comments are largely based on the results and slides shared and the added explanations.
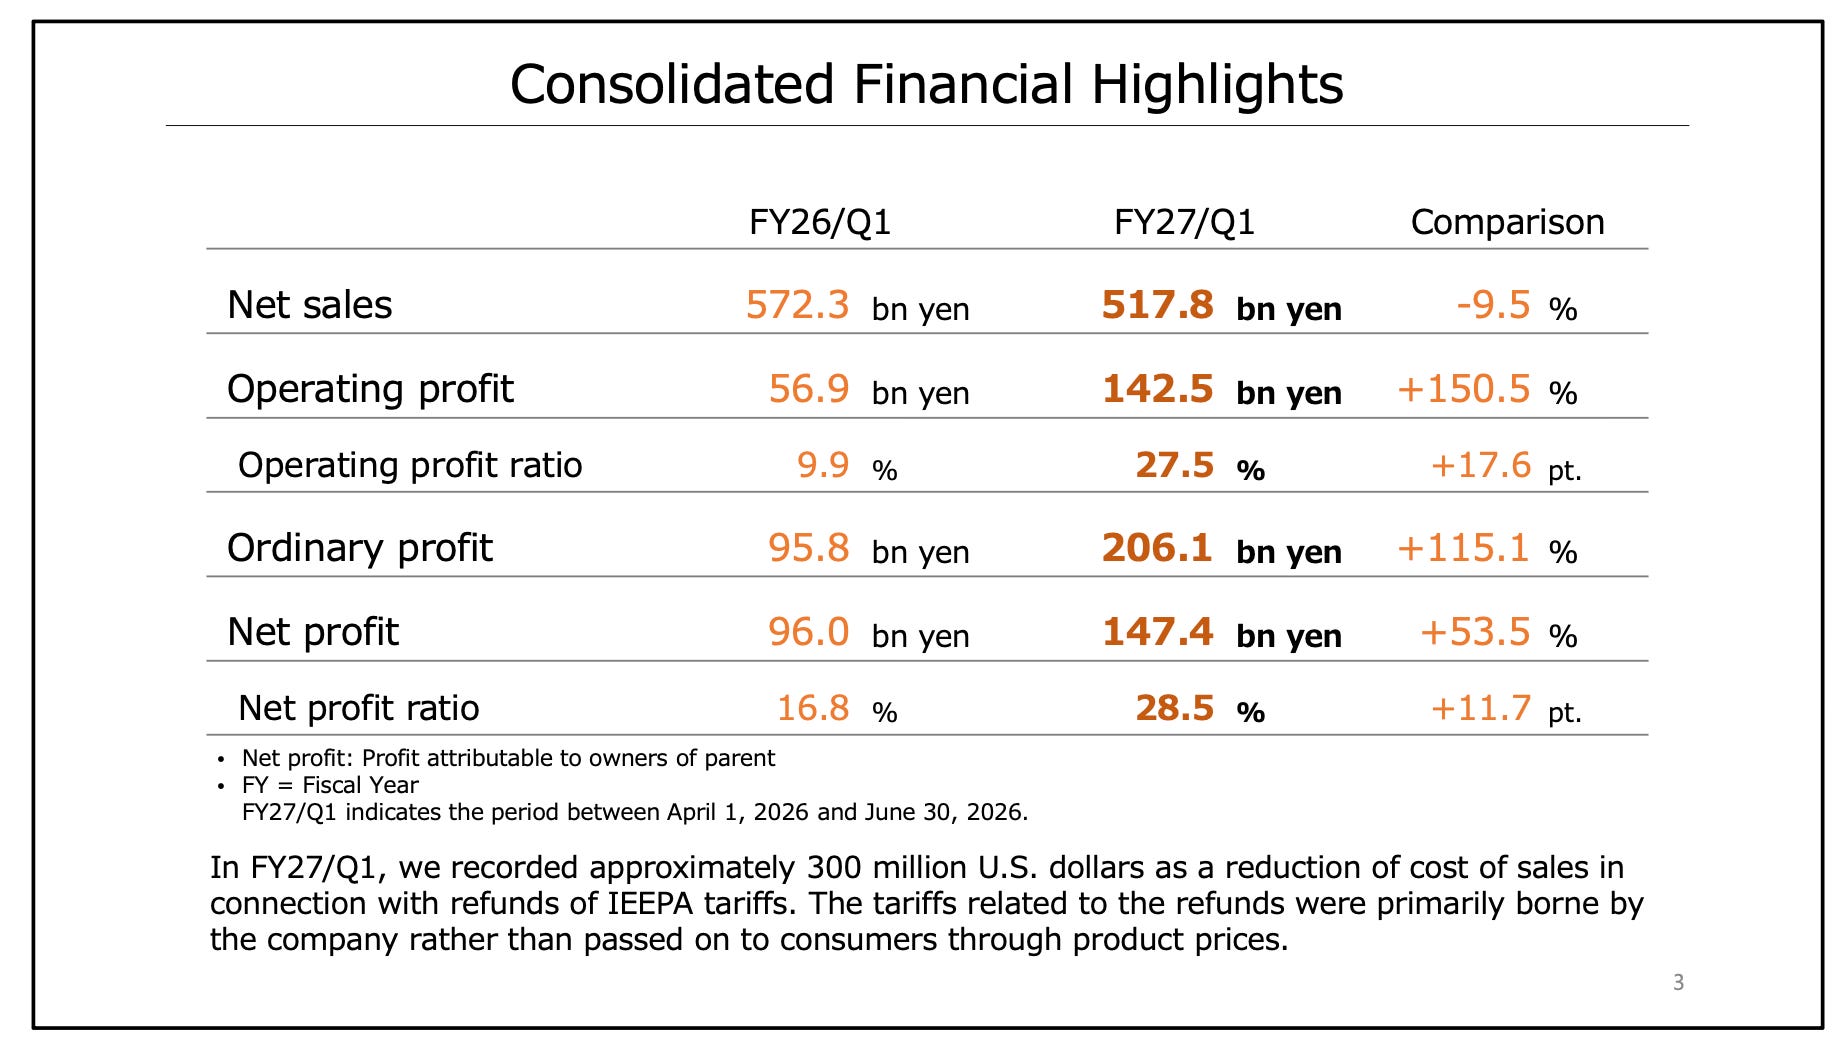
Net sales came in at 517.8 billion yen, down 9.5% year on year. Operating profit went the other way, up 150.5% to 142.5 billion yen, which lifts the operating margin from 9.9% to 27.5%. Ordinary profit more than doubled to 206.1 billion yen (close to 40% margins) and net profit rose 53.5% to 147.4 billion yen.
I think overall it’s an “okay” quarter; not more and not less.
Disclaimer: As of the date of publication the author owns no shares in the company; but that may change. The analysis presented in this blog may be flawed and/or critical information may have been overlooked. The content provided should be considered an educational resource and should not be construed as individualized investment advice, nor as a recommendation to buy or sell specific securities. I may own some of the securities discussed. The stocks, funds, and assets discussed are examples only and may not be appropriate for your individual circumstances. It is the responsibility of the reader to do their own due diligence before investing in any index fund, ETF, asset, or stock mentioned or before making any sell decisions. Also double-check if the comments made are accurate. You should always consult with a financial advisor before purchasing a specific stock and making decisions regarding your portfolio.
A 27.5% Margin That Is Really Closer to 18%
Two things flattered this print, and both are disclosed in plain sight. The first is roughly 300 million U.S. dollars booked as a reduction of cost of sales in connection with IEEPA tariff refunds.
“We recorded approximately 300 million U.S. dollars as a reduction of cost of sales in connection with refunds of IEEPA tariffs. The tariffs related to the refunds were primarily borne by the company rather than passed on to consumers through product prices.“
At the quarter’s average rate of 159.38 yen to the dollar that is about 47.8 billion yen, or a third of reported operating profit.
The second is currency, which added 39.0 billion yen to sales and about 22.2 billion yen to operating profit.
Strip out the refund and the operating margin lands near 18%. Strip out the currency help as well and you are in the mid-teens. Against 9.9% a year ago that is still a genuine improvement, and it is exactly the improvement the model predicts once hardware stops dominating the revenue mix. Hardware fell from 78.8% of platform sales to 55.3%.
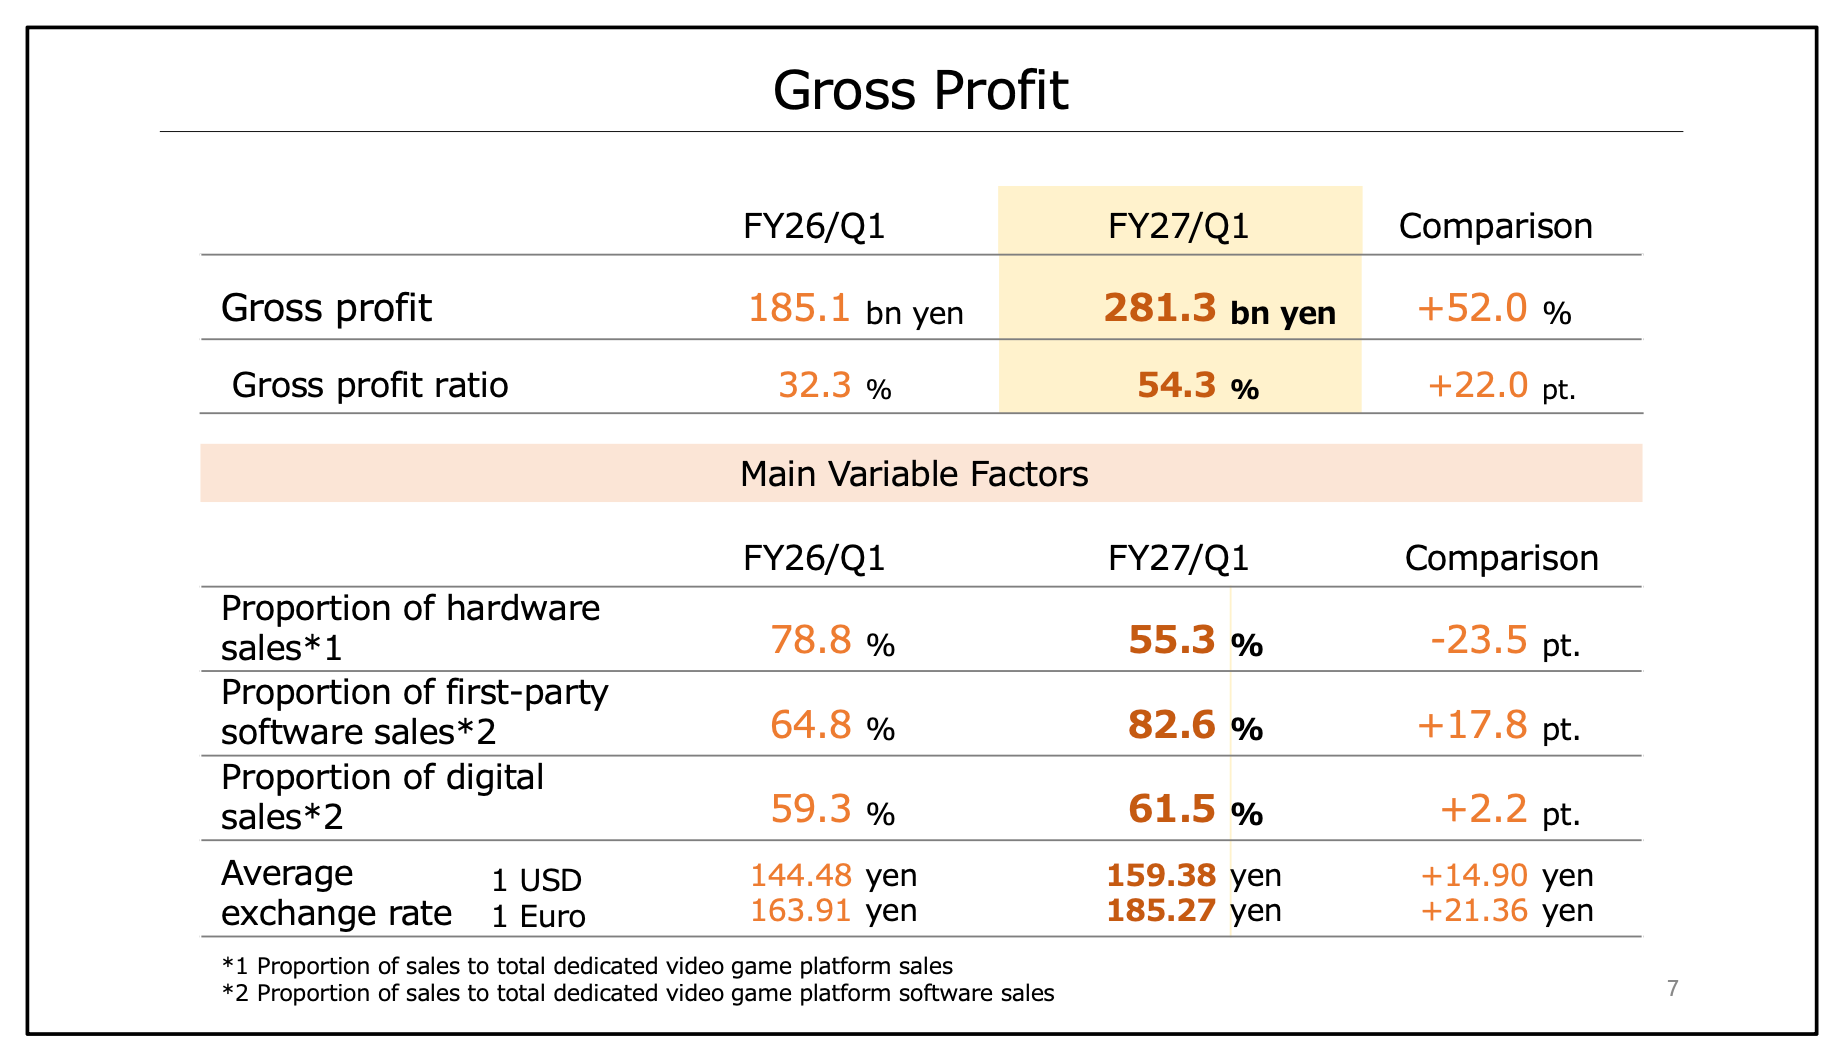
First-party software climbed from 64.8% of software sales to 82.6%.
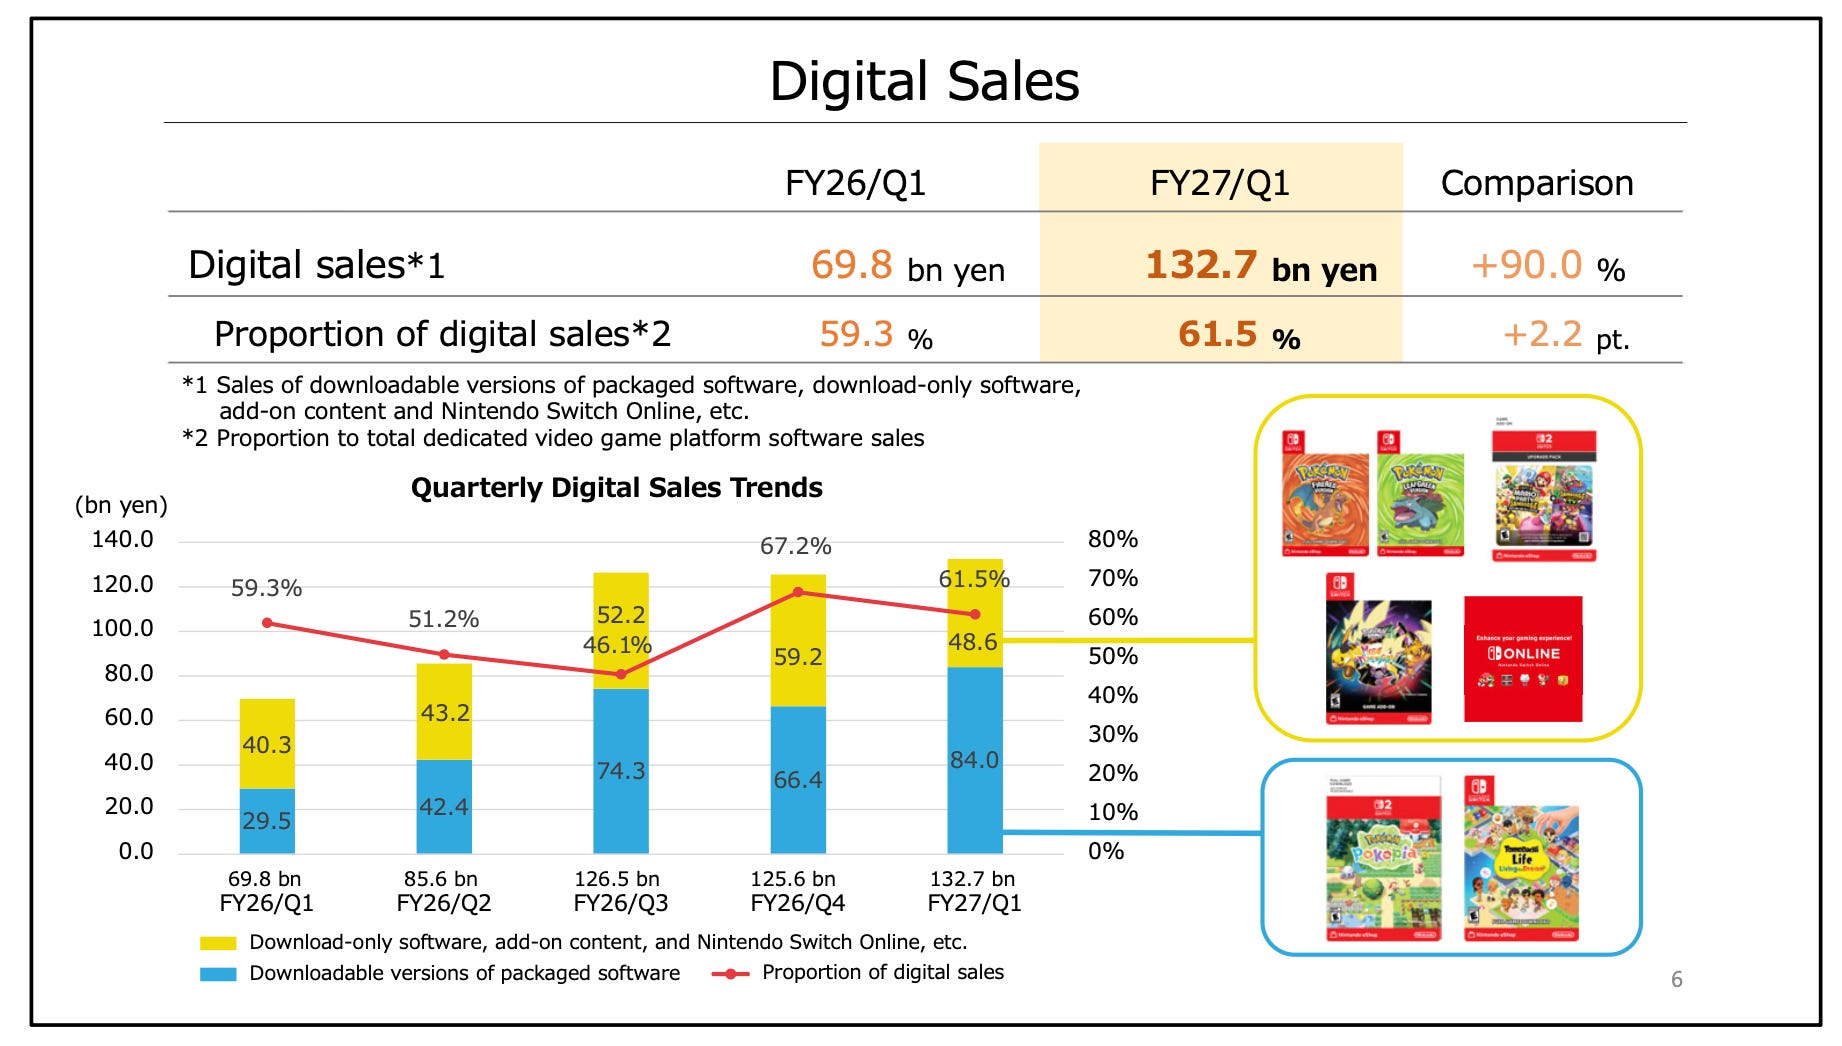
Digital reached 61.5%, up 2.2 points (but down from Q4; 67.2%), with digital sales up 90% to 132.7 billion yen.
On the refund itself: Nintendo booked it, and it intends to keep it. There is a class action in Washington arguing that the company should hand it back to the consumers who paid the tariff-inflated prices, and Nintendo’s lawyers filed a motion to dismiss in July, arguing that buyers “received exactly what they bargained and paid for.” I have no view on how a Washington court will rule. I do have a view on the accounting: this is a one-time item, it does not repeat, and anyone building a run-rate off Q1 needs to take it out.
Why Switch 1 Software Grew Four Times Faster Than Switch 2 Software
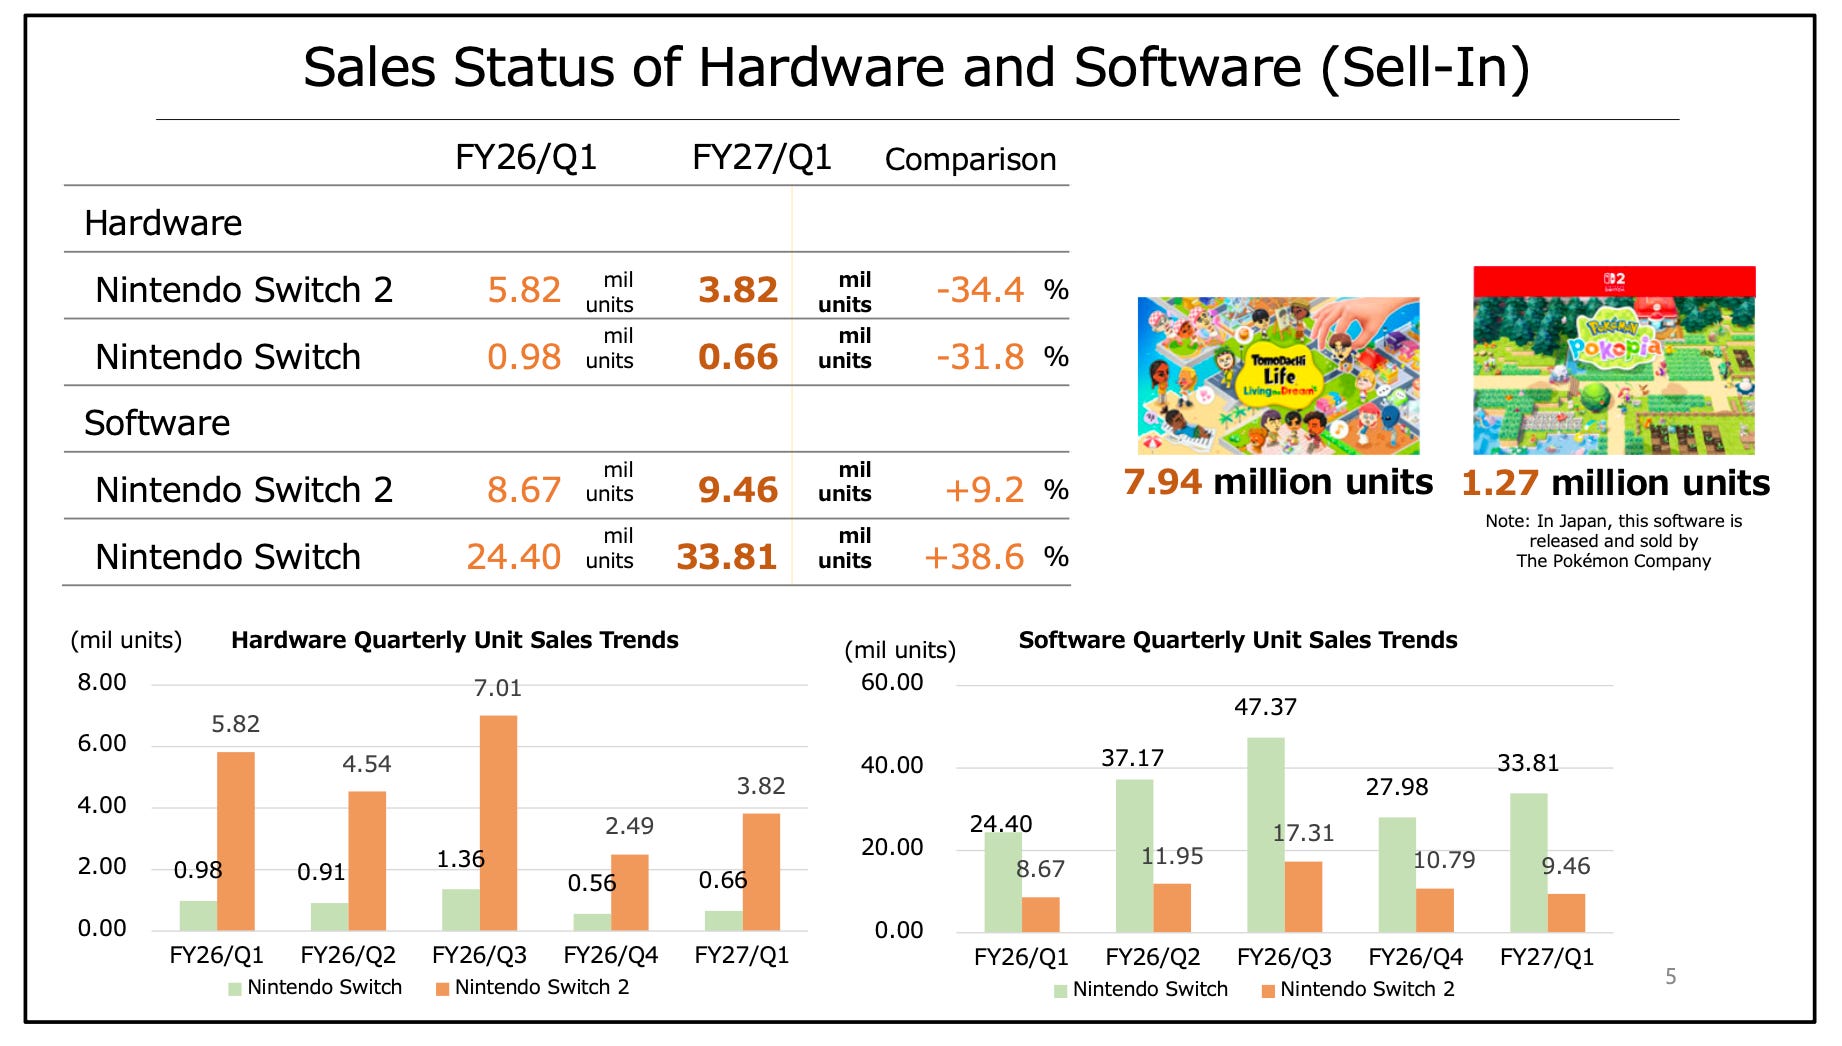
One line in this release stood out: Nintendo Switch 2 software sell-in grew 9.2% year on year to 9.46 million units. Nintendo Switch software, the nine-year-old machine, grew 38.6% to 33.81 million units. The old console outgrew the new one by a factor of four in its second year.
At first glance, this looks alarming.
Think about it for two minutes and it makes sense. A couple of reasons why:
Tomodachi Life: Living the Dream shipped 7.94 million units in the quarter and has now passed 8 million on a sell-through basis, and it is a Switch 1 title that runs beautifully on Switch 1 hardware.
Meanwhile the prior-year comparison for Switch 2 software is the launch quarter, when Mario Kart World was going out of the door inside hardware bundles by the million. Roughly 12.6 million Switch 2 software units were bundled with hardware across FY26. That is a brutal comp to lap.
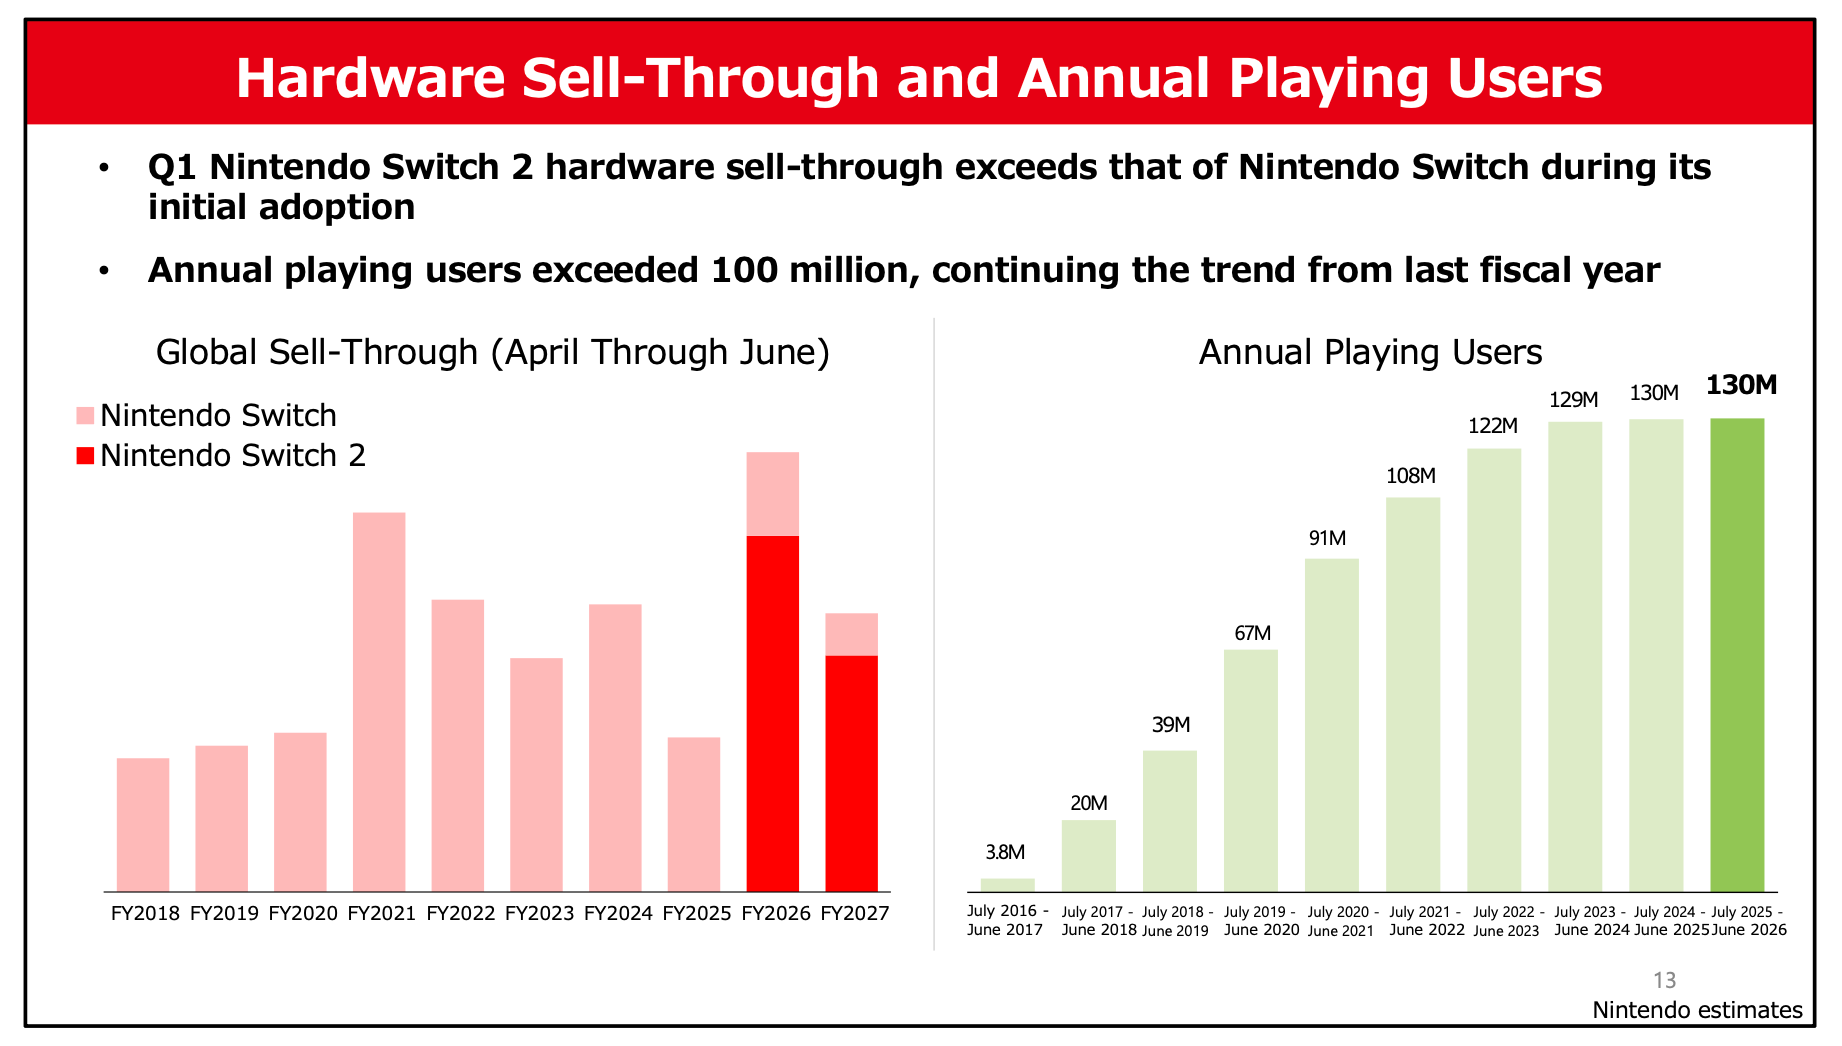
So the mix looks odd for good reasons. What I take from it is something I have believed since before the Switch 2 launched, which is that the depth of the Switch 1 catalogue is an asset rather than a drag. Nintendo is still monetizing an installed base of well over 100 million people while it builds the next one. Annual playing users came in at 130 million for the twelve months to June, holding the level from last year. The company earns money from those users whether they have upgraded or not.
Do Apple Investors Care Whether It Was a 16 or a 17?
Which brings me to something that has been bothering me about how this business gets analyzed, including by me. Analysts spend enormous energy splitting Switch 2 units from Switch 1 units, as though they were two companies. Switch 2 was 3.82 million of 4.48 million hardware units in the quarter, or 85% of the total.
Fine. That is roughly what anyone would have guessed. The split tells you almost nothing you did not already know.
Now look at the ecosystem as one thing, which is what it actually is. Total hardware sell-in fell 34% against a launch quarter, which is again, to be expected.
Total software sell-in rose 31%, from 33.07 million units to 43.27 million. That is the number I would put on the front page and place most emphasis on.
An ecosystem that moved 31% more software in its seasonally weakest quarter, in a year with no 3D Mario and no mainline Zelda, is not an ecosystem losing engagement.
Long-term Apple investors do not build their spreadsheets around iPhone 17 versus iPhone 16 versus iPhone 15 units. They look at total unit growth, installed base, and services attached to it. That’s what Nintendo investors should do too!
Nintendo is obviously not Apple, and the cadence is different, since we are five to seven years away from a Switch 3 rather than twelve months from the next iPhone model. But the direction of travel is the same, or at least similar.
Backward compatibility and Nintendo Accounts turned two generations into one continuous base, and over time users migrate as the Switch 2 exclusives pile up. There may even be an Apple-style forcing function at the far end of this, when Nintendo eventually stops supporting Switch 1 the way Apple retires an iOS version. That is a 2035 problem presumably, but it will be another incentive to migrate eventually.
The Pipeline Is Still My Biggest Complaint, and the Tie Ratio Proves It
I want to hold my own hypothesis to the fire here, because this is where the May piece looks most optimistic in hindsight. In the deep dive I quoted Ryan O’Connor’s analysis that the Switch 2’s implied twelve-month tie ratio of 3.74 essentially matched the original Switch’s 3.71. We now have thirteen months of actual data rather than an extrapolation. Life to date, Nintendo has sold 23.68 million Switch 2 units and 58.17 million Switch 2 software units. That is a tie ratio of 2.46. Take out the roughly 13 million bundled copies and you are at about 1.9.
The comparison to Switch 1’s first year is not perfectly clean, since bundling practices differ and the Switch 2 base is younger on average, which mechanically depresses the ratio. Even allowing generously for both, the extrapolation was too kind. Software per console is running below where the bull case had it.
I do not think this breaks the hypothesis. I think it dates it. The pillar I called the system-seller flywheel was explicitly premised on the idea that the flywheel had not started yet, and thirteen months later it still has not! (which is disappointing to say the least)
The titles that move the needle are Mario, Zelda, Mario Kart, Animal Crossing and Smash Bros. Since launch, the Switch 2 has had exactly one of those. Yoshi and the Mysterious Book in May, Star Fox in June, Splatoon Raiders in July. Perfectly decent games. None of them is a system seller.
The back half of the year looks materially better. Fire Emblem: Fortune’s Weave lands on 17 September, Nintendo Switch Sports Resort on 22 October, and The Legend of Zelda: Ocarina of Time is scheduled for sometime this year, which is the most interesting item on that list by a distance.
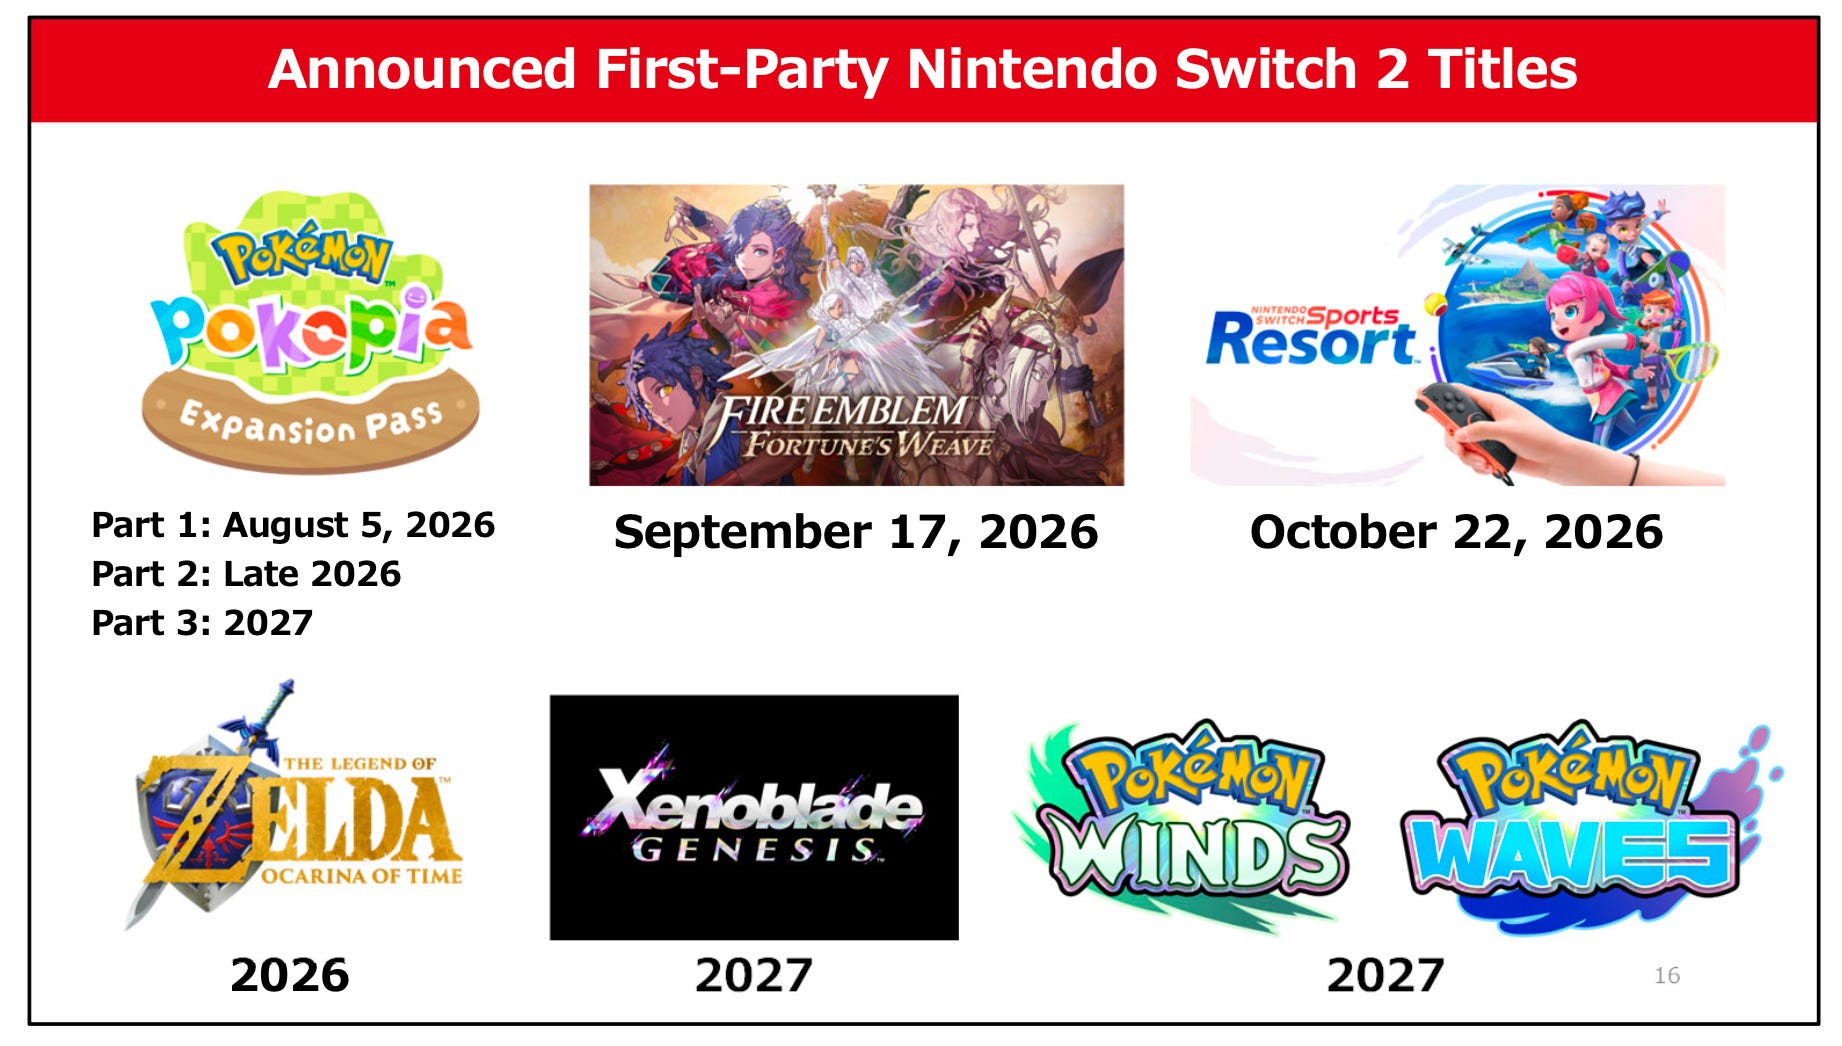
Pokémon Winds and Pokémon Waves arrive in 2027, as does Xenoblade Genesis.
Still no 3D Mario announced. No Nintendo home console has ever gone two holiday seasons without one, and October is where they have historically been placed, so I would treat the absence of an announcement as a timing question rather than a strategy question.
But it remains an open question, and the release cadence is the single sharpest criticism I have of this company right now. The hardware execution has been close to flawless. The first-party software cadence has been underwhelming, and my hypothesis still depends on them fixing it.
Nintendo Just Put a Number on the Memory Problem
In May I argued that the memory panic was overdone, mostly because software carries around 90% of operating profit and hardware margin compression is therefore a smaller lever than the market assumed. I still believe the second half of that. The first half deserves an update, because the input side got worse, not better. DRAM contract prices jumped roughly 60% quarter over quarter in Q2 of this year, and TrendForce expects a further 13% to 18% in Q3. Samsung and SK Hynix are both signalling that shortages persist into 2027 and possibly beyond. This is not a spike that reverses next quarter.
What has changed is that we now have Nintendo’s own number instead of a narrative. The FY27 guidance, unchanged from 8 May, has roughly 100 billion yen of higher component costs and tariff effects baked directly into cost of sales. That is a quantified, disclosed headwind of about 5% of forecast revenue, and Nintendo is still guiding operating profit up 2.7% to 370 billion yen despite absorbing it. That is the answer to the memory question, and it is a considerably more useful answer than any stress test.
Nintendo also did the thing the deep dive flagged as the obvious lever and raised prices. Japan went from 49,980 yen to 59,980 yen on 25 May, a 20% increase, with the United States moving from $449.99 to $499.99 on 1 September and Europe seeing a smaller bump. Nintendo Switch Online pricing went up too. Furukawa’s framing was that carrying the higher costs indefinitely would make the business unviable, which is about as blunt as this management team gets. And importantly, in the Q1 filing, the company reports that Japanese sell-through held up after the increase. That is a small data point and I would not over-read a single quarter of it, but pricing power in the one market that already absorbed a 20% hike is worth more to me than most of what was in this release.
There is a second-order effect worth planning for. The Western price rise takes effect on 1 September, which sits inside the July to September quarter. Expect some pull-forward of demand into Q2 as buyers move ahead of the deadline, and expect that to make Q2 hardware look better than the underlying trend, with a corresponding payback later.
121 Billion Yen of Concrete in Kyoto
Slightly buried at the back of the deck: Nintendo is building a Technology Development Center in Minami-ku, Kyoto, on land acquired from the city in 2022. Nine floors above ground, roughly 49,300 square metres, completion planned for March 2029, at a current estimated construction cost of 121 billion yen (about $660 million). That sits alongside a forecast R&D spend of 190 billion yen this fiscal year, up from 143.7 billion in FY25. R&D in the quarter alone was 49.1 billion yen, up 26%, while advertising fell 22.9%.
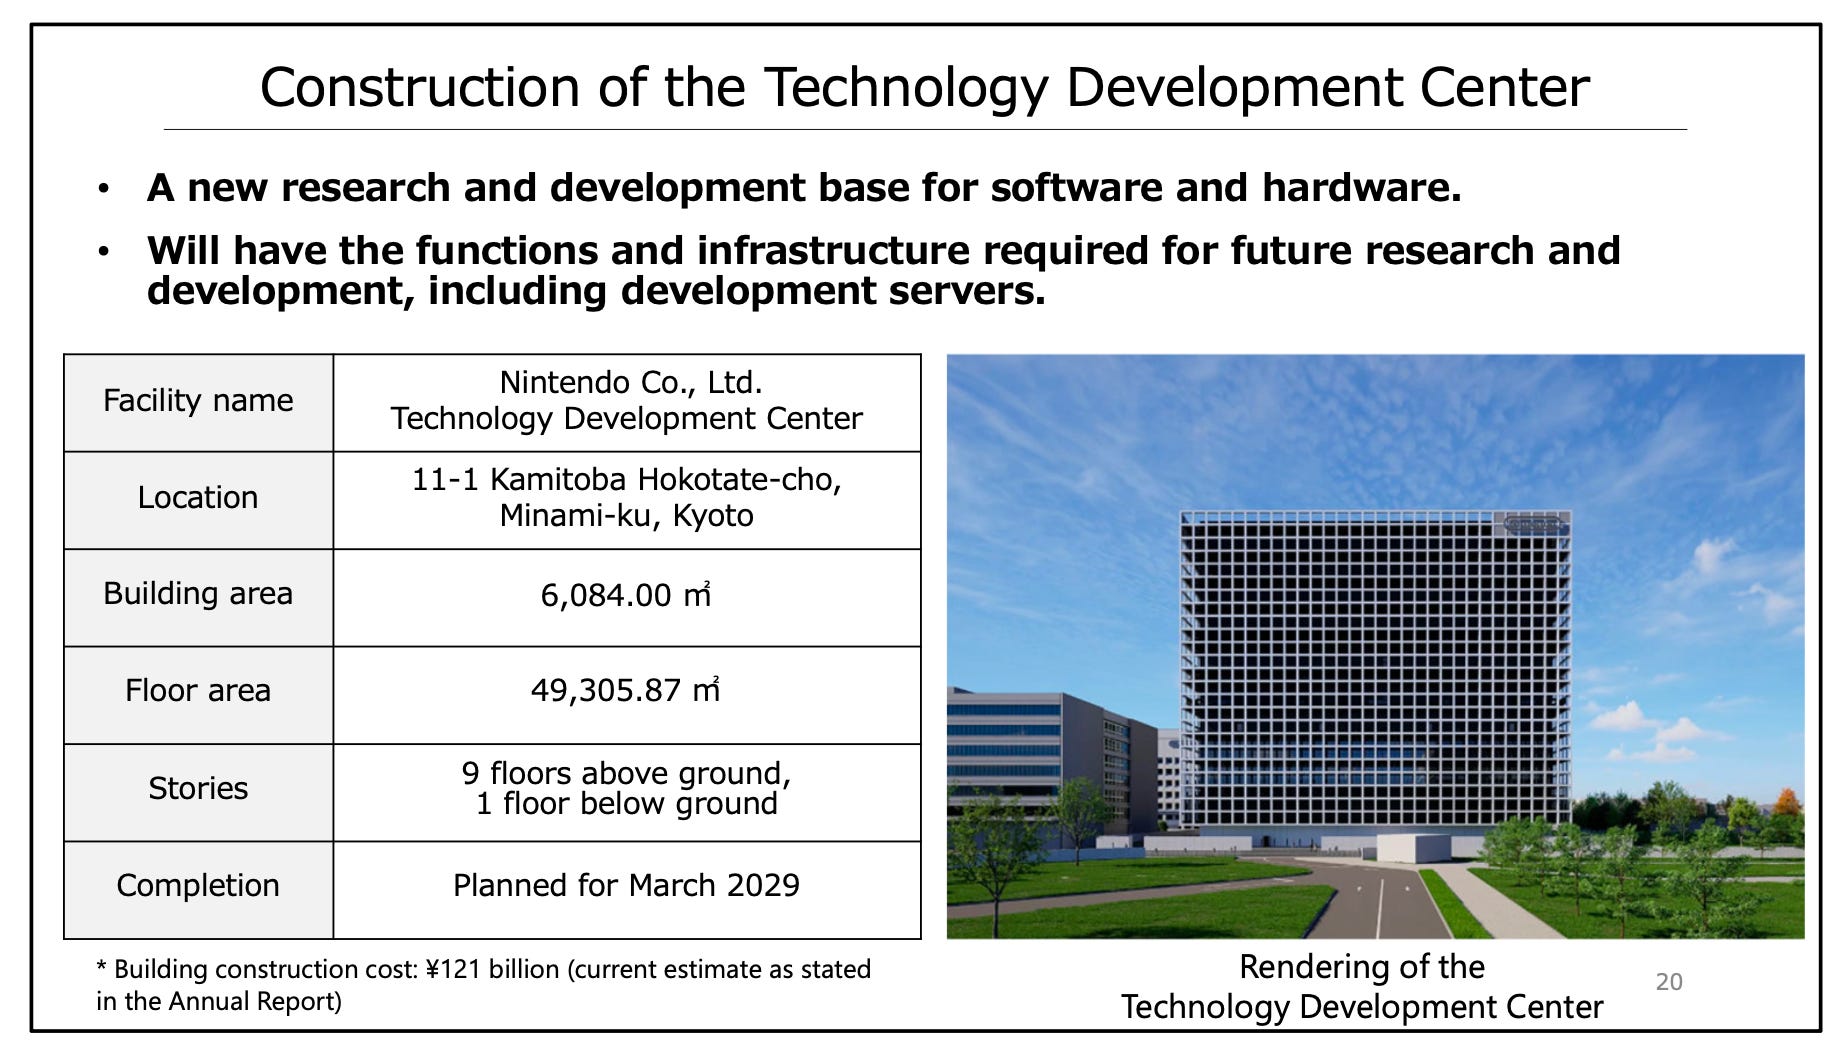
I like this a lot more than the market probably will. The most common criticism of Nintendo’s capital allocation, which I made myself in May, is that the cash pile sits there doing nothing while shareholders wait. Spending it on development capacity and headcount is the version of capital allocation I actually want from this company, given that the entire hypothesis rests on their ability to produce more AAA software more consistently. Whether it works is a 2029 question. The intent is the right one.
Where This Leaves the Hypothesis
Guidance is unchanged: 2,050 billion yen of net sales, down 11.4%, operating profit of 370 billion, up 2.7%, and a dividend cut from 219 to 162 yen, which is mechanical rather than a signal since the payout ratio is holding near 60% on a lower net profit forecast.
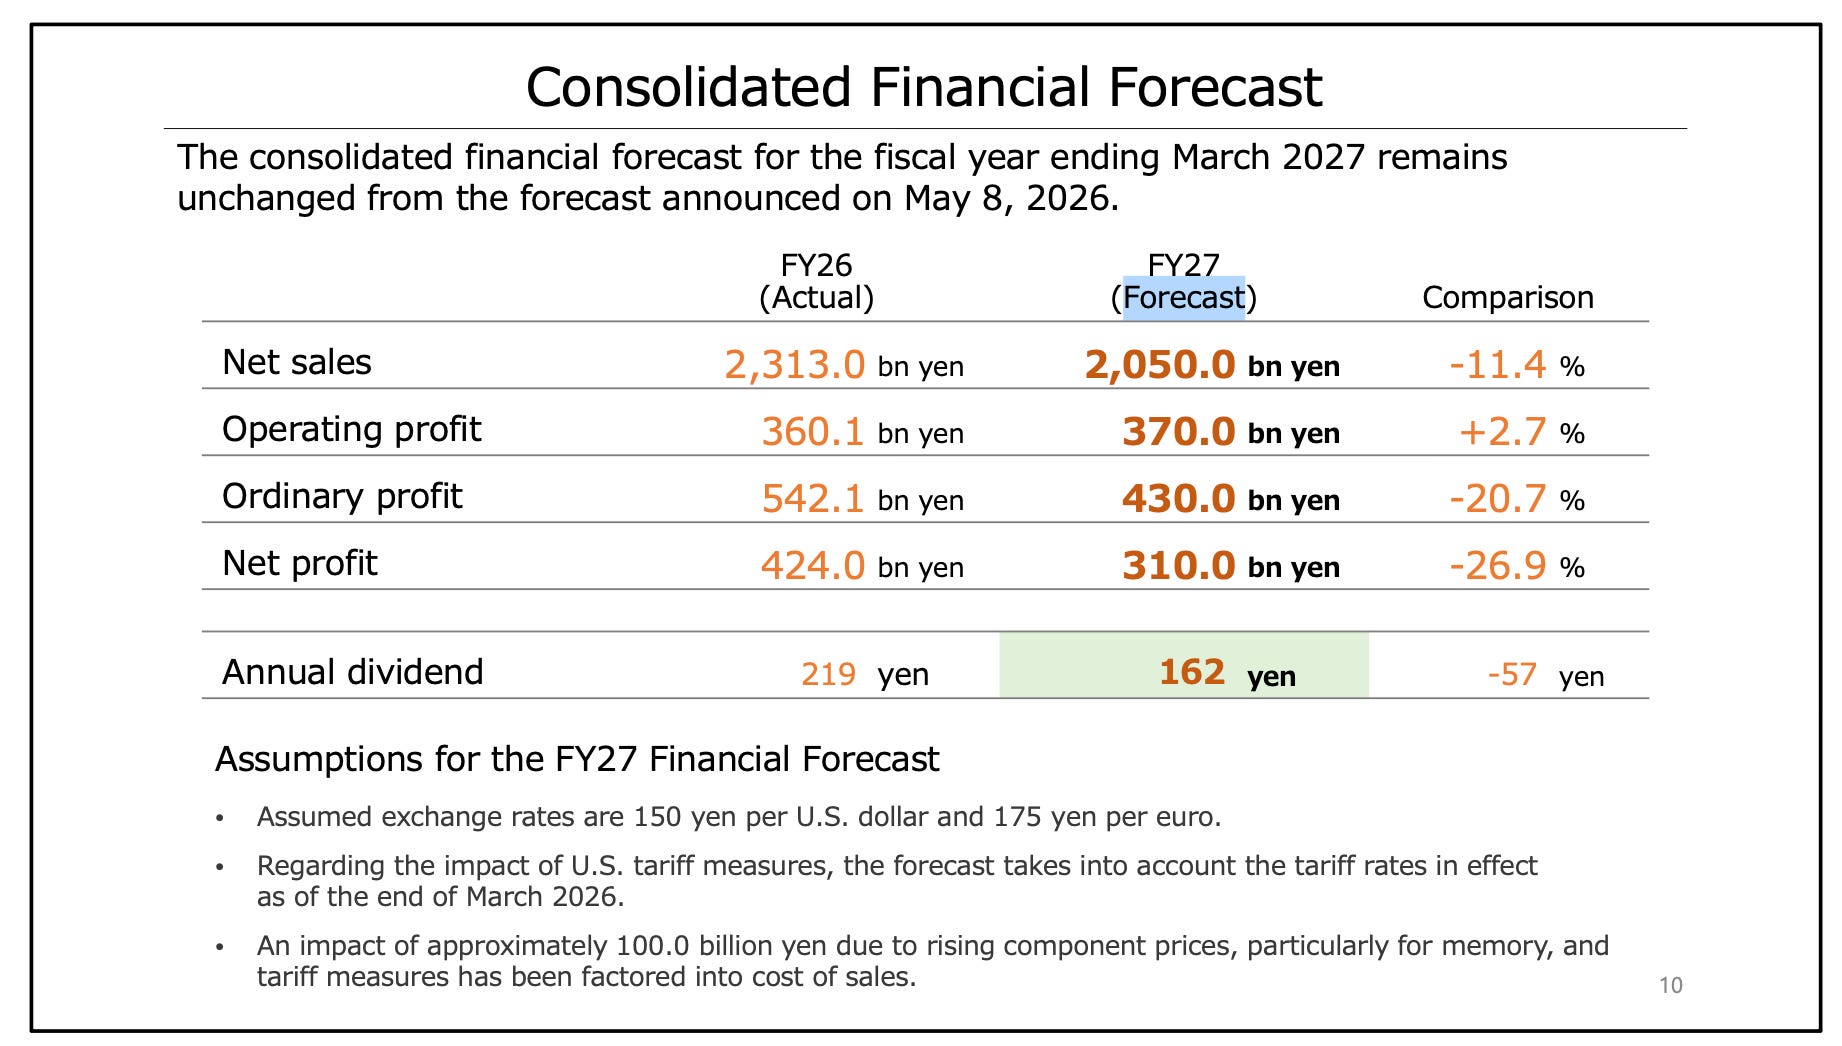
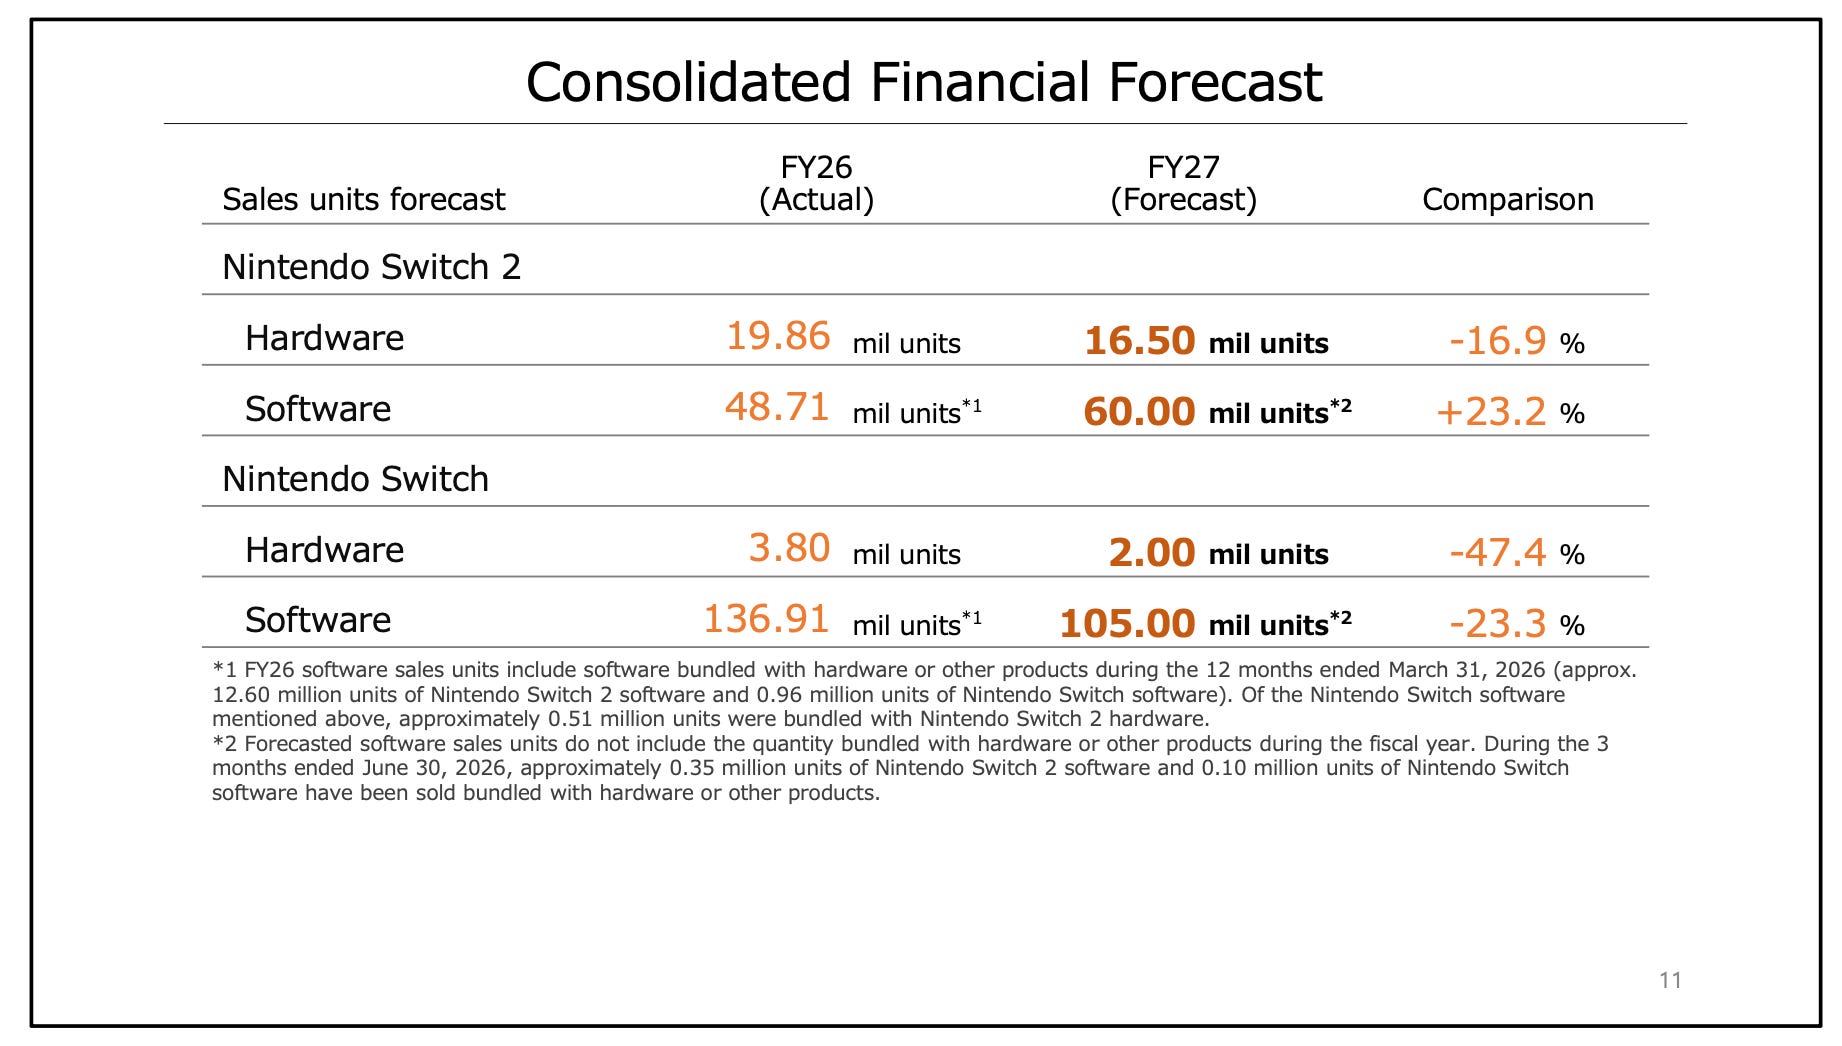
Run the pacing and that guidance looks conservative; as always for Nintendo. Q1 delivered 38.5% of the full-year operating profit target, and even stripping the tariff refund it delivered 25.6%, in the seasonally weakest quarter of the year. On units, roughly 42.8 million of the 165 million software target came in Q1, which is 26% of the year before the two strongest quarters have started and before any new AAA title was released or announced. Hardware is pacing at 24% of the 18.5 million target, and Switch 2 needs 12.68 million units over the remaining three quarters against 14.04 million in the equivalent stretch last year, with a holiday season, a price-hike deadline, and a better release slate in between. I would be surprised if Nintendo does not raise numbers at some point in the second half.
Was the quarter better or worse than what was priced in? The revenue decline was expected and everyone knew it was coming. The margin recovery holds up even after you strip the one-offs out. My honest read is that Q1 marks the trough of the year on almost every line, and the year-on-year comparisons get easier from here.
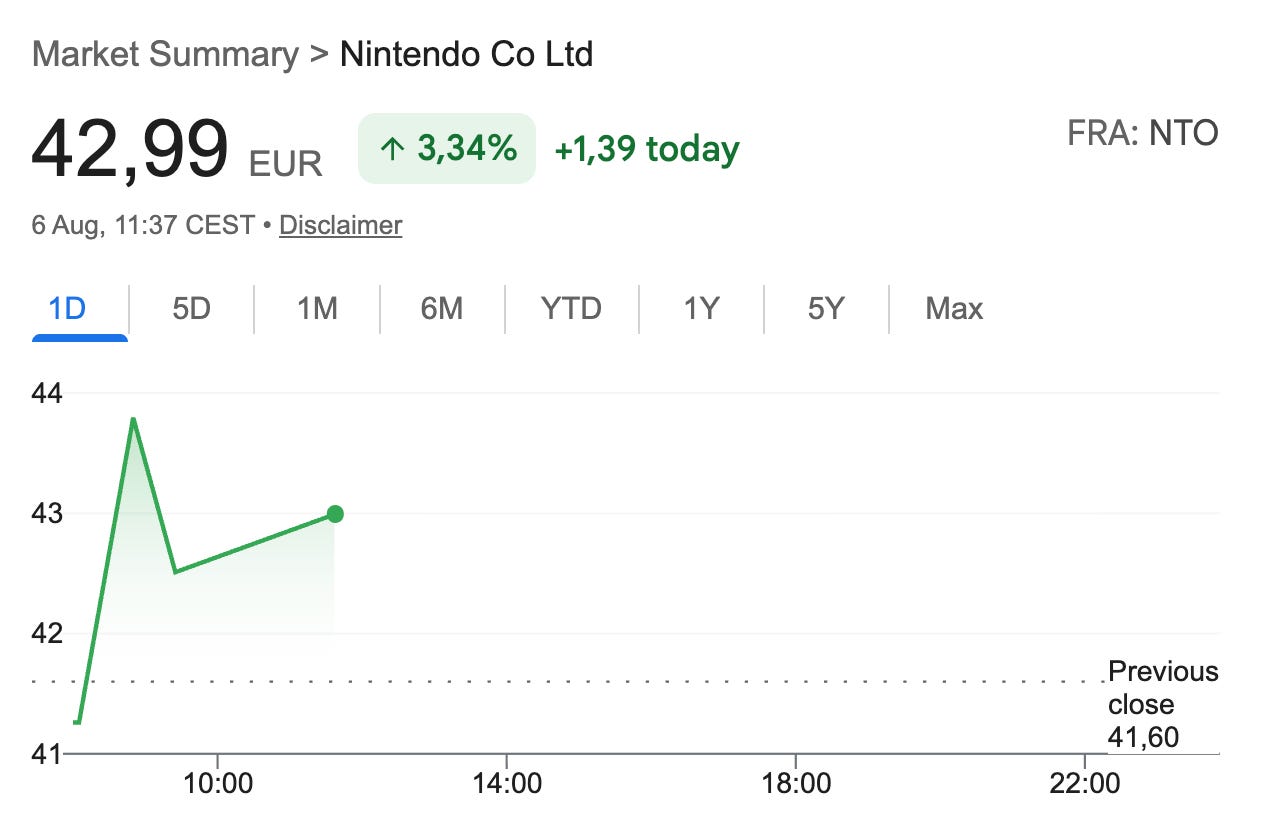
Nintendo’s stock is up 3% in Frankfurt trading as I type this.
The pillar I would now watch hardest is the one I already flagged as the core of the whole thing. Games sell hardware. Nintendo has 23.68 million Switch 2 owners waiting for a reason to buy their fourth and fifth game, and the company has not yet given them one. If Ocarina of Time and a 3D Mario land in the next twelve months, the tie ratio problem solves itself and this quarter looks like the bottom of a very ordinary trough. If they slip again into 2027, I will have to revisit whether the back-loading strategy is discipline or drift.
Disclaimer: As of the date of publication the author owns no shares in the company; but that may change. The analysis presented in this blog may be flawed and/or critical information may have been overlooked. The content provided should be considered an educational resource and should not be construed as individualized investment advice, nor as a recommendation to buy or sell specific securities. I may own some of the securities discussed. The stocks, funds, and assets discussed are examples only and may not be appropriate for your individual circumstances. It is the responsibility of the reader to do their own due diligence before investing in any index fund, ETF, asset, or stock mentioned or before making any sell decisions. Also double-check if the comments made are accurate. You should always consult with a financial advisor before purchasing a specific stock and making decisions regarding your portfolio.