

Fellow compounders,
I spent my morning with Hayden Capital’s Q2 letter, and I came away wanting to do some calculations myself. Fred Liu builds most of the letter around an equation he first presented at a Corner of Berkshire & Fairfax meetup nine years ago:
Earnings growth equals return on invested capital multiplied by the reinvestment rate.
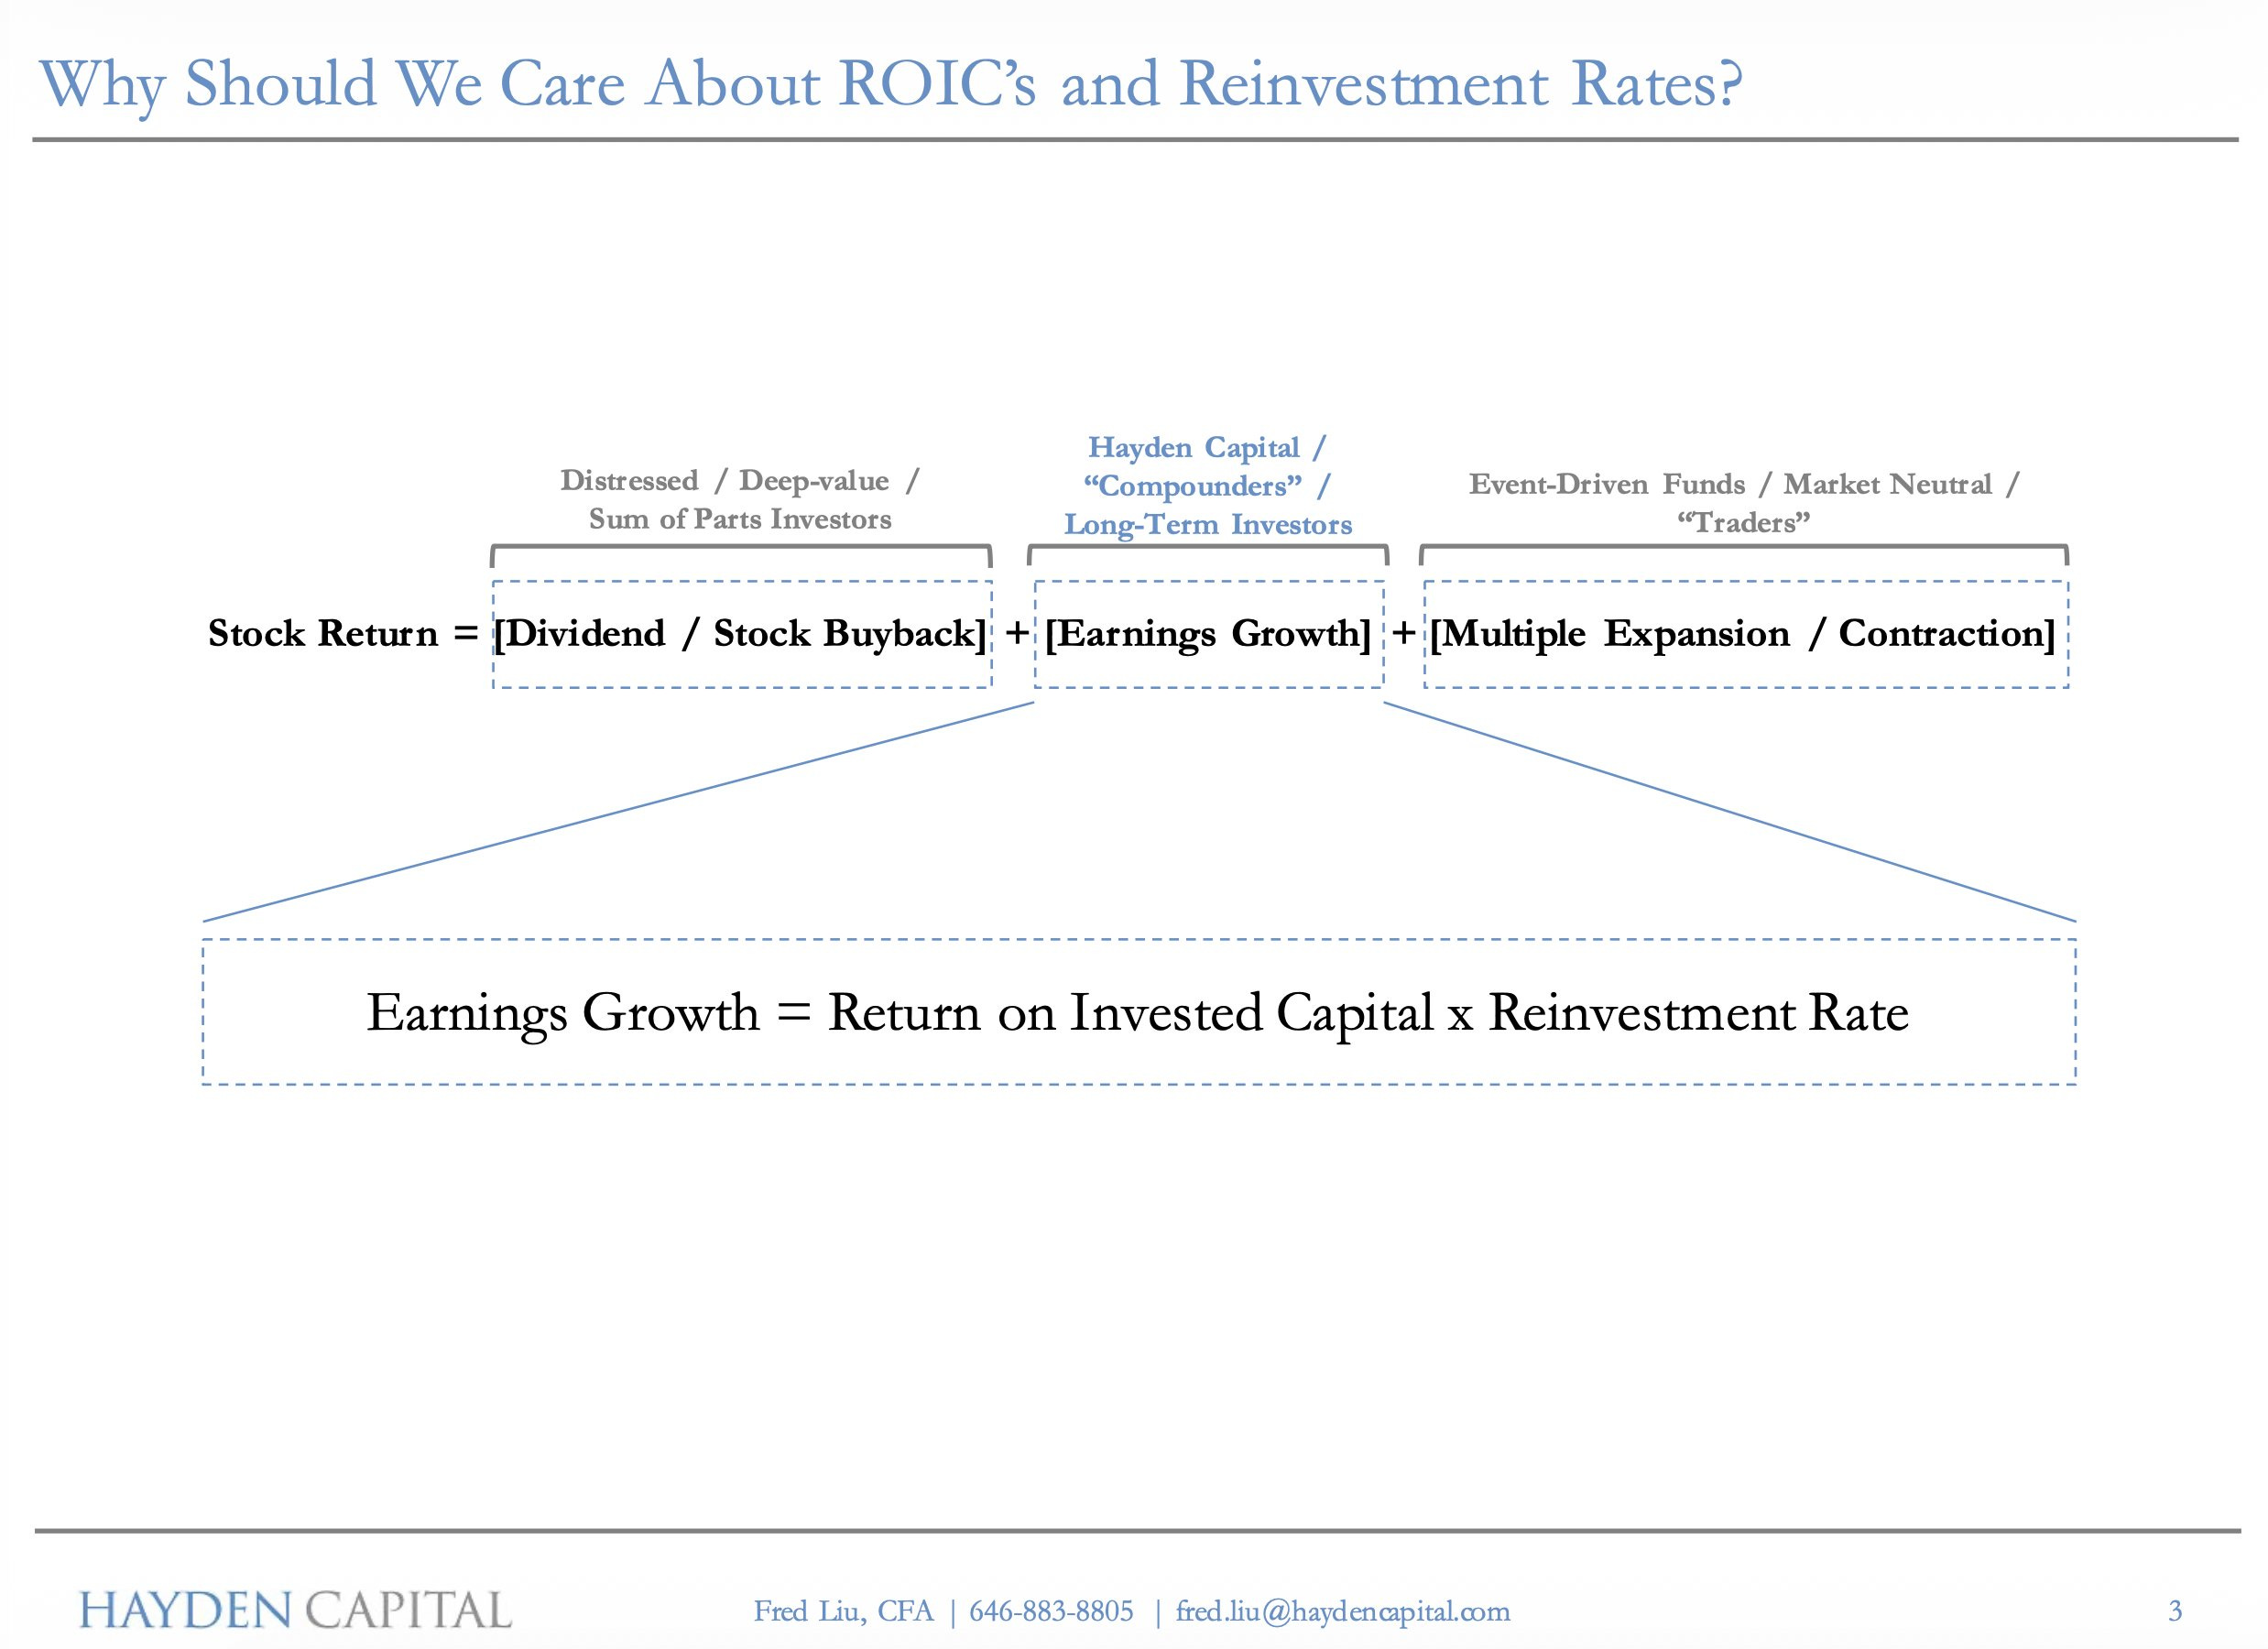
If you want to read more about the presentation, I wrote a short thread on it recently here.
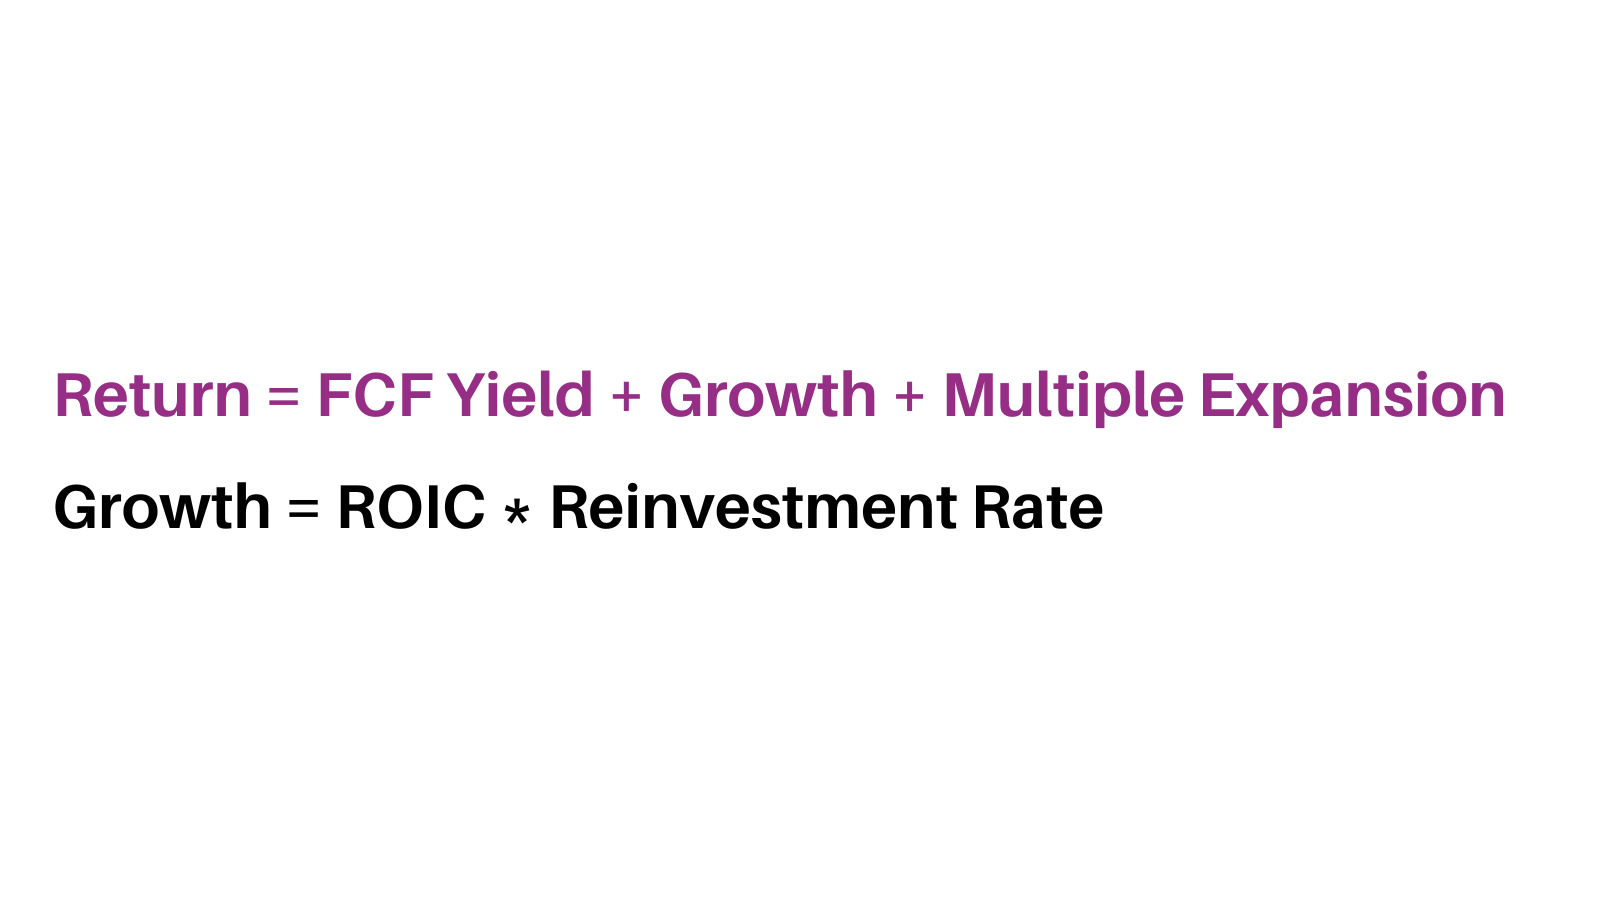
That concept is something I have been very vocal about myself for some time. I regularly share the following “illustration” on my socials, highlighting that those are arguably the two most important formulas in all of investing; which is a bit of an overgeneralization, to be fair.
What makes the letter worth your time, if you consider yourself a more seasoned investor, is maybe the second half, where he stops explaining the framework and starts using it.
He runs the numbers on Mercado Libre’s logistics push, tallies up roughly $2.2 billion of cumulative reinvestment spend since mid-2025, divides it by the incremental customers that spending pulled in, and arrives at about $296 of investment per additional buyer.
From there he works forward to what those customers are worth as their cohorts mature, and lands on an incremental return somewhere between 18% and 37% depending on what steady state contribution margins you underwrite.
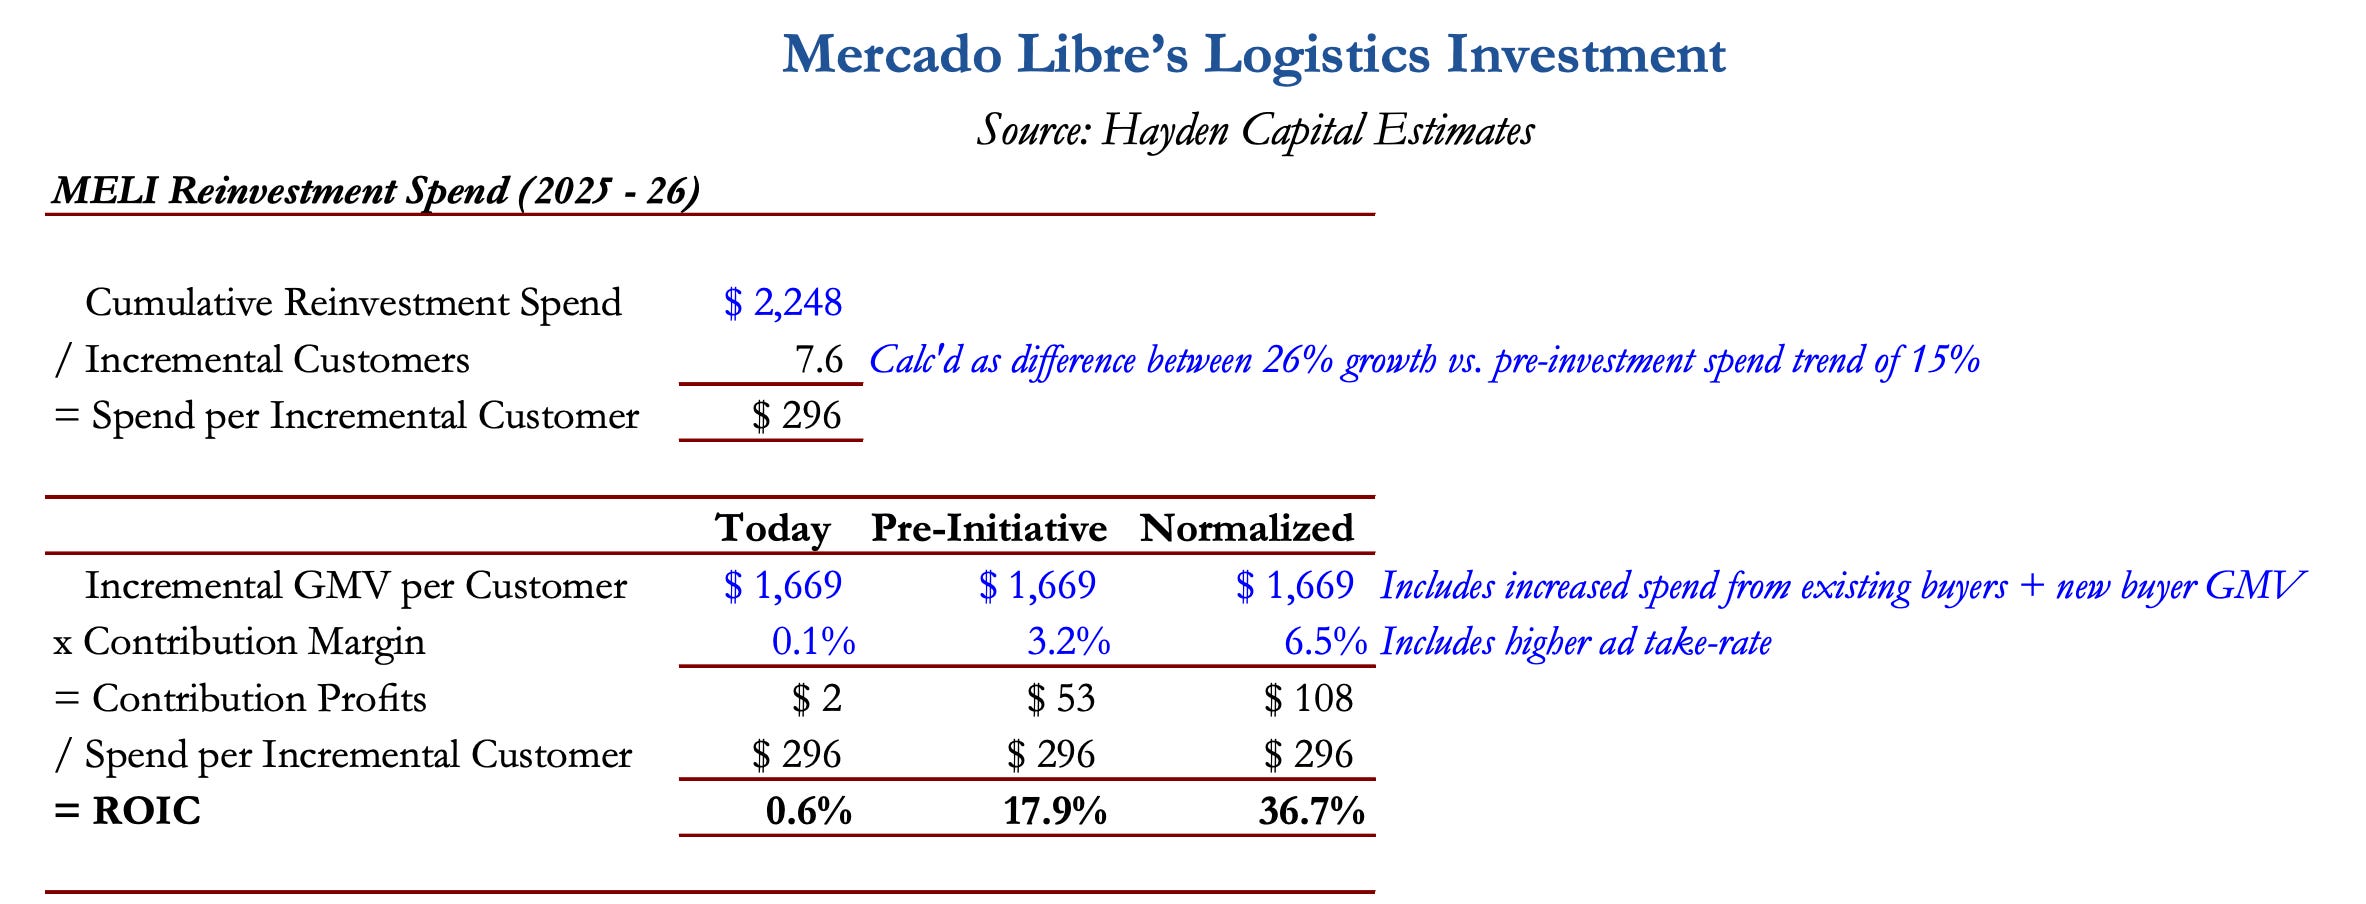
He is careful to say the estimates are guaranteed to be wrong. The exercise is not built to produce a number you can defend to the second decimal. It is built to tell you whether management is creating value with reinvestments or not.
Let’s discuss. Tell me where you think I am wrong, what I have missed, or which company you want me to take apart next. Leave a comment below and I will answer.
So reading the letter inspired me to do some calculations myself again this morning. Regular readers know that the topic of ROIIC is well-trodden ground for me. I have spent a lot of time thinking about how to measure returns on reinvestment properly, particularly in a world where a growing share of the investment never touches the balance sheet at all:
Sales teams,
marketing budgets,
R&D,
customer acquisition,
brand campaigns.
I wrote about that at length in Forget ROIC! This Metric Tells You How Well a Business Really Compounds, where I laid out ROIGI as an evolution of ROIC and ROIIC. That piece remains one of the most read articles I have published (4,156 views).
Welcome to Compound with René. I write long-form deep dives on quality businesses, with an emphasis on disciplined valuation. Subscribe for FREE to join our growing community of 4,800+ investors and make sure you don’t miss the next deep dive.
So today I am pointing that lens at Tiger Brokers. I own the stock, which you should factor in accordingly, and I have written about the business here before (in fact, just this week).
But let me be direct about what this post is and is not. It is not my thesis on Tiger. It is not a valuation piece. If you came here for a price target, you are going to leave disappointed.
What I want to show you is how I calculate my estimated ROIIC for Tiger for the last 2-3 years.
As you read the steps below, I want to encourage you to not think about Tiger, but instead, think about the largest position in your own portfolio, for instance, or the newest one.
Is management reinvesting?
At what rate? (reinvestment rate)
What portion is growth- and what % is maintenance-related?
And what is coming back for every dollar they reinvest for growth?
How do you best go about calculating it?
Are there business-specific KPIs to consider? (consider Fred Liu’s approach of looking at GMV per customer coupled with steady-state contribution margins; contribution margin in ecommerce is the money left from a sale after you subtract all variable costs)
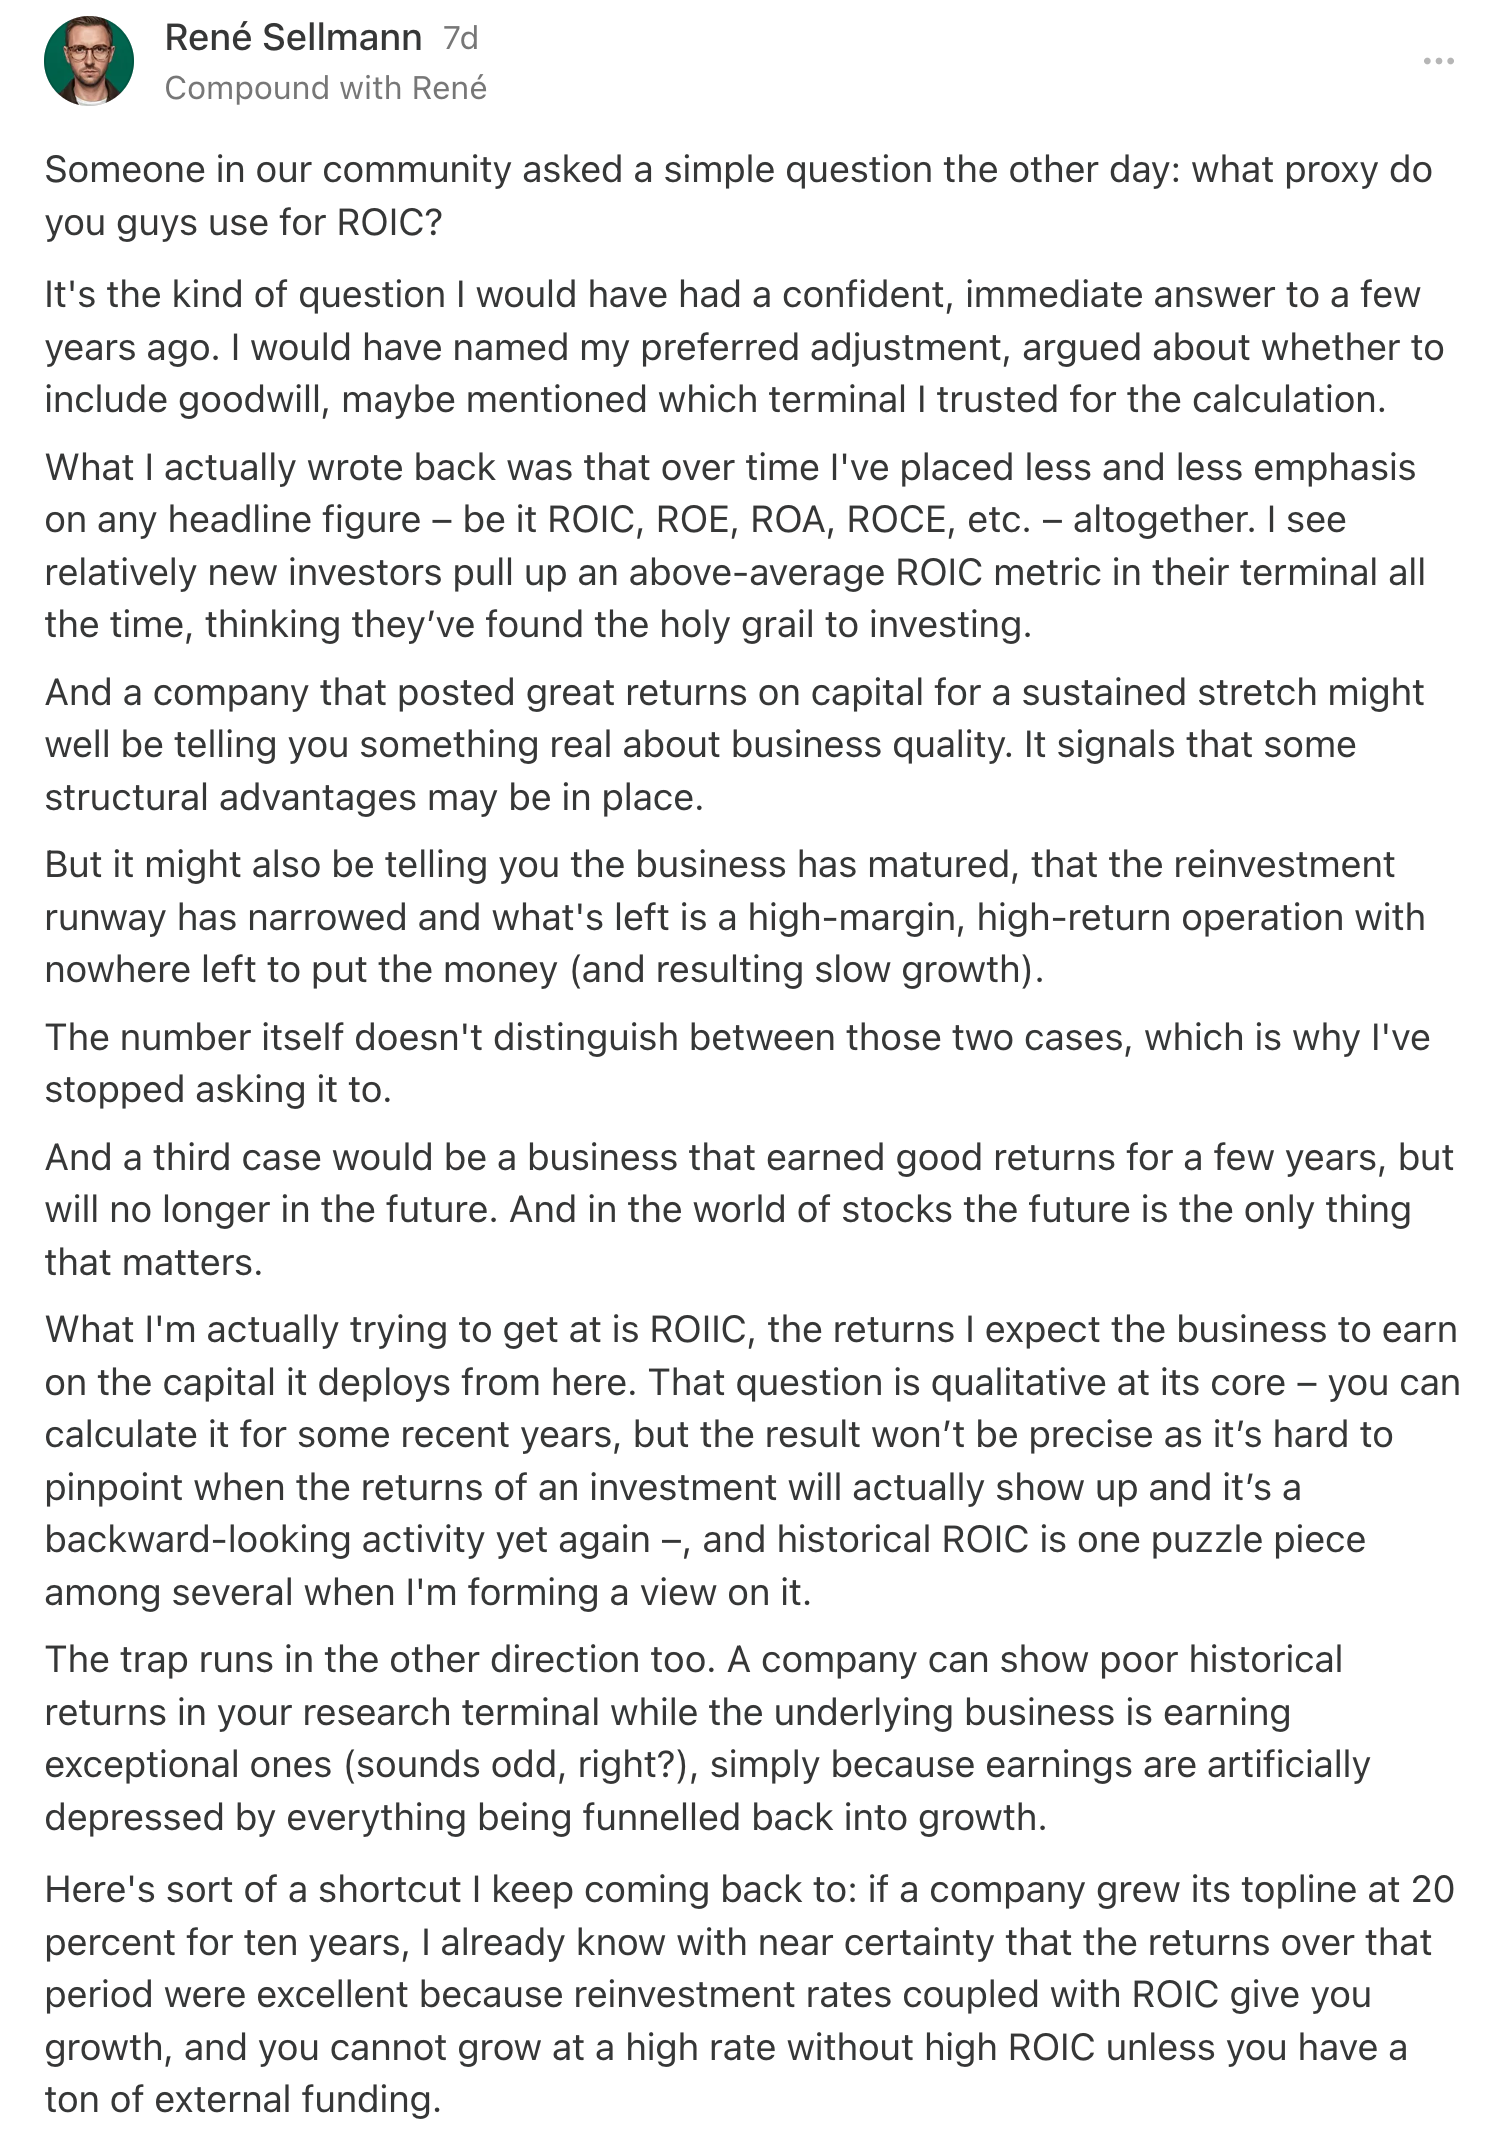
Most of us can recite a company’s ROIC from a screener. Far fewer have ever tried to work out what the last three years of growth spending actually earned. It is uncomfortable work, because you cannot do it without making assumptions you know won’t be 100% accurate. Do it anyway. A rough answer to the right question beats a precise answer to the wrong one, and you only need to be directionally correct.
Let’s Math!
Let me start with what items I considered. Tiger does not build factories. There is no logistics network to capitalize, no fleet, no fulfillment centers. Almost everything the company spends to grow runs through the income statement as an operating expense in the year it is spent:
marketing to acquire funded accounts,
compensation for the people building and selling the platform, and
the general and administrative overhead that comes with opening new jurisdictions.
So that is the bucket of expenditures I looked at. Sales and marketing, plus the portion of employee compensation and G&A that scales with expansion.

I also counted capital expenditures, all of it, even though the amounts are almost rounding errors next to the operating lines.
Tiger spent $2.8 million of capex in LTM Q2 2023 and $5.5 million in LTM Q2 2026, against $61 million of marketing and $194 million of compensation in that final year.

If you were looking only at the cash flow statement to understand how this company invests, you would conclude it barely invests at all, and you’d end up with unbelievably high ROIIC figures.
That is the whole “problem” with capital-light businesses in a nutshell – it requires a nuanced understanding of where the company (re-)invests –, and it is why the interesting decisions here happen above the operating income line on the income statement and how to treat each item (as opposed to the cash flow statement).
Which raises the obvious question: what share of each operating line is genuinely growth spending, and what share is the cost of running the business you already have?
Here is where I landed, and I want to be upfront that these are highly subjective judgment calls as opposed to precise derivations. I feel most comfortable about the marketing split, because management deliberately commented on the split on this week’s call (“Under split client acquisition, including branding, accounted for roughly 60% to 70% of our total marketing expense.“).
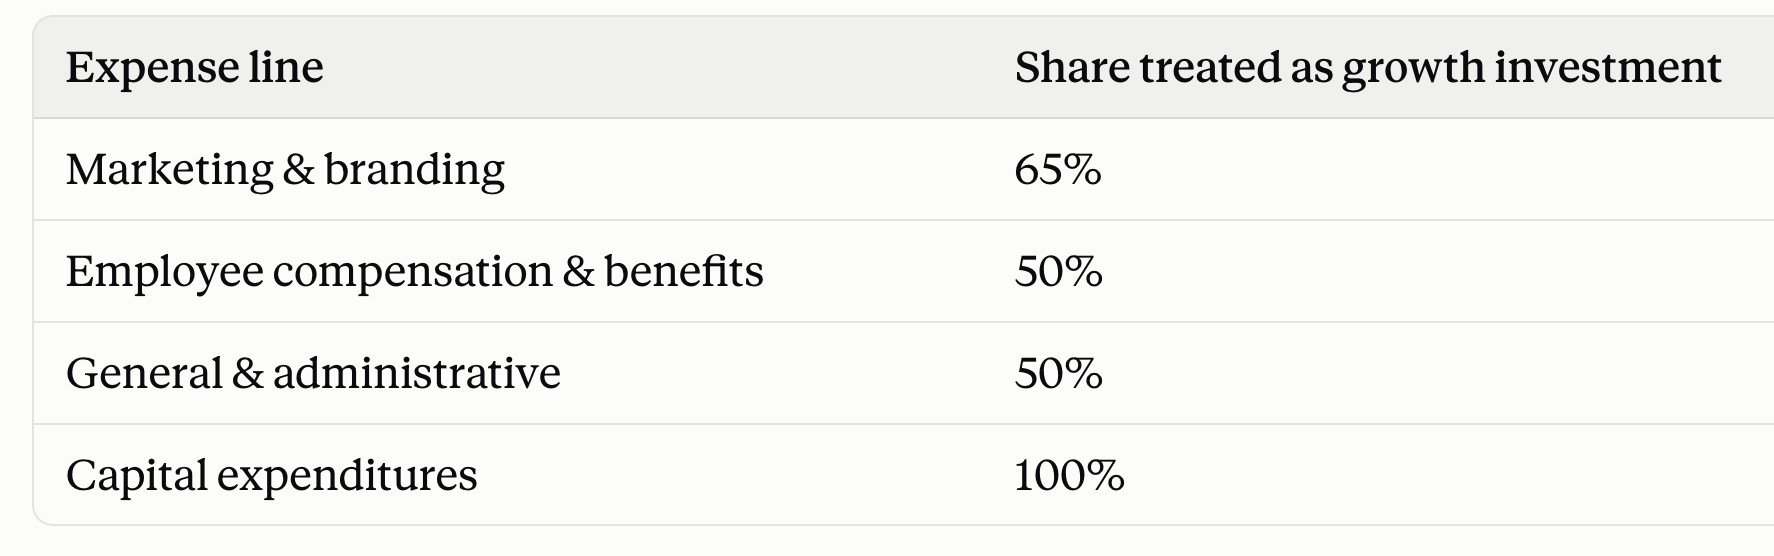
Compensation and G&A both get half. Roughly speaking, I am assuming that of everyone Tiger pays and every office it runs, about half the cost exists to grow the platform into new markets and new products, and about half exists to service the clients already on it. It’s a simple rule of thumb I rely on here.
In a business that grew revenue 41% year over year, and where headcount cost jumped from $135.6 million to $194.3 million in twelve months, half feels defensible.
It is still a (wild) guess.
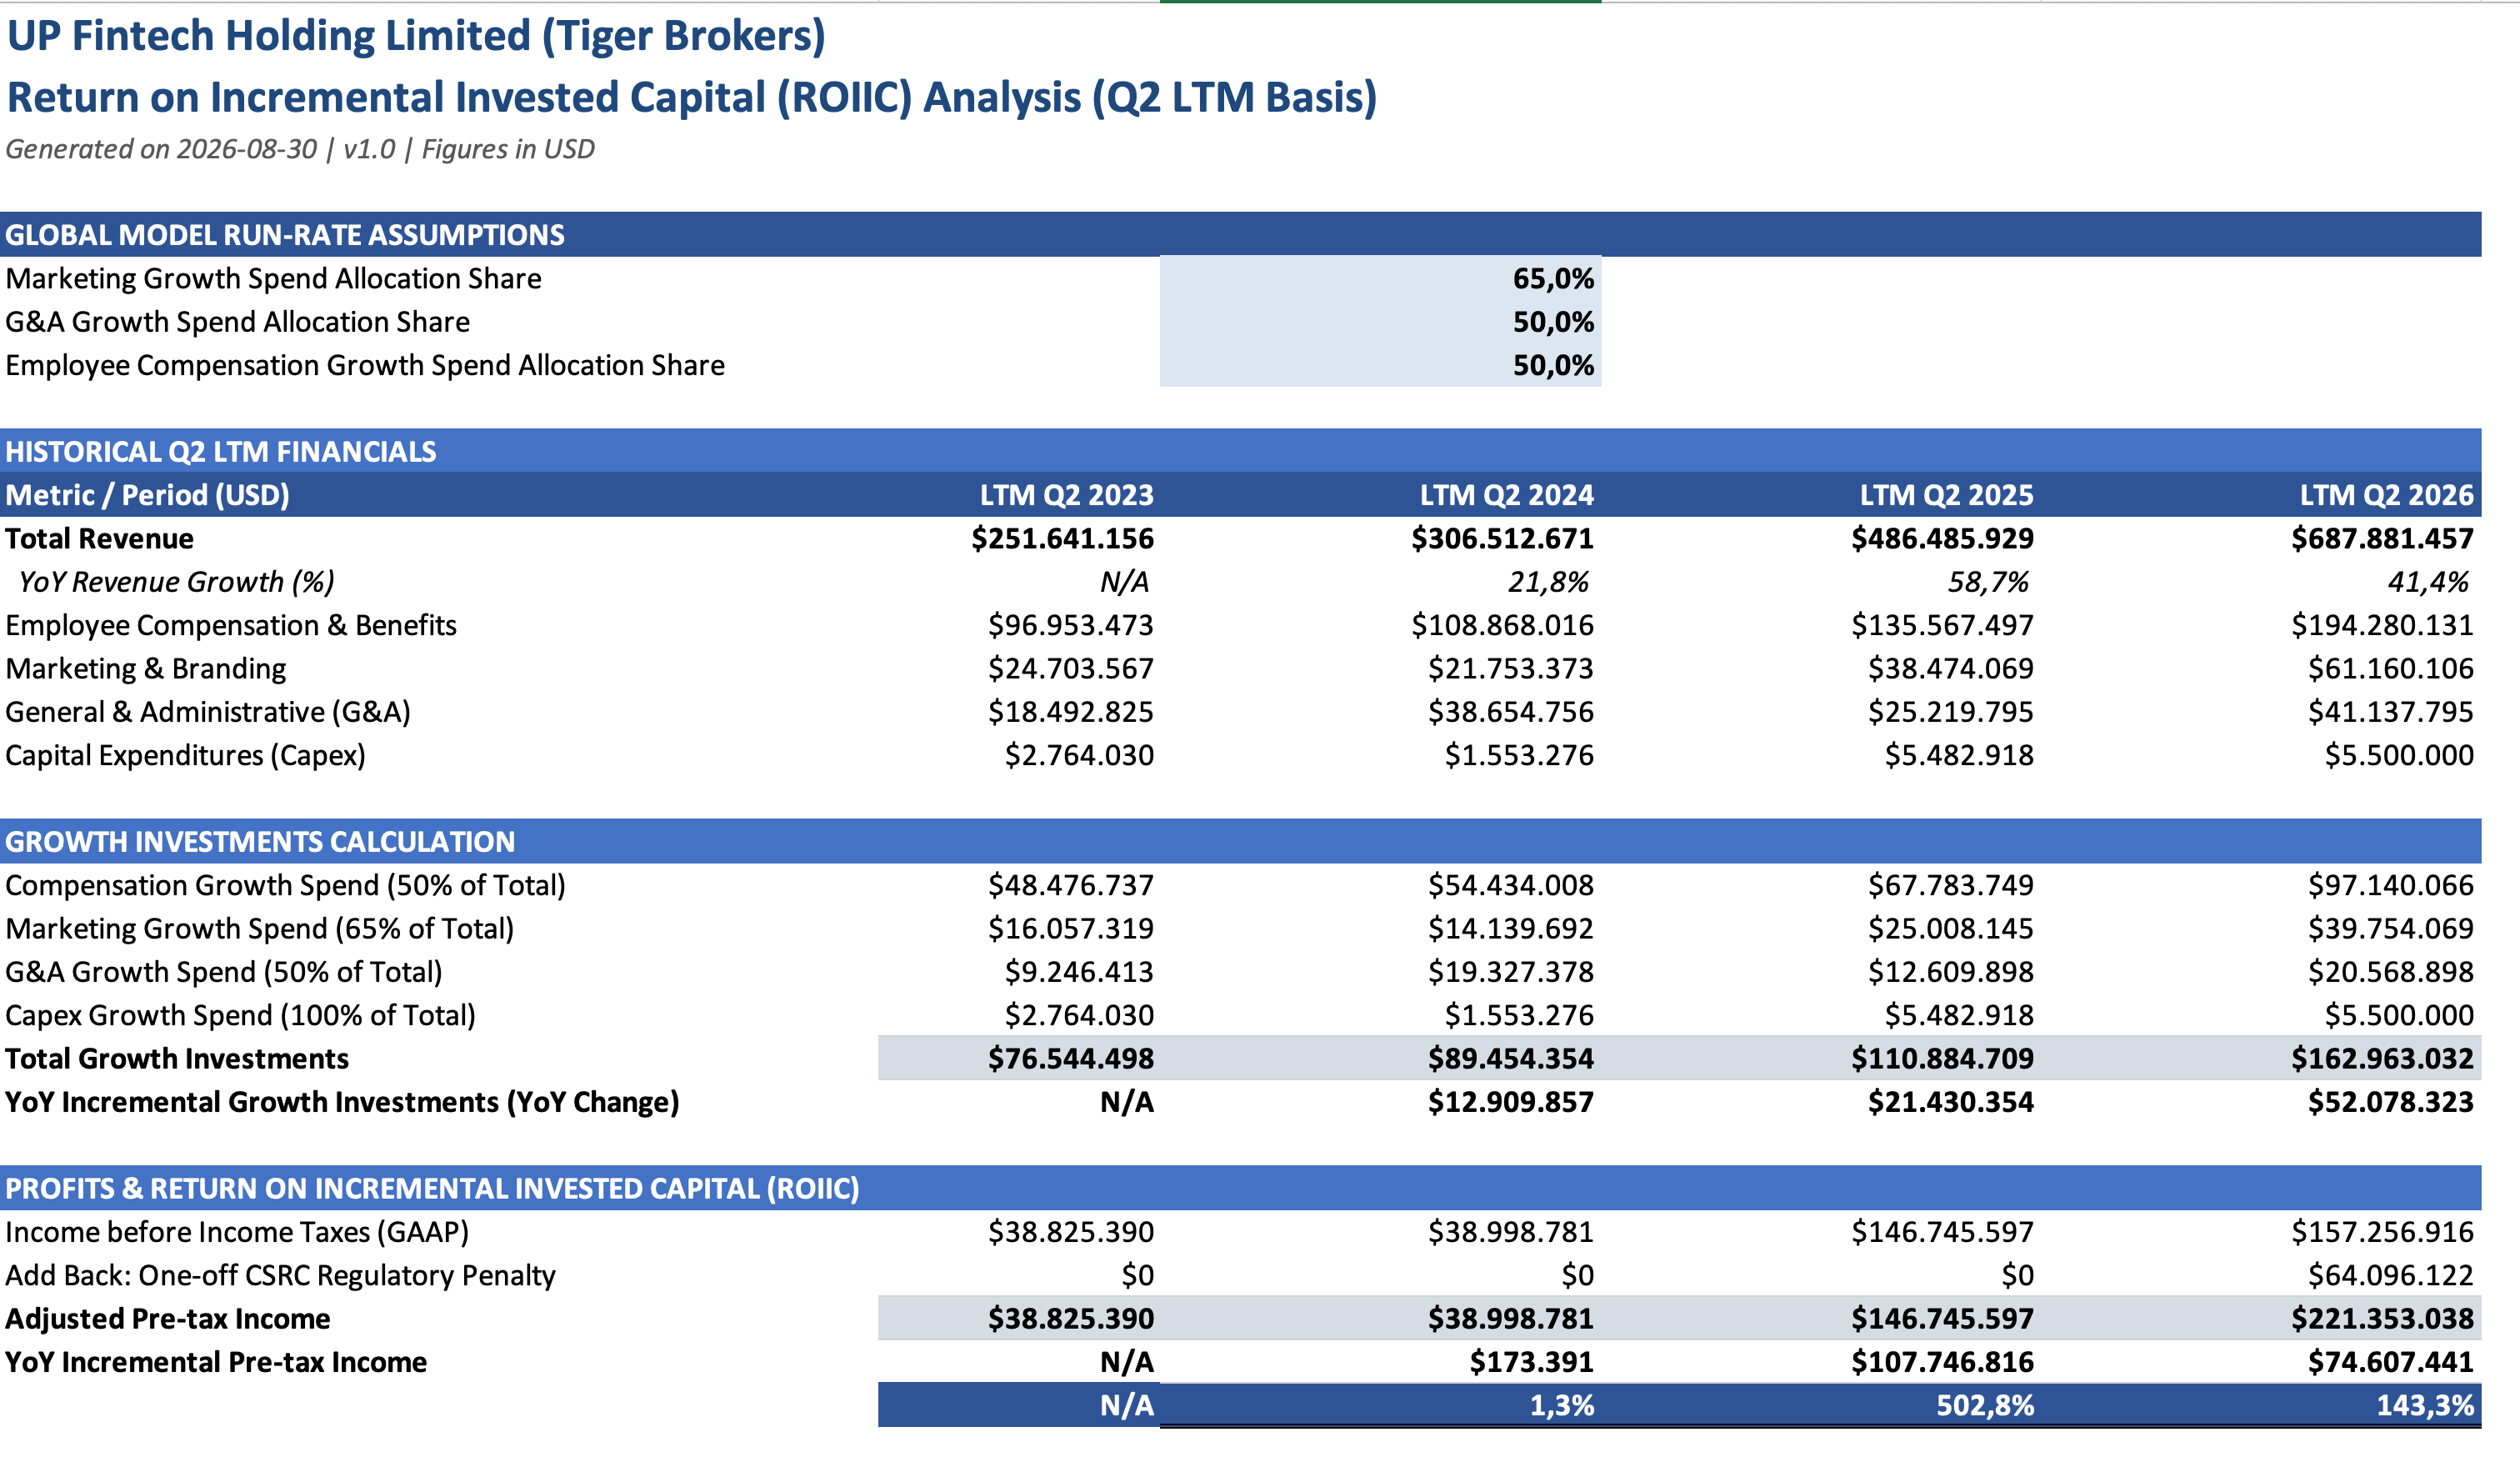
Run those shares across four years, and you get this.
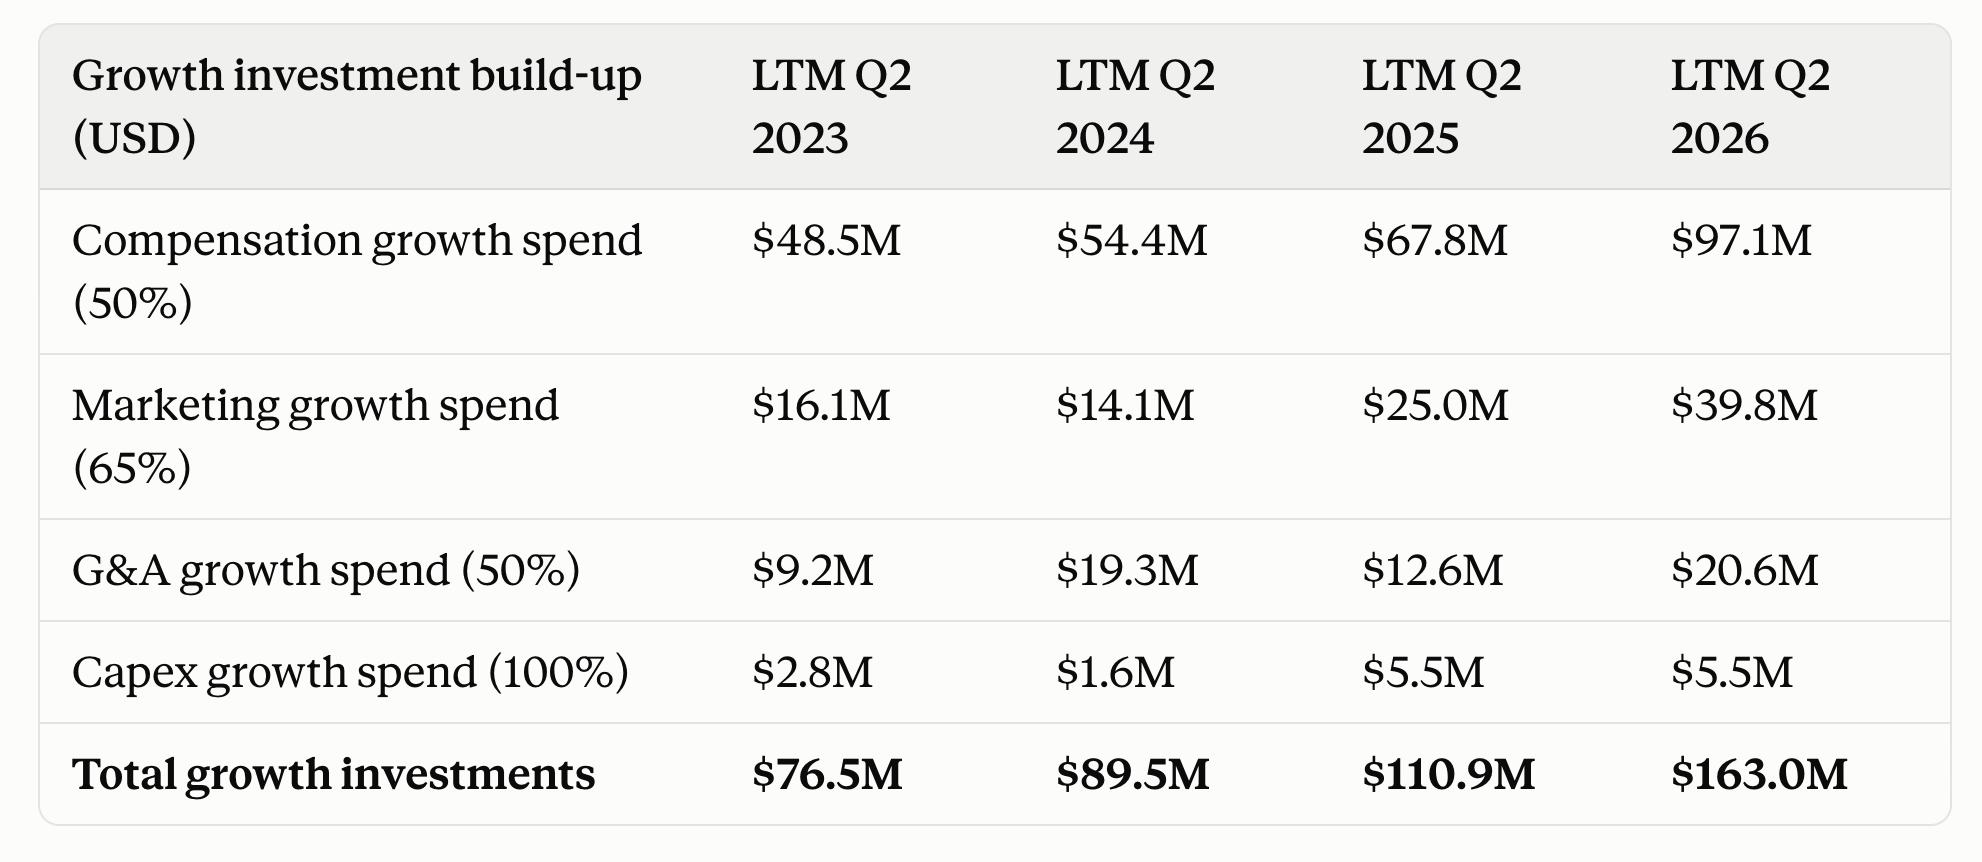
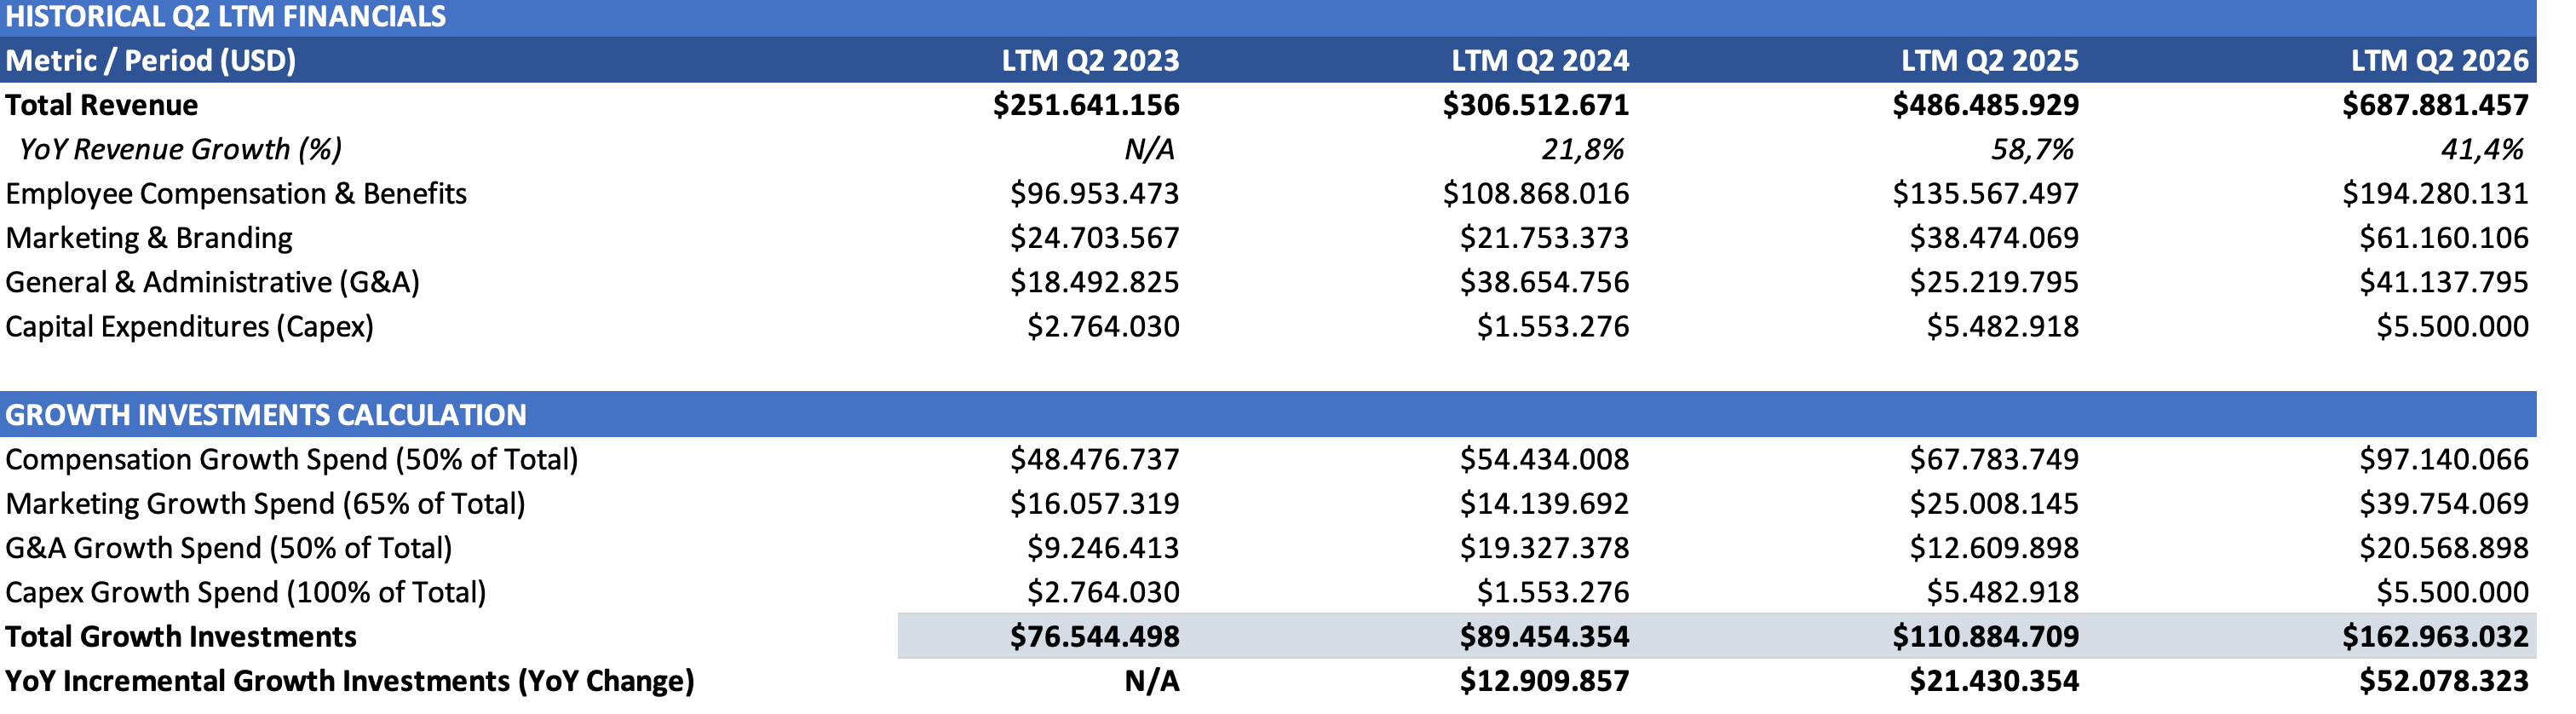
Before you accept any of the returns further down, go back and change those four percentages to whatever you think is right and see what happens. That is not a rhetorical suggestion. If you take compensation down to 35% because you think most of Tiger's engineers are maintaining a platform rather than expanding it, the denominator shrinks and every return figure I show you below gets (even) better.
Sensitivity around your own assumptions is not an afterthought to this kind of work. It is the work.
But again, the growth vs. maintenance split is not a clean line. Nobody discloses it that way. But the alternative is worse, because if you only count capitalized capex on a business like this you conclude it invests nothing and earns infinite returns, which is arithmetically correct but analytically completely useless.
On the profit side, I am using adjusted pre-tax profits, and the word adjusted is carrying weight in the most recent year. Reported income before taxes for LTM Q2 2026 was $157.3 million. I add back the one-off $64,096,122 CSRC regulatory penalty booked in Q1, which takes the figure to $221.4 million.
Note: I noticed I made a mistake here when re-reading it before publishing. The fine in Q1 was roughly $59.7 million as opposed to the $64 million I used from the “other” expense line item. I’m thus slightly overstating LTM pre-tax profits below.
Note that no such adjustment applies to the earlier years, where reported and adjusted pre-tax income are identical.
Here are the incremental returns based on what I shared so far:
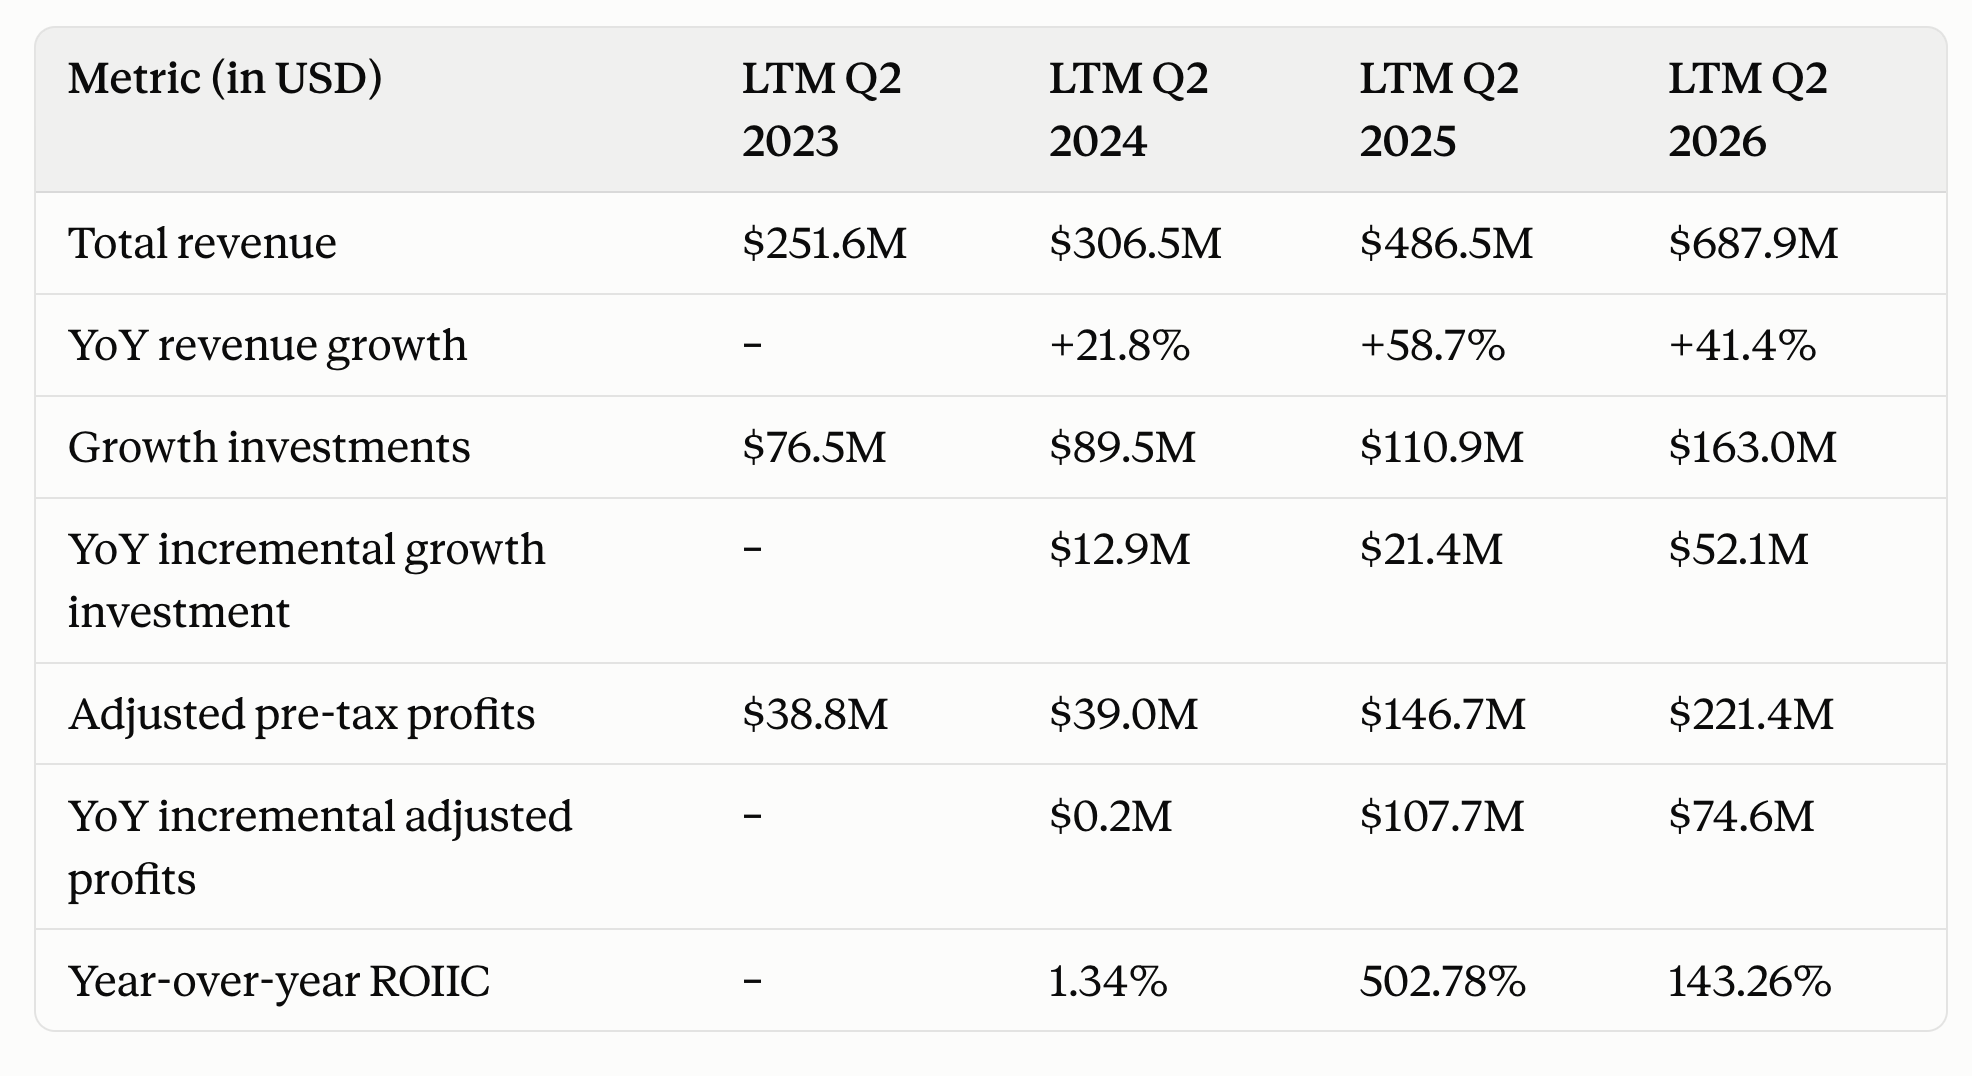
Look at that bottom row, and you will understand why I do not trust single-year incremental returns. One year the business earns 1.3% on its incremental spending. The next year it earns 503%. The year after, 143%.
No business swings from destroying capital to earning five times its money and back inside twenty-four months.
In 2024, Tiger was absorbing write-downs on legacy Hong Kong margin loans and incremental profit was essentially zero, which sends the return to the floor no matter how well the spending performed over a longer time horizon. In 2025, the pivot landed, and profits jumped $108 million against $21 million of extra spend, which sends it to the moon. Neither number describes the business’s actual ROIIC in my view.
This is the single most common way I see incremental return math go wrong. It’s hard to pinpoint when a growth investment materializes, and if you take brand campaigns, for instance, you have to consider it as a multi-year investment.
Disclaimer:
As of the date of publication the author owns shares in the company; but that may change. The analysis presented in this blog may be flawed and/or critical information may have been overlooked. The content provided should be considered an educational resource and should not be construed as individualized investment advice, nor as a recommendation to buy or sell specific securities. I may own some of the securities discussed. The stocks, funds, and assets discussed are examples only and may not be appropriate for your individual circumstances. It is the responsibility of the reader to do their own due diligence before investing in any index fund, ETF, asset, or stock mentioned or before making any sell decisions. Also double-check if the comments made are accurate. You should always consult with a financial advisor before purchasing a specific stock and making decisions regarding your portfolio.
Cumulative Growth Investments vs. Incremental Profit Growth
Once you switch to cumulative spending against the change in earning power, the picture settles down considerably. I ran it two ways, over two windows, which gives four numbers. A single figure invites false precision, and a range is more robust.
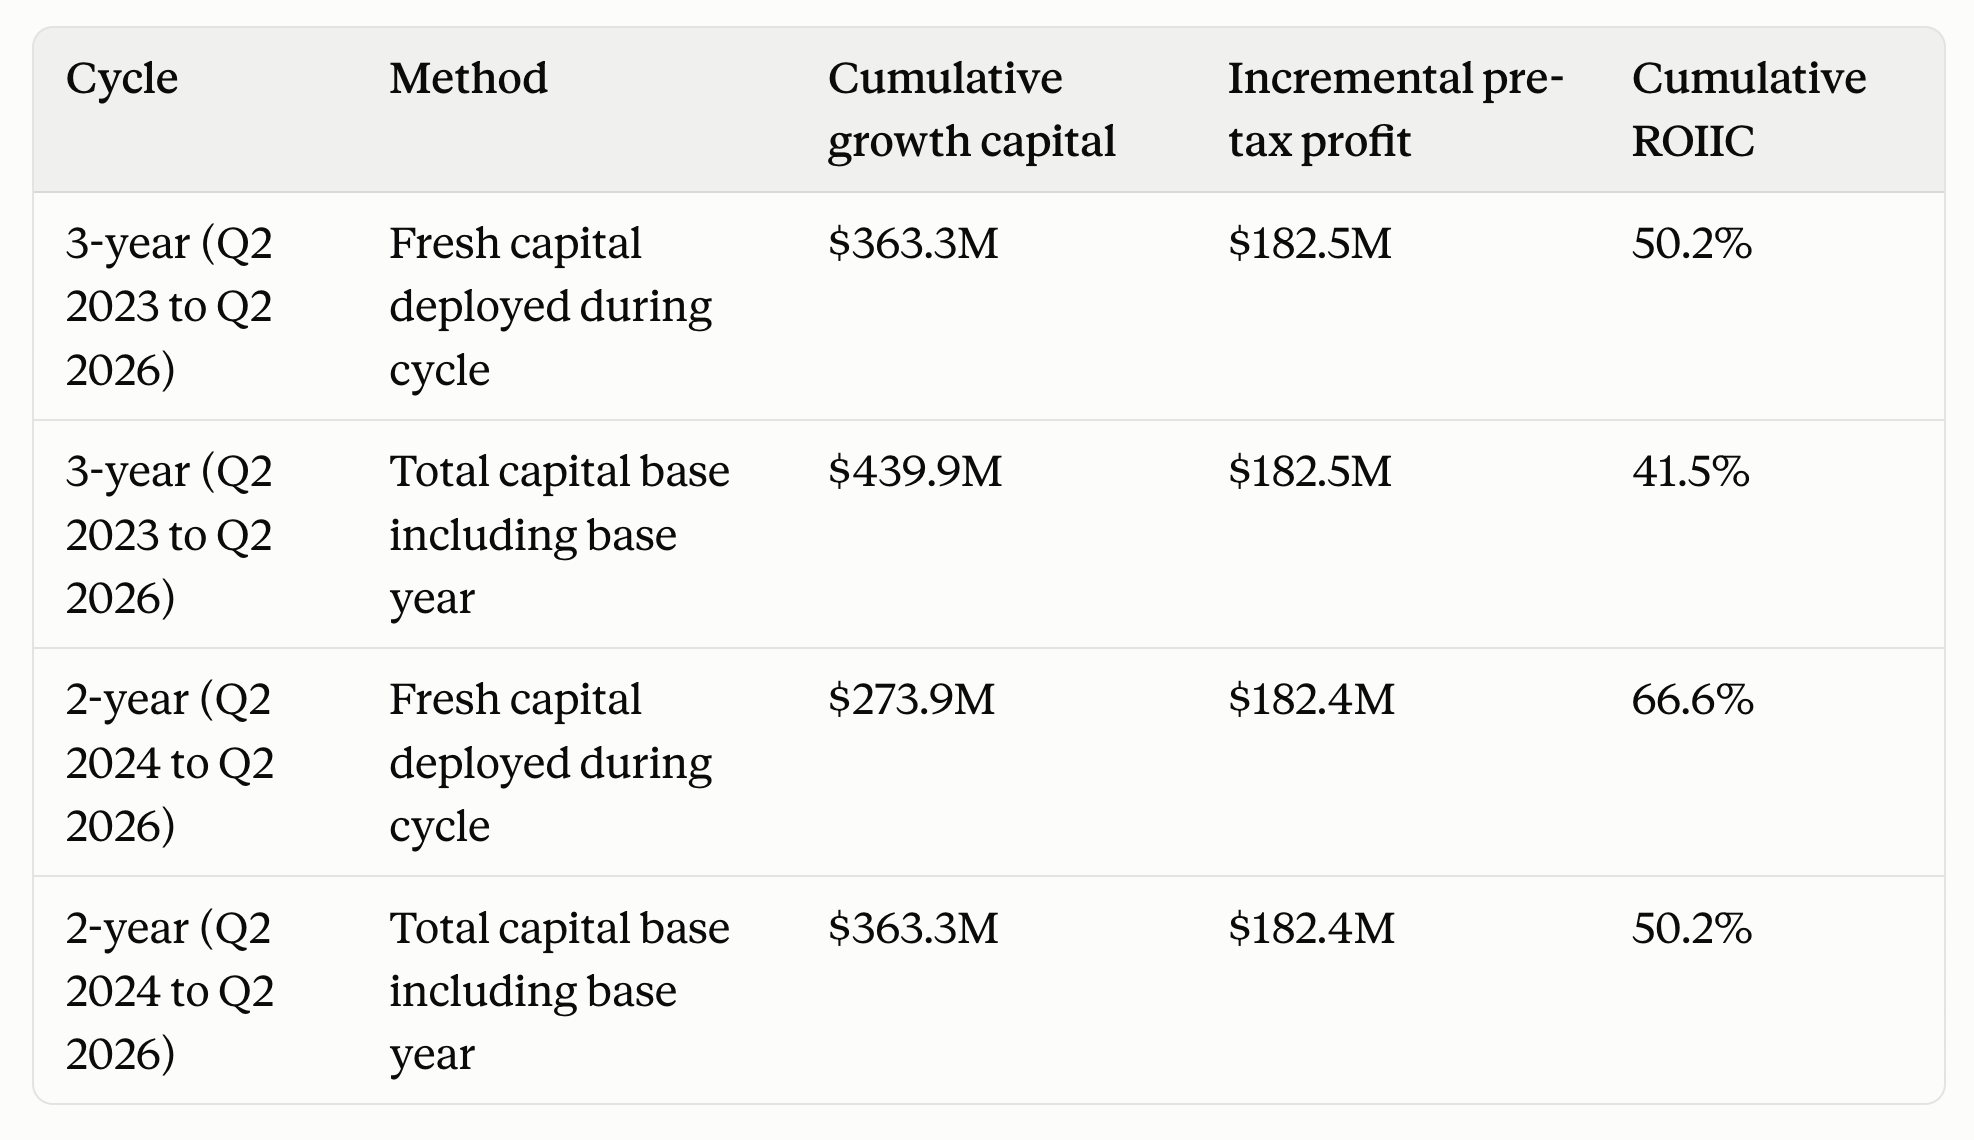
Read across the range, and you land somewhere between 42 and 67 cents of recurring annual pre-tax earning power for every dollar of cumulative growth spending.
Even at the low end, that is a business converting growth investment into profit at a rate you love to see as an investor.
Qualitative Explanation
The exceptional Return on Incremental Invested Capital (ROIIC) is in my view the result of a highly synchronized strategic transformation. Management is in the process of transitioning Tiger from a higher-churn, transaction-heavy, lower-quality retail broker into a highly scalable, high-net-worth global wealth platform.
1. The Move to Self-Clearing: Upgrading the Cost Structure
Historically, Tiger relied heavily on Interactive Brokers (IB) to execute, clear, and settle the majority of U.S. and Hong Kong trades, which required paying substantial clearing fees and sharing interest spreads. By acquiring TradeUP Securities (formerly Marsco) in 2019 and investing in self-clearing, Tiger systematically eliminated these middleman fees. By Q3 2025, CFO John Zeng highlighted that clearing costs had plummeted to an all-time low of just 6% of commission income (further assisted by the SEC’s suspension of certain transaction fees), down from under 15% in Q2 2022. Controlling the clearinghouse also enabled Tiger to launch high-margin, complex product suites such as U.S. fractional shares and options combo trades with virtually zero incremental vendor costs.
2. Pivoting to Higher-Quality Users
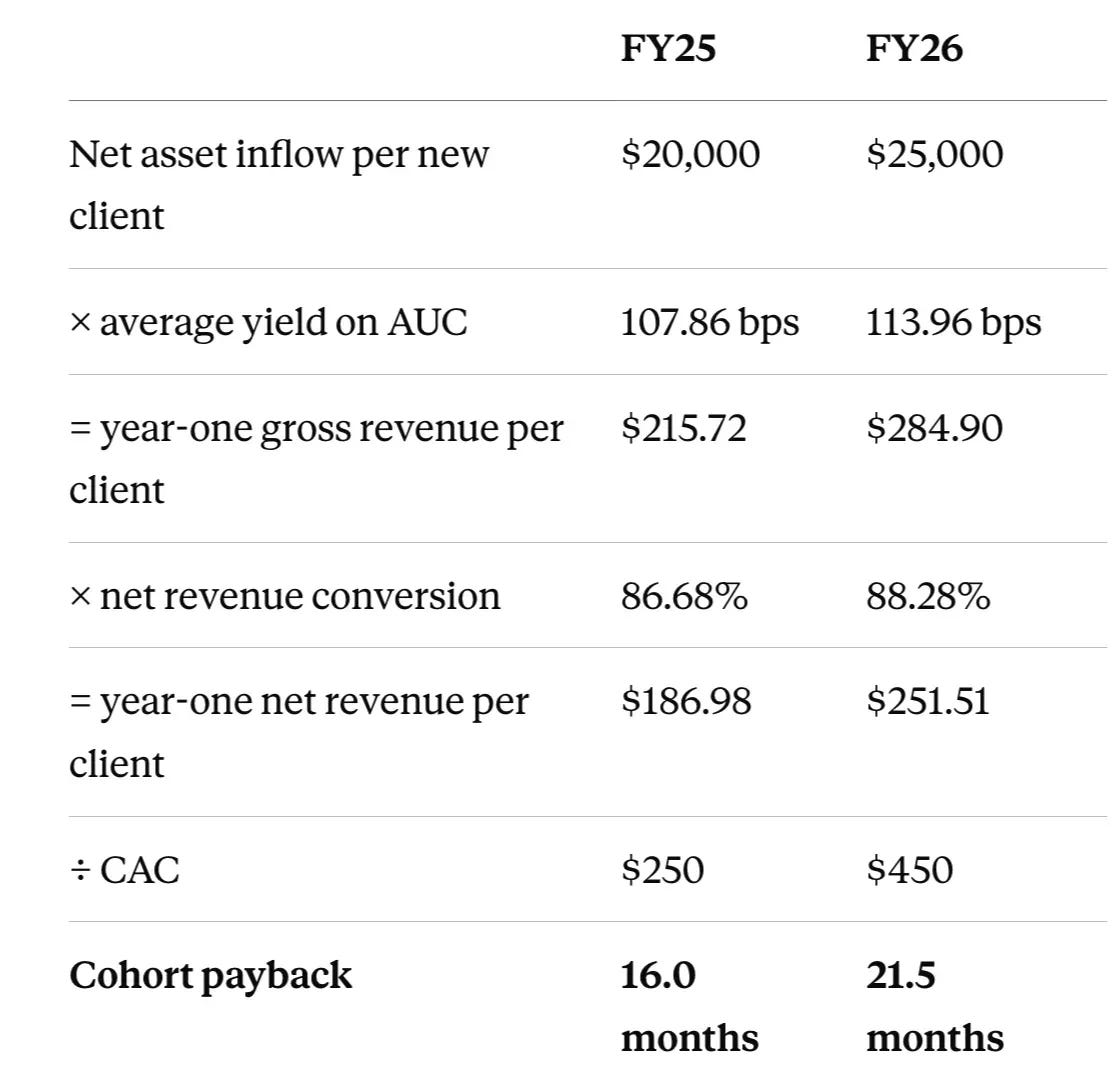
Tiger’s transition away from chasing absolute customer counts in favor of high-net-worth (HNW) retail clients has significantly upgraded the business’s unit economics. Group-level average net asset inflow per newly acquired retail client rose from under US$20,000 in Q1 2026 to over US$25,000 in Q2 2026. Locally, Singapore’s newly acquired users averaged over US$60,000 of net inflows in Q3 2025 and Hong Kong HNW users reached over US$43,000 in Q4 2025.
“Meanwhile, ROI-driven acquisition strategy delivered standout results in Singapore. The average net asset inflow for newly acquired clients in the third quarter surpassed USD 60,000, a historical breakthrough and lifts group average this quarter to above USD 30,000 for the first time.“
While direct customer acquisition costs (CAC) increased significantly to the US$450 range, the payback period remained attractive (even though I believe it is becoming less attractive). Wealthier cohorts bring larger initial deposits, trade in larger size, and adopt multiple products immediately.
Note: I was actually also doing some more complex calculations on the return on advertising spend too this morning, which was too complex to share. But if I had to summarize it, based on the recent $25,000 average net asset inflow comment by management, coupled with the $450 CAC and the latest revenue yield on AUC, the payback period is still around 21 months on revenue. Factoring in an estimated 35% incremental profit margin, the “actual” payback extends to roughly 61 months (5 years), which delivers an annual cash yield of ~20% on CAC once the break-even mark is passed.
3. Operating Leverage
Fintech companies are built for operating leverage, but Tiger’s backend architecture is exceptionally lean. I believe there is still some leeway left as the company scales further from here. At some point, this growth lever will be exhausted though.
4. The Flywheel of Corporate Services (ESOP & IPOs)
Tiger’s corporate segments (B2B) serve as a massive, low-cost customer acquisition funnel for its retail business (B2C). Tiger’s ESOP business has grown to 840 corporate clients as of Q2 2026. When Tiger manages a pre-IPO company’s ESOP, it pre-onboards all of that company’s employees onto the Tiger platform. As those employees’ shares vest, they naturally convert into active, funded retail trading accounts – bypassing traditional marketing channels entirely and keeping CAC incredibly low.
Pushback
Now let me try to be critical about my own numbers.
The largest problem is attribution. I have taken $182 million of incremental profit and handed all the credit to $363 million of growth spending (my assumption), and that is almost certainly too generous. Tiger is a brokerage. A meaningful share of that profit improvement came from trading volumes and interest income on client cash, both of which move with market conditions that no amount of marketing controls. Some portion of those new funded accounts would have arrived anyway, pulled in by a rising market, a retail investing mania. I cannot cleanly separate the two.
So treat these figures as an upper bound on what management’s capital allocation achieved, and hold the possibility that a flat or falling market reveals a much less flattering number. Operating leverage also works in reverse.
Second, both windows start from a depressed base. LTM Q2 2023 and LTM Q2 2024 show nearly identical adjusted profits of $38.8 million and $39.0 million, which is why the three-year and two-year incremental profit figures are almost the same.
None of this makes the exercise worthless. It makes it directional, which is all it was ever going to be. If the answer had come back at 8%, or negative, I would want to know why management keeps spending. It came back somewhere north of 40% under assumptions I have deliberately chosen to be transparent about, and that is enough to conclude the reinvestment is justified in my view.
Your Next Steps
Which brings me back to where I started. Go do this for your largest holding. Pull four years of income statements, decide what counts as growth spending and write down why, sum it, and compare it against the change in normalized profit. It will take you an hour. Do it anyway and write the assumptions down so that in twelve months you can check which ones were wrong.
That habit, more than any single number it produces, is what separates owning a business from owning a ticker.
PS: Please let me know if you spotted a glaring mistake I made.
PSS: NotebookLM built the Excel spreadsheet below for me – isn’t this amazing?
Disclaimer:
As of the date of publication the author owns shares in the company; but that may change. The analysis presented in this blog may be flawed and/or critical information may have been overlooked. The content provided should be considered an educational resource and should not be construed as individualized investment advice, nor as a recommendation to buy or sell specific securities. I may own some of the securities discussed. The stocks, funds, and assets discussed are examples only and may not be appropriate for your individual circumstances. It is the responsibility of the reader to do their own due diligence before investing in any index fund, ETF, asset, or stock mentioned or before making any sell decisions. Also double-check if the comments made are accurate. You should always consult with a financial advisor before purchasing a specific stock and making decisions regarding your portfolio.
I have done this exercise in the past but I think your focus is on the less important metric. Let me explain. Growth = ROIC * R.Rate. Growth at a ROIC above the cost of capital drives shareholder value, so the ROIC tells you about whether the business creates or destroys value. And as you said, a business with high growth will typically have high ROIC unless they are using a lot of external financing. But the most important metric here, growth, we already know without making any assumptions! Typically, high ROIC comes with low reinvestment rates, as this is dominated by capital light businesses. What’s more, high ROICs are also mean reverting to some extent.
The most interesting thing out of this exercise for me is what is the underlying owner earnings, after you deduct all of the reinvestment expense. If I see a stock which, after adjustments for reinvestment, is trading below 10xPE with 20% ROIC and 15% growth, I am significantly more excited than if I find a high flier with 40% ROIC. To give you an example, I already mentioned to you my investment in Basic Fit. This company is optically ugly: levered balance sheet, low or even negative earnings and FCFs, and yet, it has been growing top line above 15% for more than a decade. How come? An analysis of the ROIC unit economics reveals that the ROIC is very good, but high levels of reinvestment drag down not only FCF but also earnings. Combined with the impact of the COVID pandemic, and sentiment couldn’t have been at a worst point. Until recently, when the business pivoted to a capital light, franchise strategy and cut reinvestment substantially. The stock went down 20% on panic on the unexpected news last year, only for investors to realize not much later what the level of operational leverage means for the optics of their financials, recovering from the drop and some more. Most recent quarter EBIT is up 40%.
As you can see, I am not shy to invest in optically expensive stocks or with no earnings, as long as they are cheap when adjusted for this reinvestment. In fact I do not think it’s possible to buy “growth at value prices” unless there is some financial distortion like this or some serious threat to the business, and I prefer the former. When the financial fog clears, the stock rerates. This is different from multiple expansion because in fact, those stocks appear expensive in terms of fundamental metrics like EV/EBIT or PE. You could argue that there is multiple expansion of P/B, but P/B is meaningless for a lot of businesses.
My main point of contention with that returns equation is that it does not consider margin expansion. In the long term, margin expansion doesn’t do much. But in the short term, it matters a lot. I find it very useful to do a Du Pont decomposition of ROIC = NOPAT/Sales * Sales/IC. This decomposition is useful because sales scales well with IC and tells you about the changes in capital intensity, whereas NOPAT/Sales tells you about the margin on those sales. If margins are stable, you can approximate revenue growth by ROIC*R.Rate. But whenever margins are not stable, this calculation is not correct. Furthermore, you could break this down even more by saying that revenue growth equals the change in capital intensity times IC plus the change in IC times the capital intensity. The more that you break ROIC down, the higher the autocorrelation of those numbers are, compared to the ROIC metric itself. Then you can also see trends behind the headline ROIC.
As I see it, returns = capital distributions + revenue growth + margin expansion + change in capital structure + multiple expansion.
Financials and math are, unfortunately, stubbornly quiet when it comes to understanding business quality. It is not just the attribution problem that you raised in the article; it is understanding exactly what drives financials and how.
For me personally, the most valuable insight from the whole article (and simultaneously the most dangerous assumption) is: "Management is in the process of transitioning Tiger from a higher-churn, transaction-heavy, lower-quality retail broker into a highly scalable, high-net-worth global wealth platform."
How would you define a "high-net-worth global wealth platform"?
What decisions does management need to take to get there?
How can one assess, numerically or otherwise, whether management is making the correct decisions?
Bests!