

Nobody is talking about Tiger Brokers anymore. Or about Futu, for that matter.
That is what tends to happen when a story breaks: the stocks fell hard when Chinese regulators showed up in May, and the crowd went looking for something with better momentum.
I understand the impulse. Attention is finite, and there are easier places to put it than a Chinese-adjacent broker halfway through a compliance overhaul.
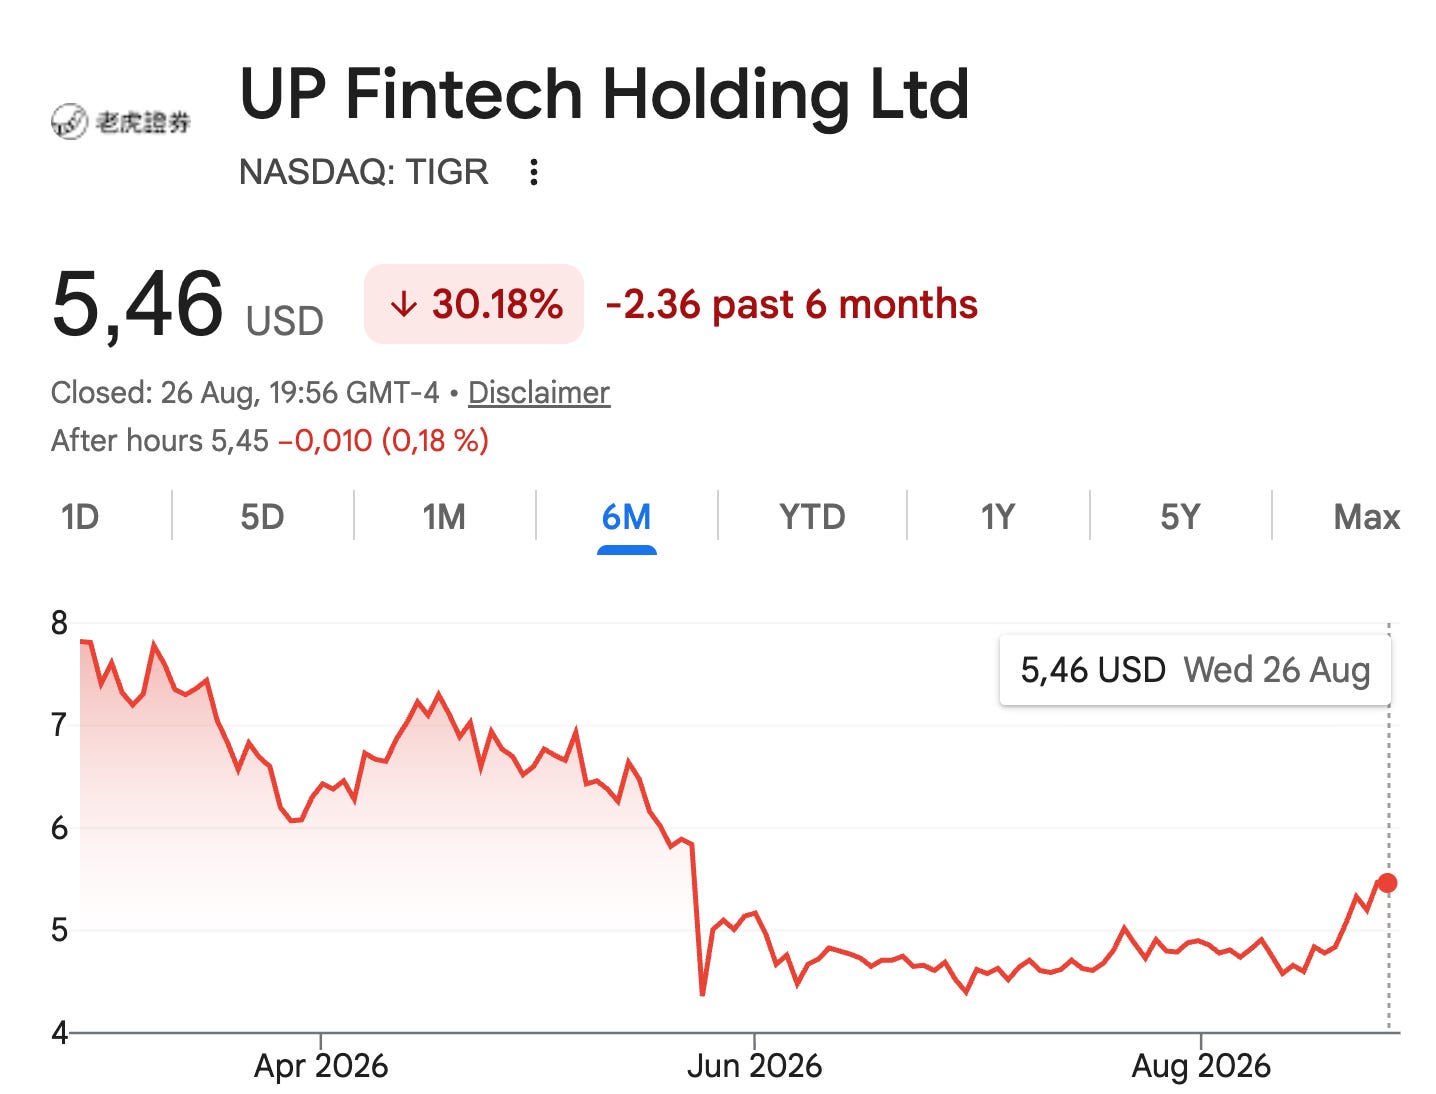
I still own the stock. It is the biggest loser in my portfolio this year, down 52% year to date even after the recent bounce, and there is no version of this piece where I pretend otherwise.
What I want to avoid is the error where a bad chart does your thinking for you, where the price action clouds your judgment, and you selectively look for data points confirming the price movements.
Price drives narrative for too many investors.
I’m still bullish on the business though (even though my timing was outright terrible in hindsight). I may be one of the few left.
The share price is information about what the market in aggregate believes right now. And sometimes the market is focused on very different things (and operating on a different timeline) than a long-term investor.
It is also worth noting that the market has started to reconsider. After the bombshell news of May 22, Tiger bottomed somewhere in the $3 range pre-market. After Futu reported last week, which gave TIGR another boost, the stock has now ran up roughly 20% from its more recent lows in a matter of days, which suggests investors were pricing in something considerably worse than what the sector actually delivered.
So here is how I'll approach the quarter. I'm going to work through …
three lowlights,
three mixed signals, and
five highlights
… that I think the market is underweighting right now.
My aim is to be as skeptical of the good news as I am of the bad.

What’s covered:
Capital Allocation Decisions: An examination of board-authorized share repurchases, execution pacing, and liquidity vs. reinvestment dynamics.
User Growth Velocity: Account acquisition trends across key target markets relative to full-year guidance targets and industry peer performance.
Margin & Take Rate Mechanics: Structural product mix shifts, commission-free volume impacts, and share price pricing dynamics influencing equity transaction yields.
Geographic Diversification & Risk Transition: The trajectory of international client expansion and asset inflow patterns as legacy market exposure winds down.
Acquisition Efficiency & Opex Trends: Analysis of marketing strategies, branding initiatives, and customer acquisition metrics relative to asset accumulation.
Near-Term Forward Indicators: Management commentary regarding third-quarter asset inflows, account capitalization, and trading activity normalization.
Structural Diversification: The growth footprint of non-transactional revenue streams, mutual funds, and corporate ESOP conversion funnels.
Earnings Quality & One-Off Adjustments: Unpacking temporary non-cash tax distortions and non-recurring regulatory items to gauge core earnings power.
Valuation & Multiples Analysis: Assessing Enterprise Value and market cap metrics against Q1 earnings, adjusted Q1 earnings, annualized figures, and other adjusted/normalized earnings scenarios.
Disclaimer:
As of the date of publication the author owns shares in the company; but that may change. The analysis presented in this blog may be flawed and/or critical information may have been overlooked. The content provided should be considered an educational resource and should not be construed as individualized investment advice, nor as a recommendation to buy or sell specific securities. I may own some of the securities discussed. The stocks, funds, and assets discussed are examples only and may not be appropriate for your individual circumstances. It is the responsibility of the reader to do their own due diligence before investing in any index fund, ETF, asset, or stock mentioned or before making any sell decisions. Also double-check if the comments made are accurate. You should always consult with a financial advisor before purchasing a specific stock and making decisions regarding your portfolio.
1) Lowlights
Lowlight #1: A Toothless Buyback Program?
As of the second quarter of 2026 reporting, UP Fintech has executed approximately US$5 million of its share repurchase program. This represents a mere 10% of the total US$50 million buyback program authorized by the board for a 12-month period starting June 1, 2026.
During the Q2 2026 earnings call on August 26, 2026, CFO John Zeng highlighted this progress, noting:
“As of the close of the U.S. market yesterday, we have cumulatively repurchased approximately USD 5 million worth of ADS under our buyback plan announced on June 2, 2026. We may continue to execute repurchase from time to time under the $50 million share repurchase program on June 2, 2026.”
The company also noted in its official press release that these purchases are being funded entirely out of its existing cash balance, and that they will continue to dynamically assess market conditions to execute further buybacks from time to time under the remaining US$45 million authorization.
Liquidity certainly isn’t the bottleneck here – Yahoo Finance reports an average daily trading volume of nearly 2.9 million shares, so market depth gives them plenty of room to operate.
Given the depressed valuation Tiger currently trades at, this sluggish pace is deeply disappointing.
It leads me to believe that management remains entirely fixated on growth, making this $50 million program feel almost purely symbolic. They clearly prefer reinvesting capital directly back into the core business, and I wouldn’t be surprised if the remaining authorization is never fully deployed.
You could argue they are right to chase internal growth if those reinvestment returns outpace the return from share repurchases, but I find that hard to swallow. When a stock is this cheap, the hurdle rate and visibility that buying back your own shares offers are difficult to beat.
Lowlight #2: Target Out of Reach? The User Growth Dilemma
Management set a full-year target of 150,000 new funded accounts at the end of the last fiscal year, but getting there looks like an uphill battle.
The first quarter provided the initial red flag, bringing in just 28,900 new funded accounts – roughly 19.2% of the annual goal.
Despite that weak start, leadership project optimism during the Q1 earnings call, stating:
“We are confident about our full year guidance and our global expansion. Market volatility has affected investor sentiment so far this year. We are optimistic that easing geopolitical tensions and improved inflation expectations in the second half will drive stronger user growth.”
The second quarter failed to turn that optimism into reality. It didn’t catch me completely off guard, though. A recent Seeking Alpha piece noted that during a conference appearance, Tiger’s CFO guided for a “flat QoQ” expansion in 2Q2026 paying accounts during Citi’s forum, which made me skeptical about their full-year ambitions.
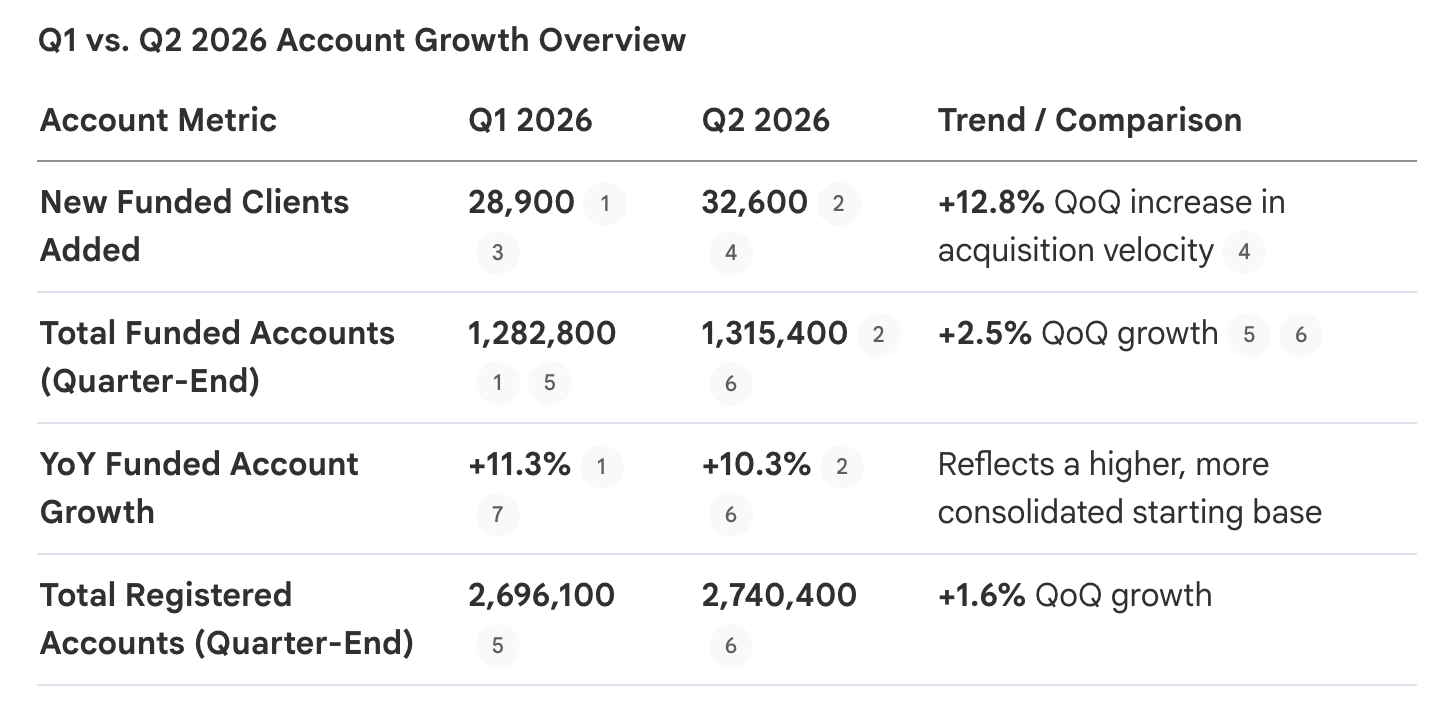
Sure, you could look at the second-quarter addition of 32,600 new funded accounts – up 12.8% sequentially – and claim acquisition velocity is picking back up. Yet when you factor in aggressive marketing spend, the trajectory remains sluggish.
Compare that to Futu, which added a staggering 250,000 accounts in a single quarter, and the gap becomes glaring.
To be fair, pitting Tiger against Futu isn’t entirely apples-to-apples. Futu trades at roughly 18 times Tiger’s market capitalization, operates across a broader geographic footprint, and benefits from vastly stronger brand recognition.
Looking under the hood of where these users actually originate reveals consistent geographic drivers. Singapore and Hong Kong continue to serve as the core engine. In Q1, the two markets split the share almost evenly to account for over 75% of new funded accounts, maintaining that momentum in Q2 by driving over 70% of the cohort. Meanwhile, Australia and New Zealand are pulling more weight, growing their contribution from around 20% in Q1 to nearly 25% in Q2.
I could have also categorized this point in my “mixed signal” bucket to be fair. You have the account growth reacceleration, markets outside of HK and Singapore growing rapidly, and another silver lining here lies in asset quality (vs. a sole focus on raw volume). We may be far removed from the hyper-growth account surges of 2021, but account capitalization has hit record territory.
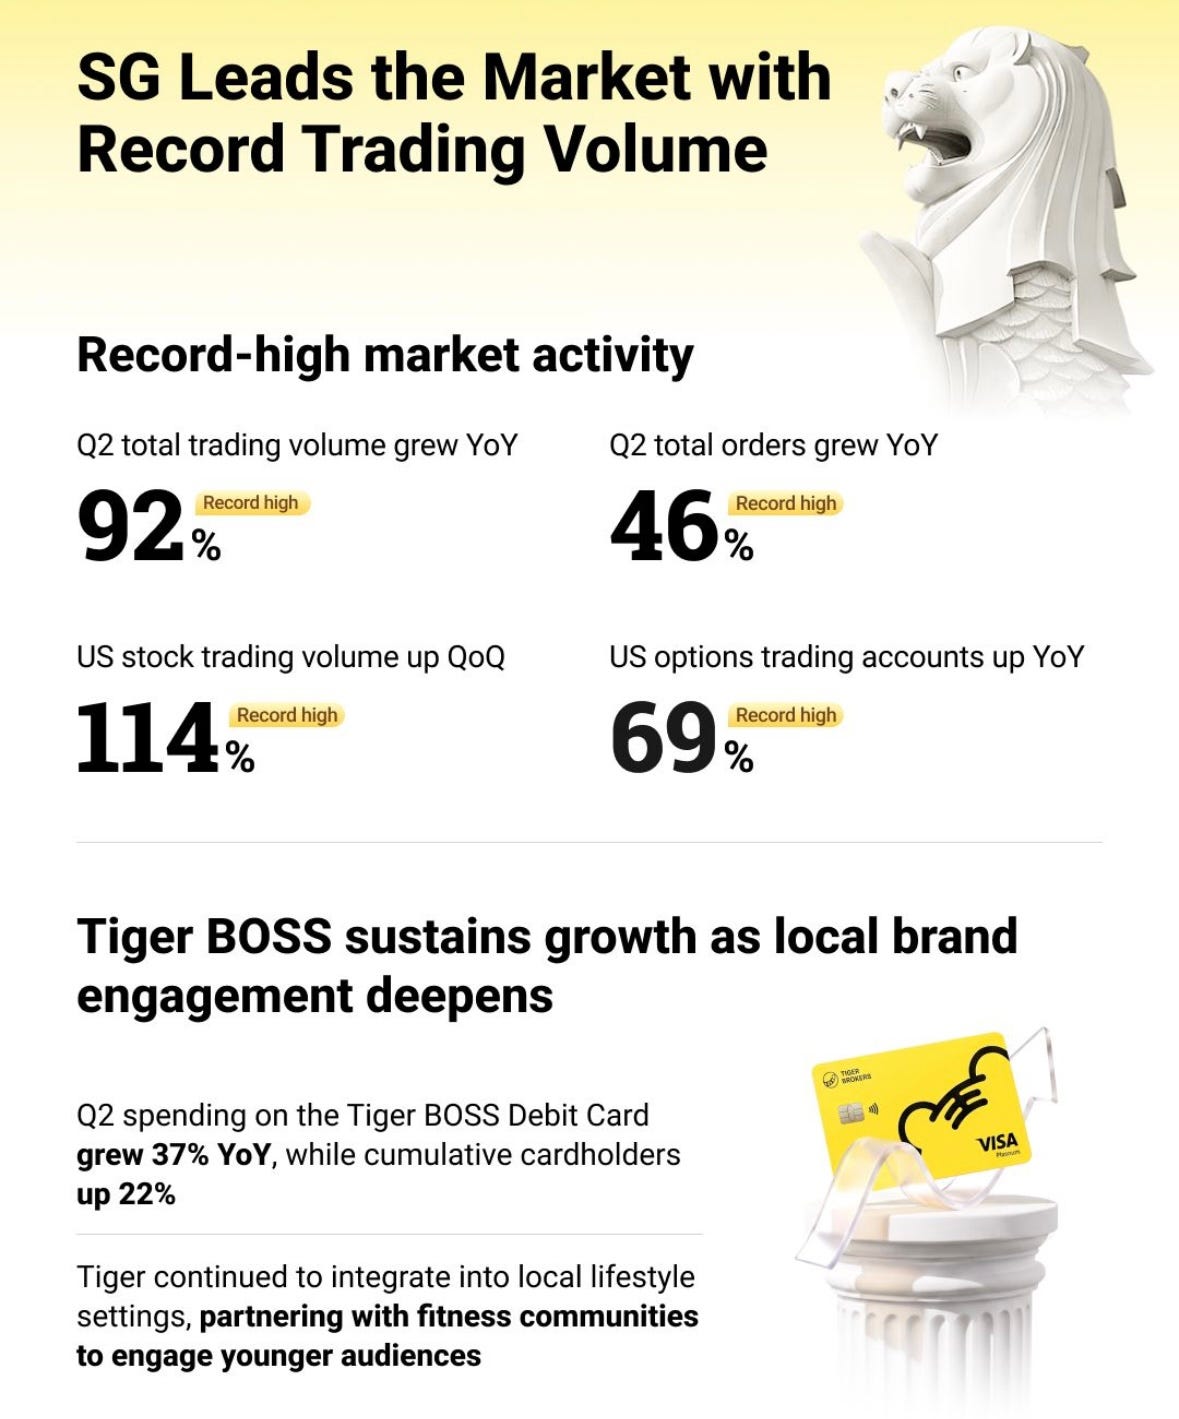
Tiger logged its first-ever quarterly retail net asset inflow exceeding US$2 billion in Q1, followed by overseas retail users adding another US$1.5 billion in net asset inflows during Q2. More on this, along with a beautiful chart, in the highlights section. Overall, the platform is pulling in higher-net-worth capital, but if top-line user acquisition keeps lagging, reliance on asset inflows alone might not keep the growth story intact for long.
Lowlight #3: The Compression Conundrum: Understanding Take Rate Pressures
For starters, a brokerage’s take rate is a measure of monetization efficiency.
And specifically, cash equity take rate measures how much revenue a broker generates from standard stock and ETF trades relative to the total dollar value of those trades processed on its platform. It is typically expressed in basis points (bps), where $1 = 0.01 bps = $1 revenue per $10,000 traded.
Tiger’s cash equity take rate has faced significant sequential pressure over recent quarters, dropping steadily from 7.1 bps in Q3 2025 to 6.4 bps in Q4 2025, 5.0 bps in Q1 2026, and down to 3.6 bps in Q2 2026.
During the Q1 and Q2 2026 earnings calls, CFO John Zeng detailed the primary a) structural and b) market-driven forces behind this compression.
Structural Factors
The main structural headwind stems from dilution caused by “zero-commission” volume expansion. Tiger’s fastest-growing trading hubs operate under zero-commission pricing models, which heavily dilutes the blended take rate when trading volumes surge. In the U.S., Tiger’s subsidiary onboarded highly active local traders, causing a sequential volume uptick of roughly $10 billion in Q1 2026 and an additional $15 billion in Q2 2026. Under local market practices, Tiger offers zero commission to local U.S. users – meaning this massive surge in volume generated zero commission revenue, directly pulling down the overall cash equity take rate.
Similarly, in Q1 2026, Hong Kong stock trading volume comprised a larger portion of overall stock trading. Because Tiger offers zero commission to HK clients trading HK stocks – which operates at a take rate roughly 2 bps lower than U.S. stock trading – this shift in geographic mix further compressed the blended equity take rate.
Market Factors
Beyond structural volume shifts, market-driven “per-share” pricing mechanics played a major role. Because Tiger charges U.S. stock commissions on a per-share basis rather than as a percentage of total order value, market movements directly compress the basis-point take rate. In Q2 2026, high-demand technology and semiconductor stocks traded at exceptionally high share prices. For highly priced stocks, a per-share fee translates to a take rate of well below 1 bps on total dollar volume, dragging down the overall U.S. average. Add in the NASDAQ index surge of over 20% in Q2 2026, which inflated average share prices across the board, and clients were naturally buying fewer physical shares for the same capital outlay – causing the basis-point take rate to fall sharply.
Management expects this dynamic to bounce back when share prices pull back, which historically drives users back into lower-priced or “penny” stocks where the per-share fee structure yields a much higher take rate, just as it did in Q3 2025 when the rate hit 7.1 bps.
Finally, derivative mix and notional volumes distort the optics of the blended rate. In Q1 2026, futures trading rose to 8% of the mix (up from 6% in Q4 2025). Because futures volume is calculated on a very large notional value basis, an uptick in futures volume visually drags down the blended take rate. Interestingly, in Q2 2026, the overall blended take rate actually remained relatively stable sequentially, even though the cash equity rate dropped to 3.6 bps. This stabilization happened because the proportion of futures trading declined while option and stock trading volume increased.