
How to Measure Investing Skill: A Practical Framework to Isolate Your True Alpha
How to Prove You’re Actually Outperforming the Market (And Not Just Lucky)

You can read this article entirely for free. If you find value in this research, consider becoming a Premium Member for less than $1/day to unlock our full archive and join our growing circle of investors (I highly recommend checking out “The Library” to see what’s inside; you can find it right on the homepage).
Why join the community, you may ask? Our library is fast approaching 70 comprehensive deep dives, providing institutional-level research on some of the world’s most fascinating businesses. Most recently, we’ve dissected companies like Mercado Libre ($MELI), Grab Holdings ($GRAB), Fair Isaac ($FICO), and Topicus.com ($TOI).
As a member, you get:
Complete Access: Every deep dive in our library (65+ and counting).
More Content: Company updates; powerful valuation spreadsheets, frameworks, and processes; regular portfolio updates (insights into my investing decisions); market commentary: etc.
The WhatsApp Community: Real-time discussion and networking with like-minded investors.
Digital Investing Conferences: 3-4 times a year, we also hold digital conferences where members present and share stock ideas, and discuss broader themes, and we’d love for you to join in!
Incredible Value: Full access to all of this for less than $1/day.
If you want to see the level of research we provide before committing, the following deep dives are, for instance, free to read (access them via The Library):
InPost ($INPST) - generated an IRR of >400% as an acquisition offer emerged 2-3 months post write-up
DigitalOcean ($DOCN) - up 5x in less than a year post write-up release

Ultimately, for active investors, only one metric matters: the total return at the bottom of the statement.
When that number beats the benchmark, we congratulate ourselves on our superior analytical capabilities. When it lags, we blame macroeconomic shifts, temporary market irrationality, or bad luck.
But a portfolio’s absolute return is a deceptive metric. It conflates entirely different types of decisions, hiding structural flaws behind a temporary streak of good fortune, or obscuring brilliant research beneath poor execution.
If you do not know exactly which of your decisions are generating returns and which are destroying capital, your investment strategy is essentially a black box.
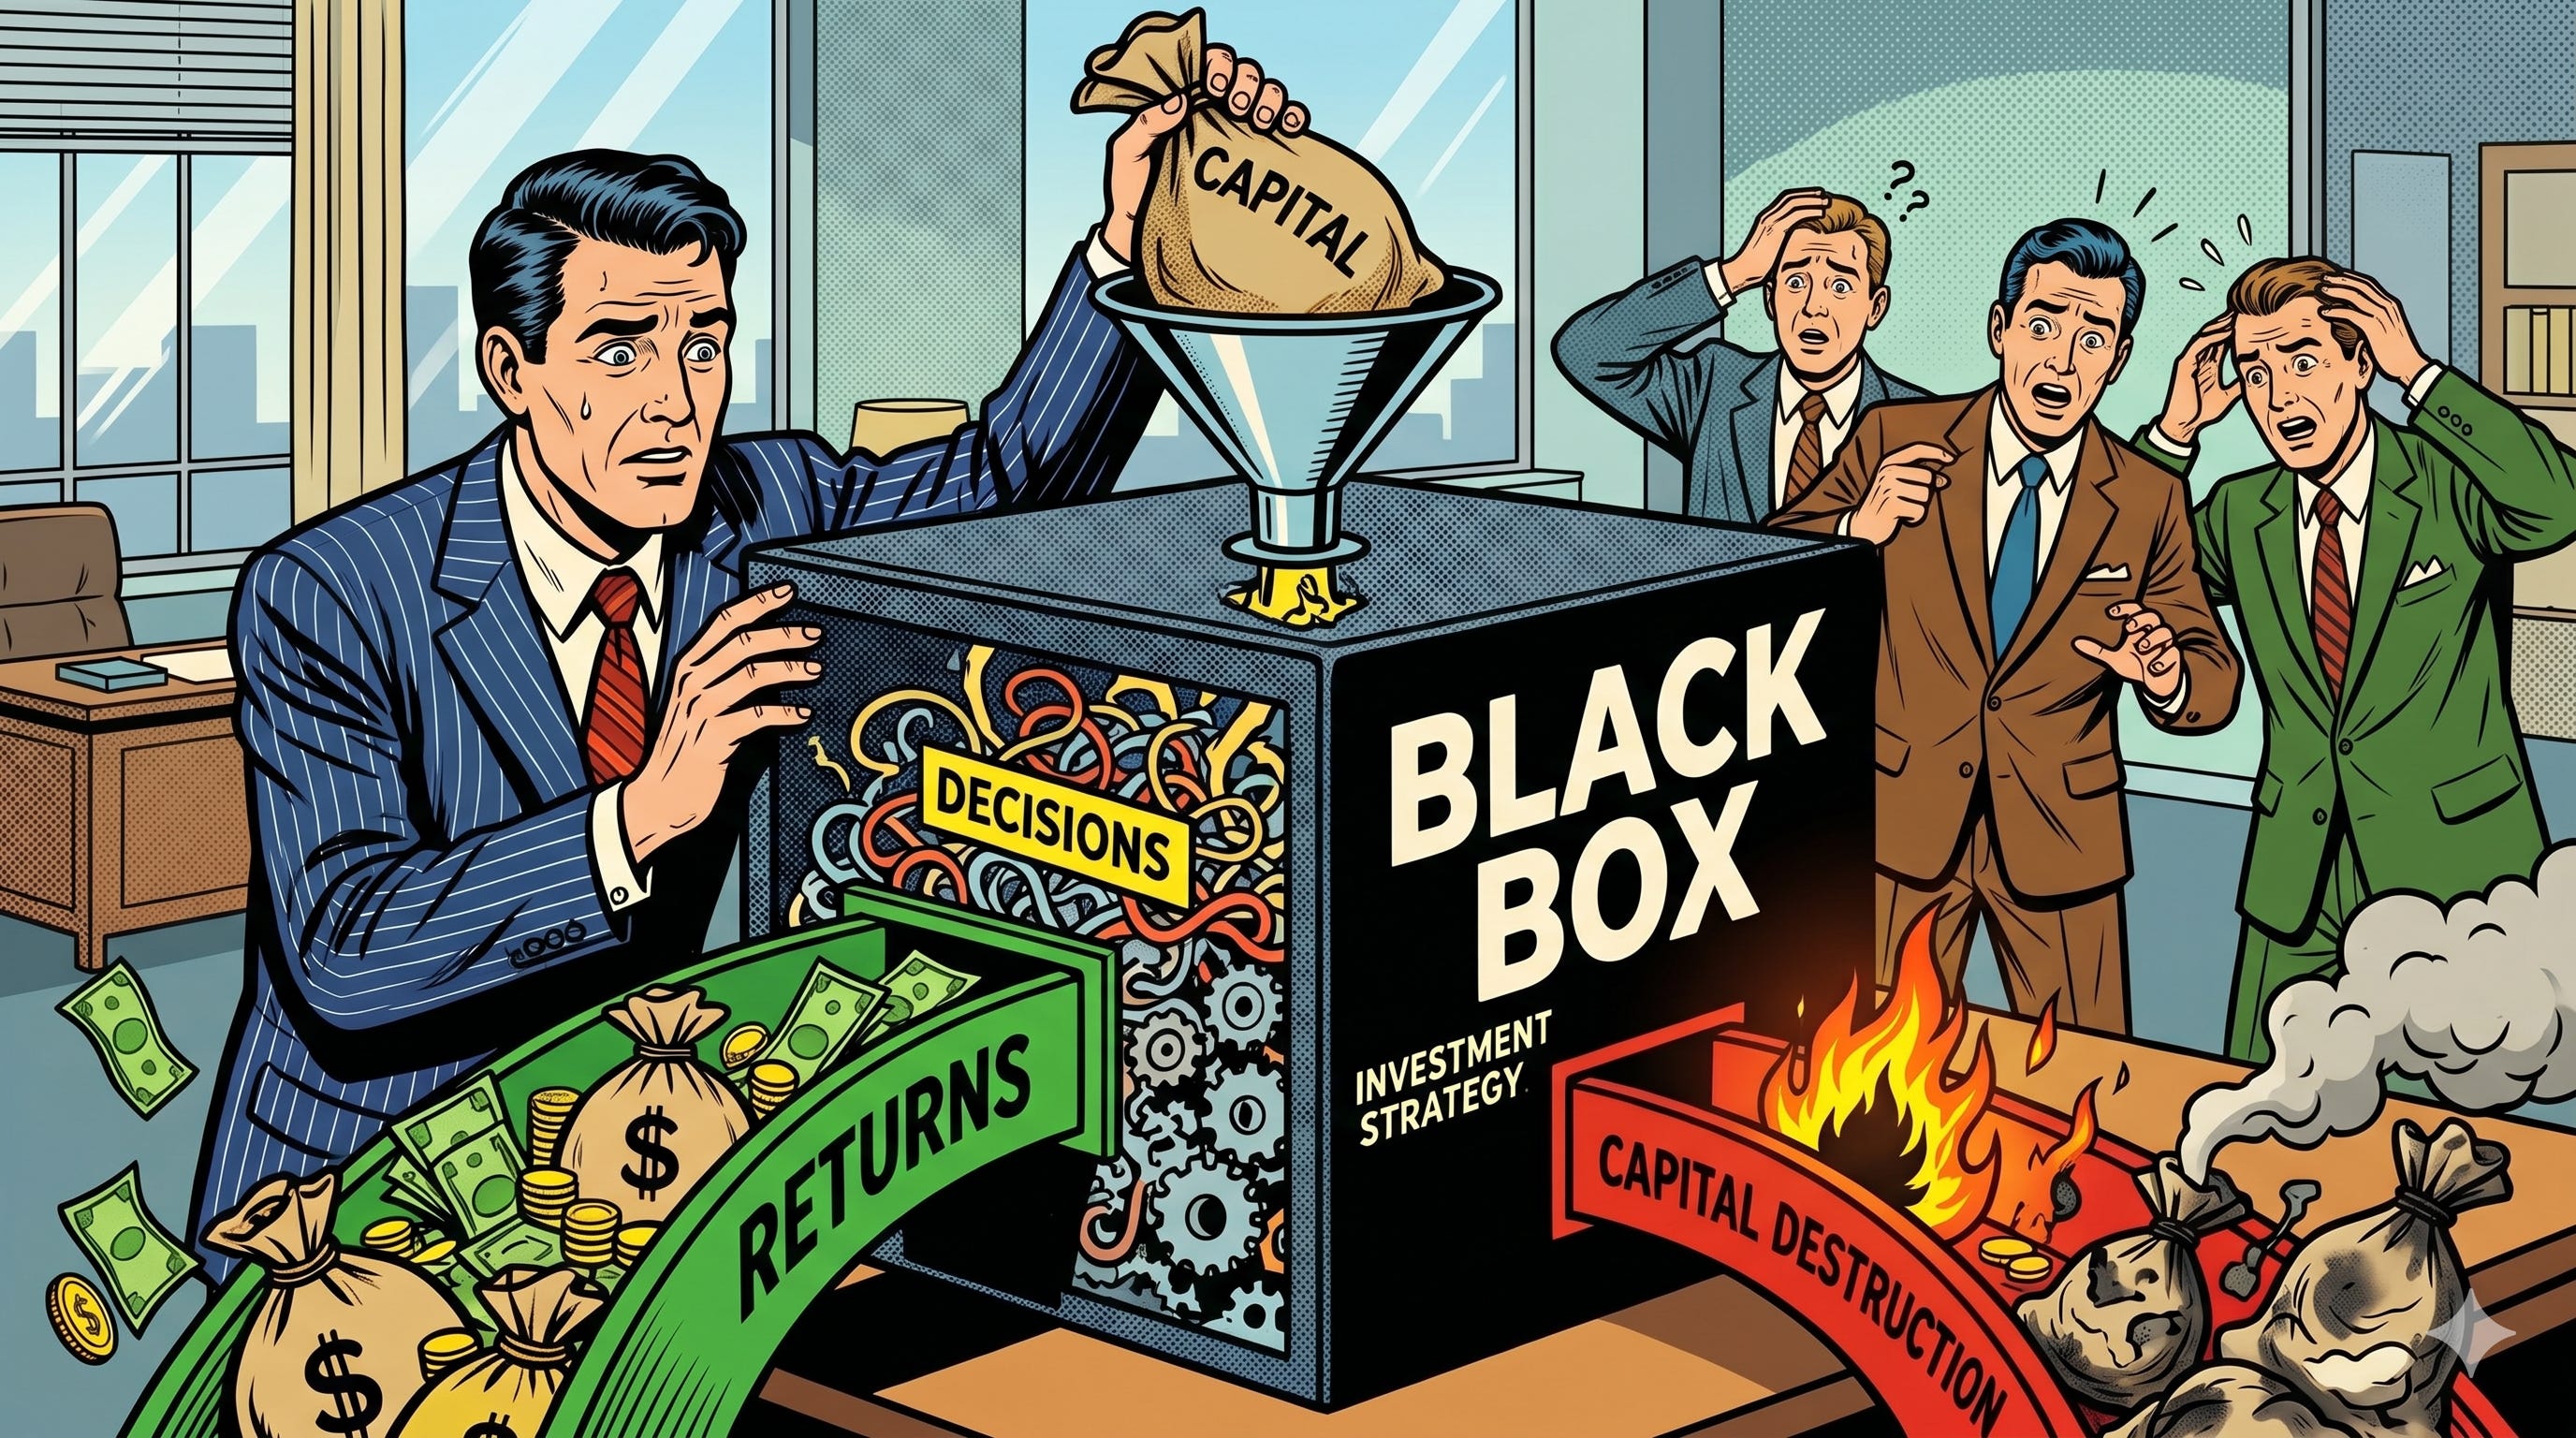
To understand where your performance truly comes from, you have to break your process down into its component parts.
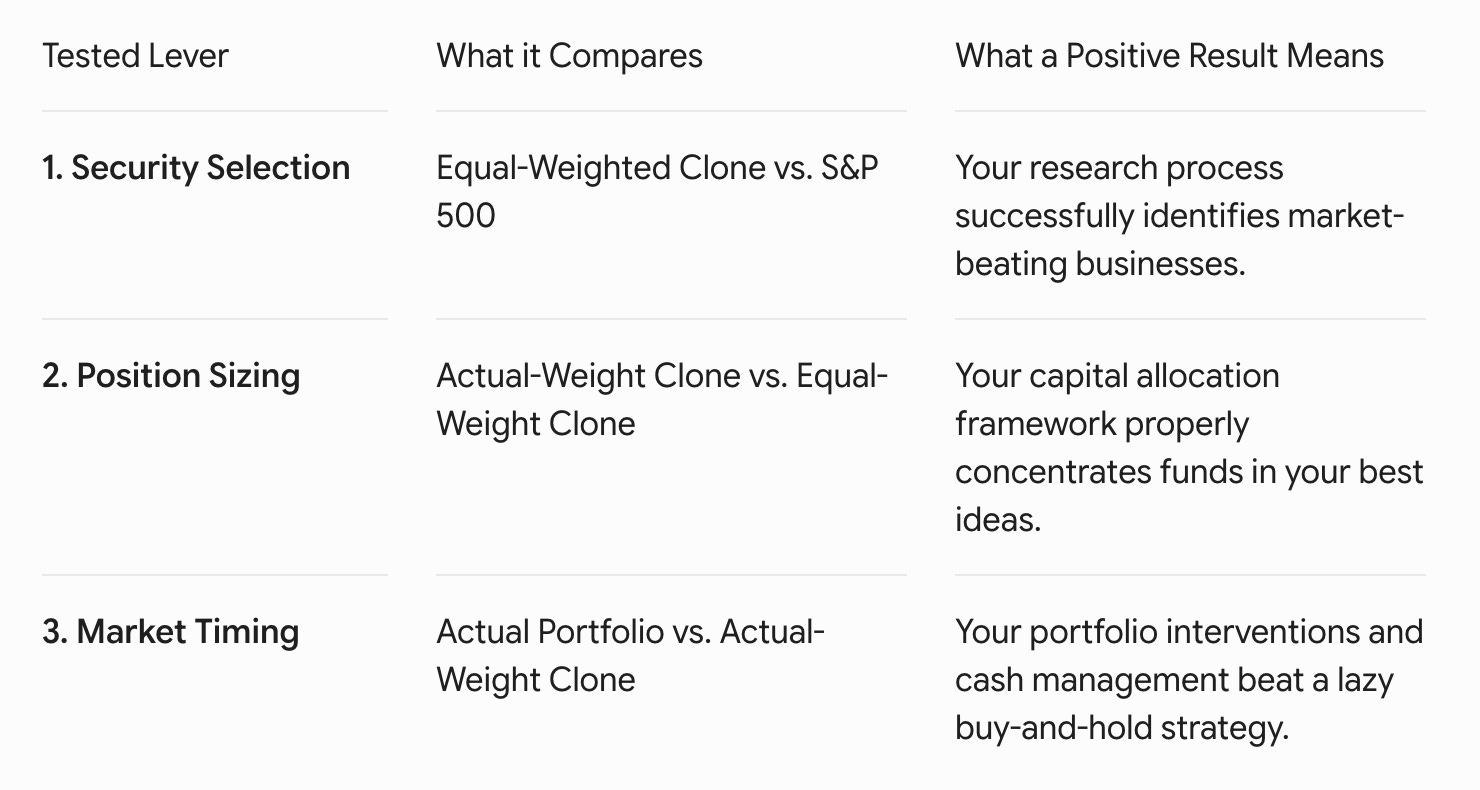
Michael Mauboussin has written extensively about the fact that active management relies on just three fundamental levers to drive long-term returns:
The first is security selection, which is your ability to identify businesses (regardless of quality) mispriced by the market.
The second is position sizing, which dictates how efficiently you allocate capital across your best ideas based on conviction and expected value.
The third is market timing, or your capacity to execute transactions at moments when human emotion drives asset prices away from their intrinsic worth.
Most investors assume that if they are decent stockpickers, the rest of the portfolio mechanics will naturally fall into place.
This is a dangerous assumption.
You can be an exceptional analyst who uncovers phenomenal corporate compounding machines, yet still underperform a basic index fund because you systematically underweight your best ideas or trade too frequently.
The human mind is highly adept at creating narratives to justify past behavior, meaning you cannot rely on memory or intuition to evaluate your performance.
Ideally, you need an objective, quantitative audit.
The only way to achieve this clarity is through counterfactual testing. You must compare your actual, real-world portfolio performance against an actual benchmark index (ideally, the highest quality one) or a series of hypothetical, automated baseline portfolios.
Comparing your portfolio against a benchmark like the S&P is well-understood by the investing community and integrated into basically every brokerage account, so I don’t think we need to spend any time on this concept.
When focusing on comparing your performance against a hypothetical alternative portfolio to identify your strengths and weaknesses when it comes to the three aforementioned skills in investing, things get a little more complicated, though.
By stripping away individual variables one at a time, you can (attempt to) isolate the exact financial impact of your selection, sizing, and timing decisions. It is an uncomfortable exercise that forces you to confront your past decision-making, but it is the only way to determine whether you possess a repeatable edge or if you are simply paying unnecessary transaction fees to lag the market.
And most importantly, if you discover you lack skill in a particular area, you can systematically adjust your rules to protect your returns.
Testing Your Pure Security Selection Skill
The foundation of any active investment strategy is the ability to find mispriced assets. Before you can evaluate how much capital to allocate to an idea or when to execute the trade, you must first answer a fundamental question:
Does your analytical framework actually identify businesses that outperform the broader market?
Most investors cannot answer this accurately because their ultimate returns are heavily distorted by erratic position sizes and the exact days they happened to buy or sell.
To isolate your raw analytical capabilities, you have to strip away all portfolio construction and trading decisions entirely.
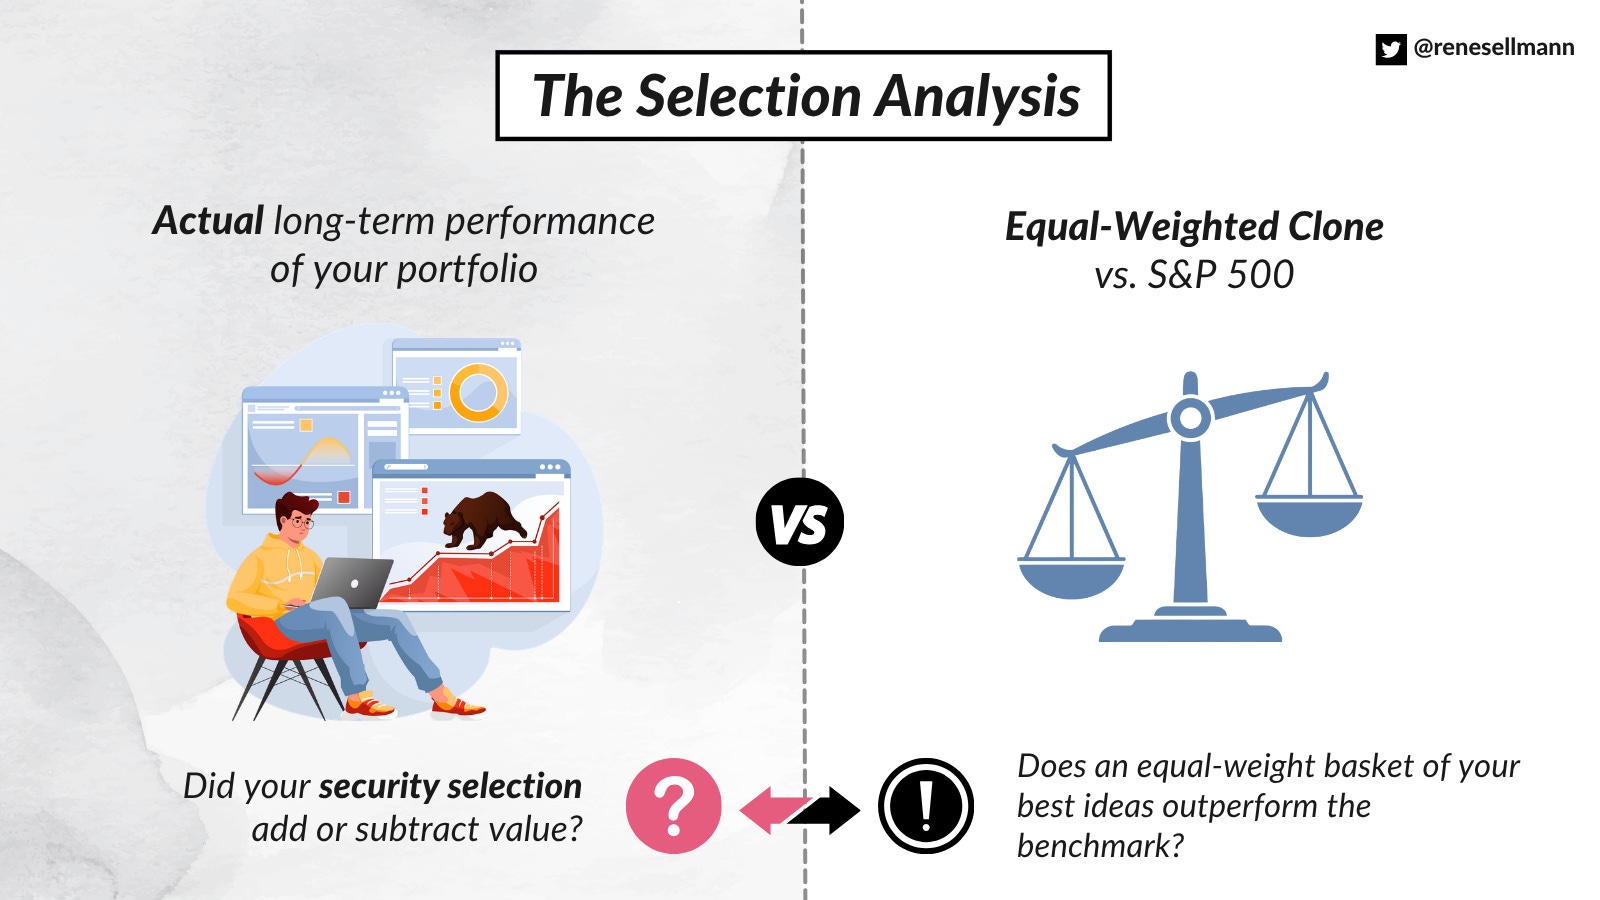
The diagnostic tool for this is the equal-weighted baseline portfolio. To construct this counterfactual clone, you review your transaction history at the start of a specific tracking period, such as a calendar year. You gather every single security you researched, approved, and ultimately purchased during that timeframe. Instead of using your real-world dollar allocations, you assume that you invested an identical amount of capital into each security on the very first day it entered your portfolio. If you owned twenty stocks over the course of the year, each would receive a strict five percent allocation.
Once this hypothetical portfolio is established, you apply a strict, automated buy-and-hold rule. You do not rebalance when prices fluctuate, you do not add to positions on dips, and you do not trim winners. You simply let the equal-weighted basket run completely untouched until the end of the tracking period.
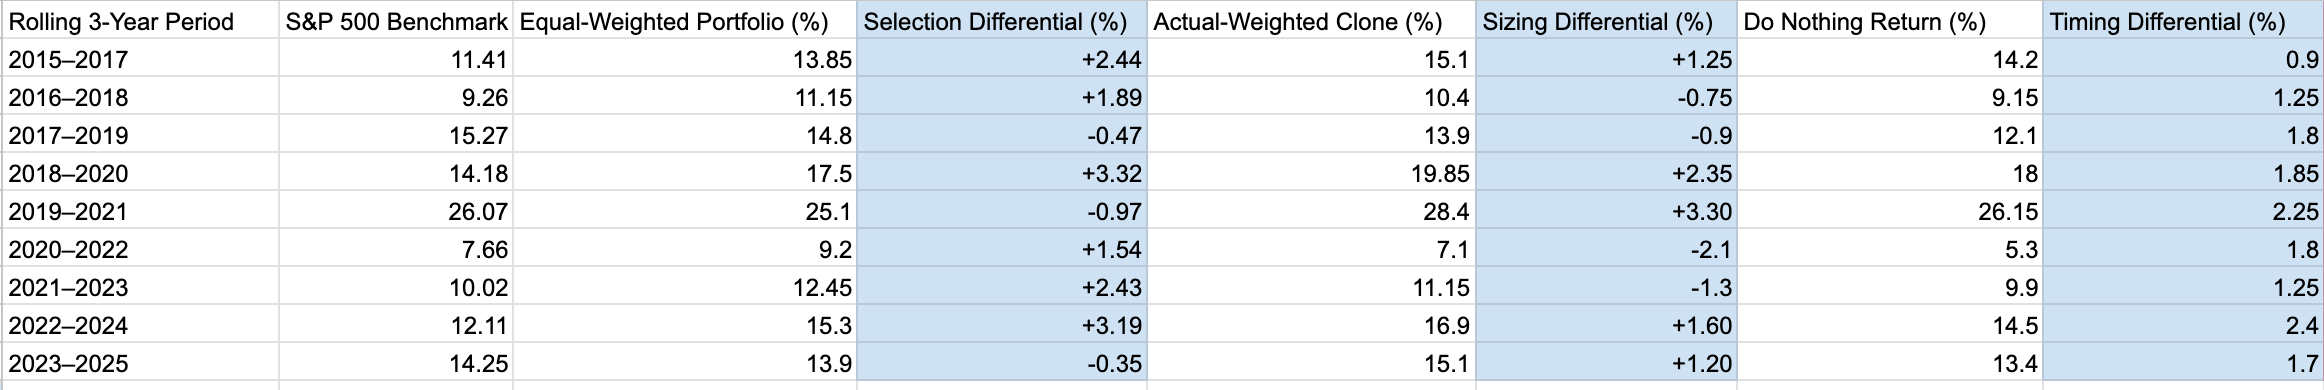
To calculate your selection skill, you subtract the total return of a relevant market index, like the S&P 500, from the total return of your equal-weighted clone.
Selection Skill = Return of Equal-Weighted Clone - Return of Market Index
If this calculation yields a positive number, your research process seemingly has a demonstrable edge. It proves that your criteria for selecting businesses can beat a passive benchmark when left alone. If the number is negative, it means your stock selection is actively lagging the market.
This is a critical realization. It indicates that the hours you spend reading financial statements, listening to earnings call, analyzing competitive advantages, and forecasting cash flows for your valuation models are not translating into superior asset choices.
Beyond looking at the individual companies themselves, understanding when genuine selection skills matter more and when it adds less value also requires an understanding of the environment in which you are operating. When there is very little variation between the best-performing and worst-performing stocks (low stock return dispersion), even a brilliant analyst will struggle to generate significant outperformance.
“Security selection skill is entirely dependent on market dispersion, which is the range of returns across a group of stocks. If all stocks in the S&P 500 return roughly the same amount in a given year, picking the “best” stock yields very little excess return, blunting your skill. High dispersion is an absolute prerequisite for security selection skill to shine.” - Michael Mauboussin
This skill shines in environments characterized by high dispersion, where the gap between winning and losing companies is wide.
Charlie Munger famously noted that the first rule of fishing is to fish where the fish are. No matter how sophisticated your valuation tools or how disciplined your process, casting your line into efficient, highly competitive, low-dispersion areas means you are operating in dead water.
Testing Your Sizing Skill
Once you establish whether your research process can identify outperforming businesses, you must confront the second lever of active management: capital allocation.
Position sizing is the bridge between security analysis and portfolio execution. It is the process of deciding exactly how much of your investable capital to risk on a single idea. In theory, an investor should allocate the most capital to their highest-conviction ideas, where the gap between price and intrinsic value is widest and the probability of a positive outcome (will the market recognize that gap in a reasonable time frame?) is highest.
In practice, however, portfolio construction is often driven by allocation towards assets that provide emotional comfort (often what has worked most recently), historical anchoring, arbitrary percentage limits, or mathematical formulas (like the Kelly formula) that only work if you have a large enough sample size – and even Warren Buffett famously stated that Berkshire Hathaway’s incredible, multi-decade returns are the product of roughly a dozen (about 10 to 12) truly good decisions, averaging out to just one phenomenal call every five years.
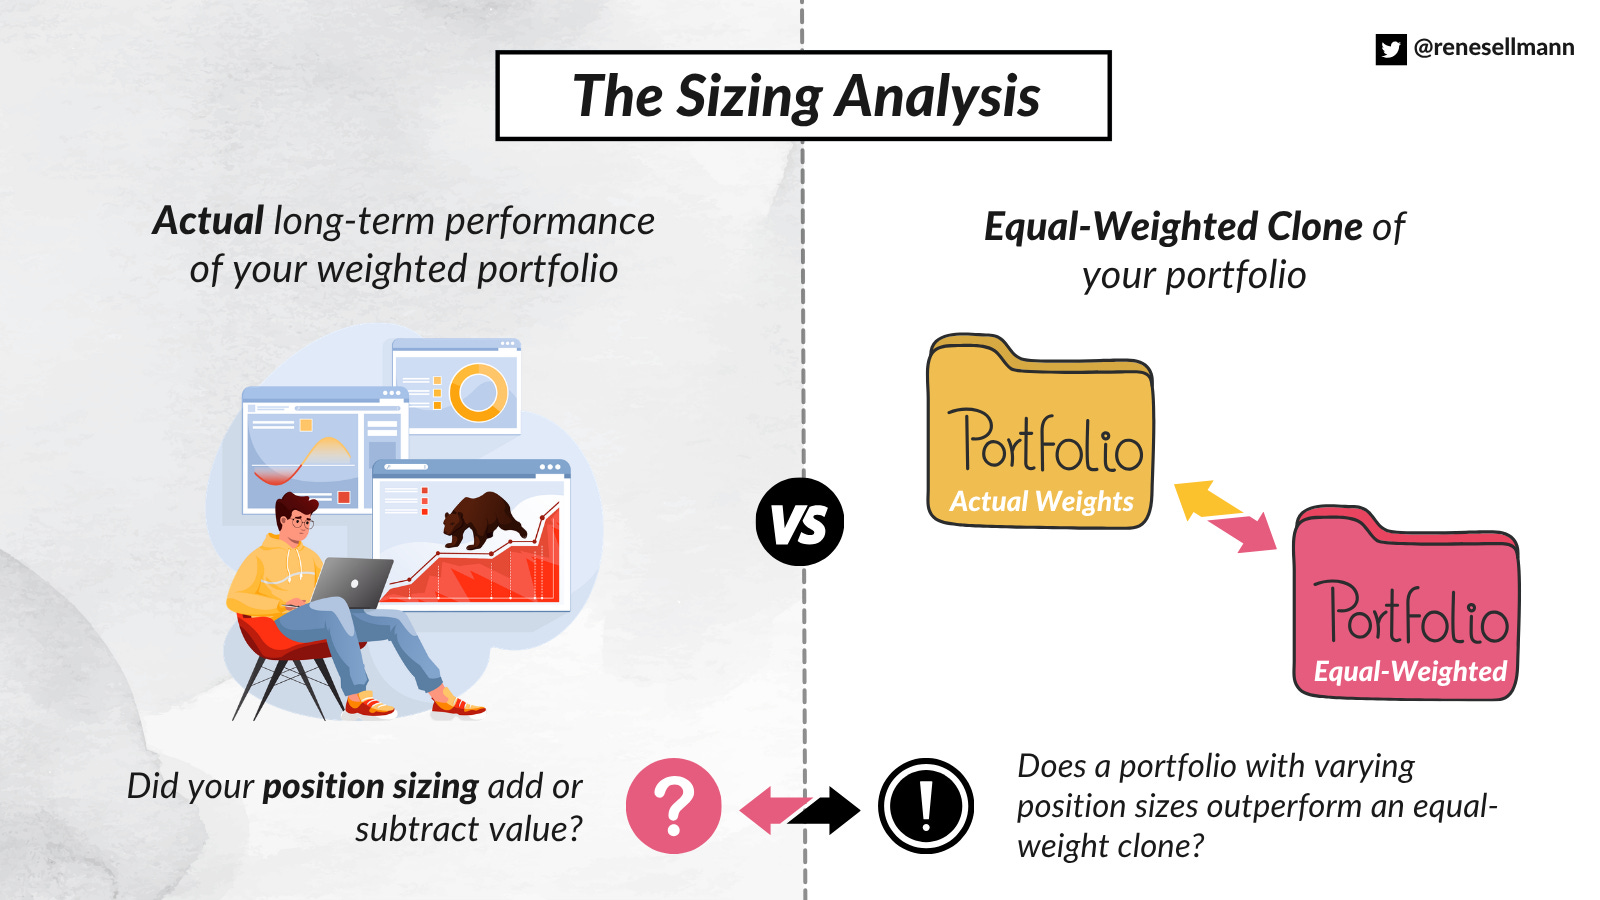
To determine if your sizing decisions are actually improving your returns, you must run a direct comparison between your real-world choices and your raw research capability. The baseline for this test is the equal-weighted clone you constructed in the previous step. The counterfactual portfolio is your actual weighted portfolio – you apply the initial or target weights you assigned to them in real life at the start of the period (remember that we want to isolate the sizing decisions from timing elements). Again, crucially, you still maintain a strict buy-and-hold rule for this clone. You do not allow real-time trading, trims, or additions to alter the performance. You are simply letting your chosen weights run.
By comparing these two hypothetical portfolios, you isolate the exact wealth effect of your sizing logic. The mathematical equation is straightforward:
Sizing Skill = Return of Actual (Weighted) Portfolio - Return of Equal-Weighted Clone
A positive result reveals that your capital allocation framework is functioning correctly. It proves that you successfully concentrated capital in your biggest winners and kept your losing ideas small. If the result is negative, you are suffering from the conviction paradox. This occurs when an investor’s highest-conviction, heavily weighted positions underperform, while the small, tracking positions that they barely funded end up skyrocketing.
If your sizing skill metric is consistently negative, it means your intuition about your own edge when it comes to position sizing is flawed. Your portfolio would have generated superior returns if you had simply closed your eyes and split your capital evenly across every stock you bought.
Facing this data forces you to reconsider how you define conviction. It tells you that your subjective feelings of certainty are actually a contrarian (!) indicator for your performance.
Testing Your Timing Skill
The third and final lever of active management is timing. In the context of a disciplined investment strategy, this does not necessarily refer to guessing the direction of the macroeconomic cycle (even though it may) or predicting short-term index swings.
Instead, (market) timing represents your explicit trading activity. It is the total impact of your decisions to scale into a position using multiple tranches, trim holdings when they appear temporarily overvalued, trim them when the thesis supposedly changes, add to losing positions during market panics, or hold cash while waiting for the wisdom of the crowd to give way to the madness of the crowd. Thus, it is important to consider your cash allocation, too, when comparing your actual portfolio performance to that of the hypothetical benchmark.
Every time you log into your brokerage account and hit a buy or sell button, you are making a timing decision. Full stop. Most active investors tinker with their portfolios constantly, convinced that these minor adjustments optimize their returns and mitigate risk.
Well, in reality, more often than not, they don’t …
To discover whether this transactional activity is actually adding alpha for you, you must pit your real-world performance against a completely passive version of your own strategy.
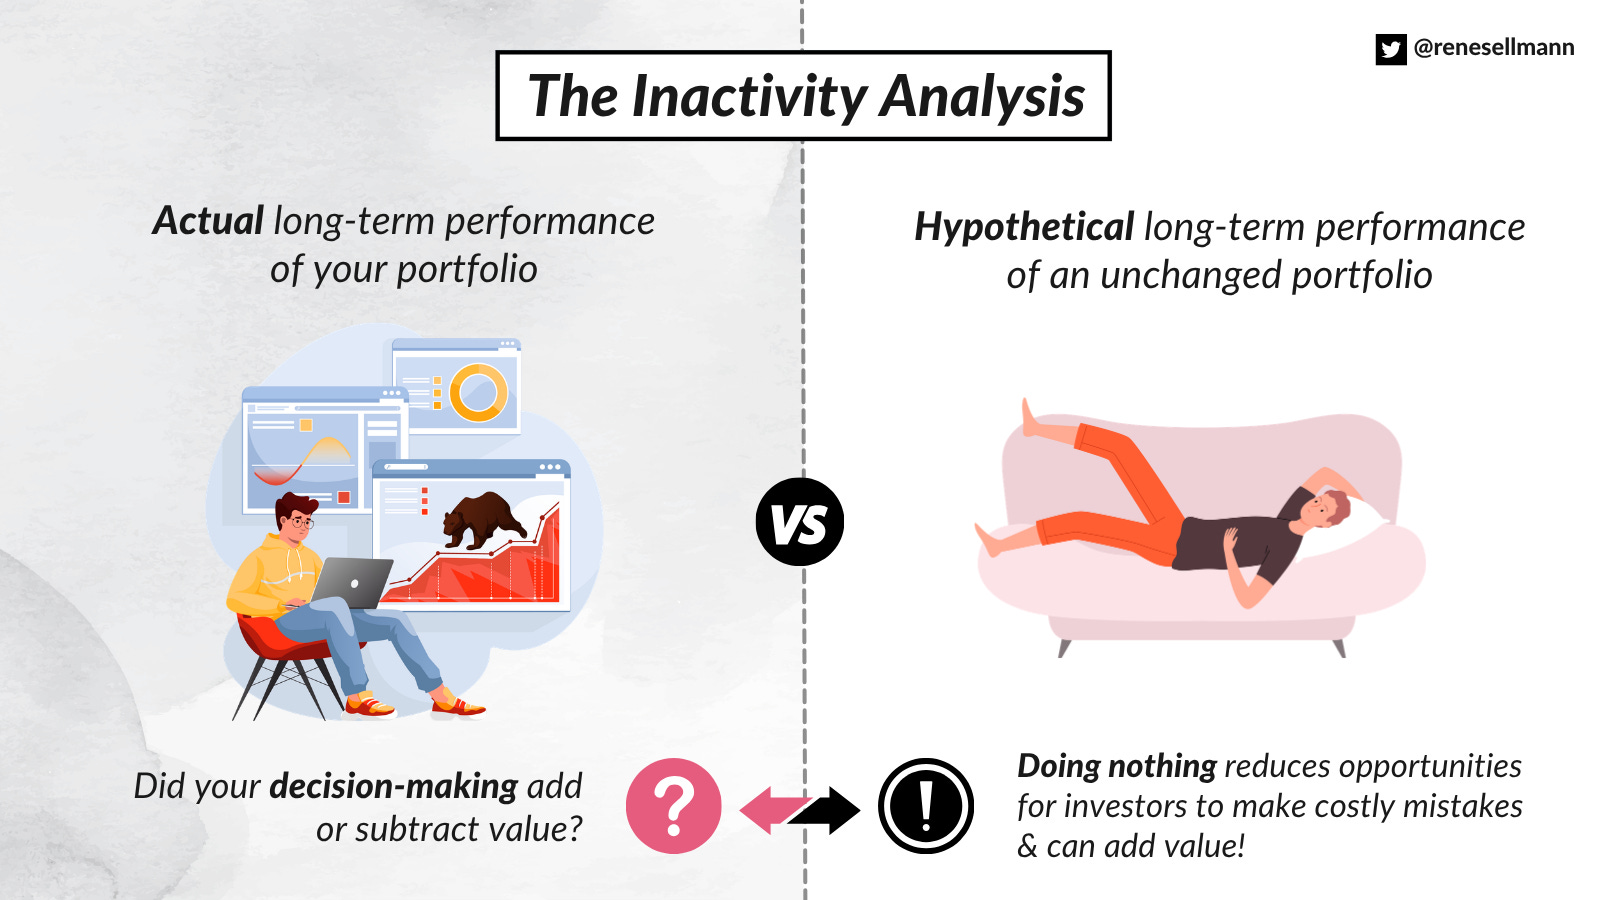
The baseline for this diagnostic test is once again the actual-weighted static clone of your portfolio at the beginning of the period you analyze. This clone holds the exact companies you selected, at your exact weights, but assumes you fell asleep on day one of the tracking period and did absolutely nothing until the end of the year.
You compare the performance of this do-nothing portfolio to your actual, real-world portfolio performance influenced by trading decisions in between. Thus, your real portfolio reflects all your frantic adjustments, optimization attempts, your cash balances, and your emotional interventions.
Timing Skill = Actual Portfolio Return - Return of Static/Inactive Clone
If your real portfolio outperforms the static clone, your execution is superior. Your interventions worked. You successfully bought panic-induced bottoms and trimmed euphoric tops.
If this number is negative, however, your attempts to exploit market inefficiencies were actually just expensive noise. You fell victim to overtrading, panic-selling at the exact wrong moment, trusting your “intuition,” or missing out on massive compounding moves because you were sitting in cash trying to time a pullback.
When analyzing this specific metric, you must also be brutally honest about transaction costs and taxes. A “timing strategy” inherently increases portfolio turnover. If your trading decisions beat the static clone by one percent on paper, but short-term capital gains taxes consume more than one percent of your capital, your net timing skill is destructive to your wealth.
For the vast majority of active investors, this test provides a harsh reality check. It reveals that the desire to do something during periods of market volatility (action bias) is an emotional coping mechanism rather than a sound strategy.
If your static clone consistently outperforms your actual portfolio, the data is telling you to stop trading. Your research is valuable, but your execution is broken. The most profitable adjustment you can make is to automate your process and purposely lock yourself out of your account to let residual compounding do the heavy lifting.
Time Horizons and the Role of Luck
Running these diagnostic tests on your portfolio will inevitably provide you with hard data, but interpreting that data introduces a massive structural problem:
What’s the right timeframe to evaluate your performance?
Investing is a fundamentally probabilistic field, meaning that short-term results are entirely unreliable indicators of true skill. You can execute a flawed process and win, or you can maintain a flawless process and lose. At least over shorter time frames, that’s entirely possible. We wrote an entire blog post about this idea here:
Thinking in Bets: What Poker and Horse Racing Teach Us About Markets

Most people wouldn’t naturally group stock market investing, poker, and horse betting into the same category. One has billion-dollar companies and earnings calls, another is played in smoke-filled card rooms (or sleek online interfaces), and the third involves animals, turf, and betting slips.
In short, feedback loops in investing are terrible. That inherent messiness is exactly what makes probabilistic domains so incredibly difficult to navigate – and so utterly fascinating at the same time.
The core issue is sample size. In a casino, a roulette wheel spins thousands of times a day, allowing the house edge to smooth out random variance relatively quickly. In investing, your lifetime sample size is remarkably small. Even a highly active investor might only make a few hundred serious bets over an entire career. More focused, concentrated, long-term investors might only make a few dozen. When you operate with such a limited number of trials, outcome randomness becomes exceptionally difficult to smooth out.
Skill certainly plays a crucial role over a long enough horizon, but luck dominates the short term. While luck dictates your immediate quarterly or annual returns, process-driven thinking and sound probabilistic reasoning are the only things that win out over time.
This reality requires a profound mindset shift that many investors – especially newer ones – struggle to make. Human biology wires us to crave certainty, to seek patterns in noise, and to believe that good outcomes must come from good decisions while bad outcomes must come from bad ones. In a probabilistic environment, that simply is not how the world works. You can make a perfect decision based on thorough research, appropriate sizing, and disciplined timing, and still lose a significant amount of money because an unpredictable, low-probability event occurs.
Conversely, you can make a terrible call based on a hot tip, over-allocate your capital, and get incredibly lucky because a speculative bubble lifts your asset.
To survive as an active manager, you must learn to evaluate the quality of your decision, not just the final result. This is particularly true because short-term stock performance is primarily driven by shifting market sentiment, macroeconomic headlines, or broader industry dynamics. The underlying company fundamentals – the actual earnings growth, cash flow generation, and return on capital that you spent hours researching – rarely dictate the stock price over a six-month or one-year period. Those fundamentals require a much longer timeframe to manifest in the market price.
So if you run the tests we presented in this article over a single calendar year, a sudden sector rotation can make your excellent security selection look incompetent, or your terrible position sizing look brilliant.
Hence, I believe you must track these metrics across …
a) multi-year periods (I’d suggest 2-4 year time frames) and
b) rolling periods
… to ensure you are measuring your repeatable edge rather than the temporary whims of luck.
The Hard Choices of an Honest Audit
Conducting such an audit can be a deeply humbling experience. It strips away the comforting narratives we construct to justify our returns and forces us to look directly into a behavioral mirror.
The rational brain is fantastic at rationalizing irrational decision-making.
At the end of your tracking period, when you aggregate the metrics from your hypothetical portfolios, you are left with an objective blueprint of your investment capabilities.
This attribution matrix removes all ambiguity, mapping your actions directly to their financial consequences across the three core levers of active management.
The true value of this matrix lies in the actionable clarity it provides. If the data reveals that your security selection skill is strong but your sizing metric is consistently negative, you know your research is solid, but you need to work on your sizing (either managing risk more properly or betting bigger on your best ideas; or both).
If your timing metric is the primary culprit destroying your alpha, the path forward is equally clear: you must lower your portfolio turnover, minimize your trading activity, and intentionally lock yourself out of your account to allow your underlying businesses to compound uninterrupted.
You might be completely in love with the daily intellectual challenge of active management, spending hours parsing financial statements and tracking market dynamics. But if you lack a quantifiable edge in at least one of these three crucial domains, your efforts are effectively a form of expensive entertainment. It is far better to know the truth than to operate in the dark.
Does this mean you need to give up on the pursuit of active investing? Not necessarily!
Remember: Investing is a lifelong pursuit.
Michelangelo’s quote “Ancora imparo“ – which translates to “I am still learning” –, who reportedly spoke these words at the age of 87, stands as a timeless reminder of the value of a growth mindset and a lifelong commitment to curiosity and self-improvement. No matter your age or expertise, there is always room to become better.
If you are currently underperforming, here’s an anecdote I truly enjoy (and you might need to hear this): Sir John Marks Templeton was a famous American-born British investor. He started his investment fund in 1954 when he was 42 years old. His fund underperformed the S&P 500 for the first 14 years. Yet, when he retired in 1991, he achieved one of the most impressive track records of all time (+17,862% over this 37-year period vs. 5,243% of the S&P).
Thus, the irony of long-term outperformance is that you need to have the confidence to stay the course and the willingness to improve and adapt when things do not work out as expected.
Confronting your data allows you to systematically patch the leaks in your process, optimize your true strengths, and protect your long-term wealth.
If the data ultimately reveals that you have no repeatable skill across any of these levers, there is also no shame in acknowledging it. You can always simply pocket your time, buy a low-cost index fund, and let the broader market do the work for you.
Please share additional thoughts or comments you have, and leave a comment!
I am subscribed to your substack. Is this something over and above what I get there?