

Dear compounders,
A year ago, estimating a company’s return on incremental invested capital (ROIIC) meant an evening with a stack of filings and a blank spreadsheet. I pulled CapEx, marketing, and R&D figures from five years of reports, built the time windows by hand, and checked every cell twice.

I’m attaching a screenshot of my latest working template below – which I realized looks rather unorganized.
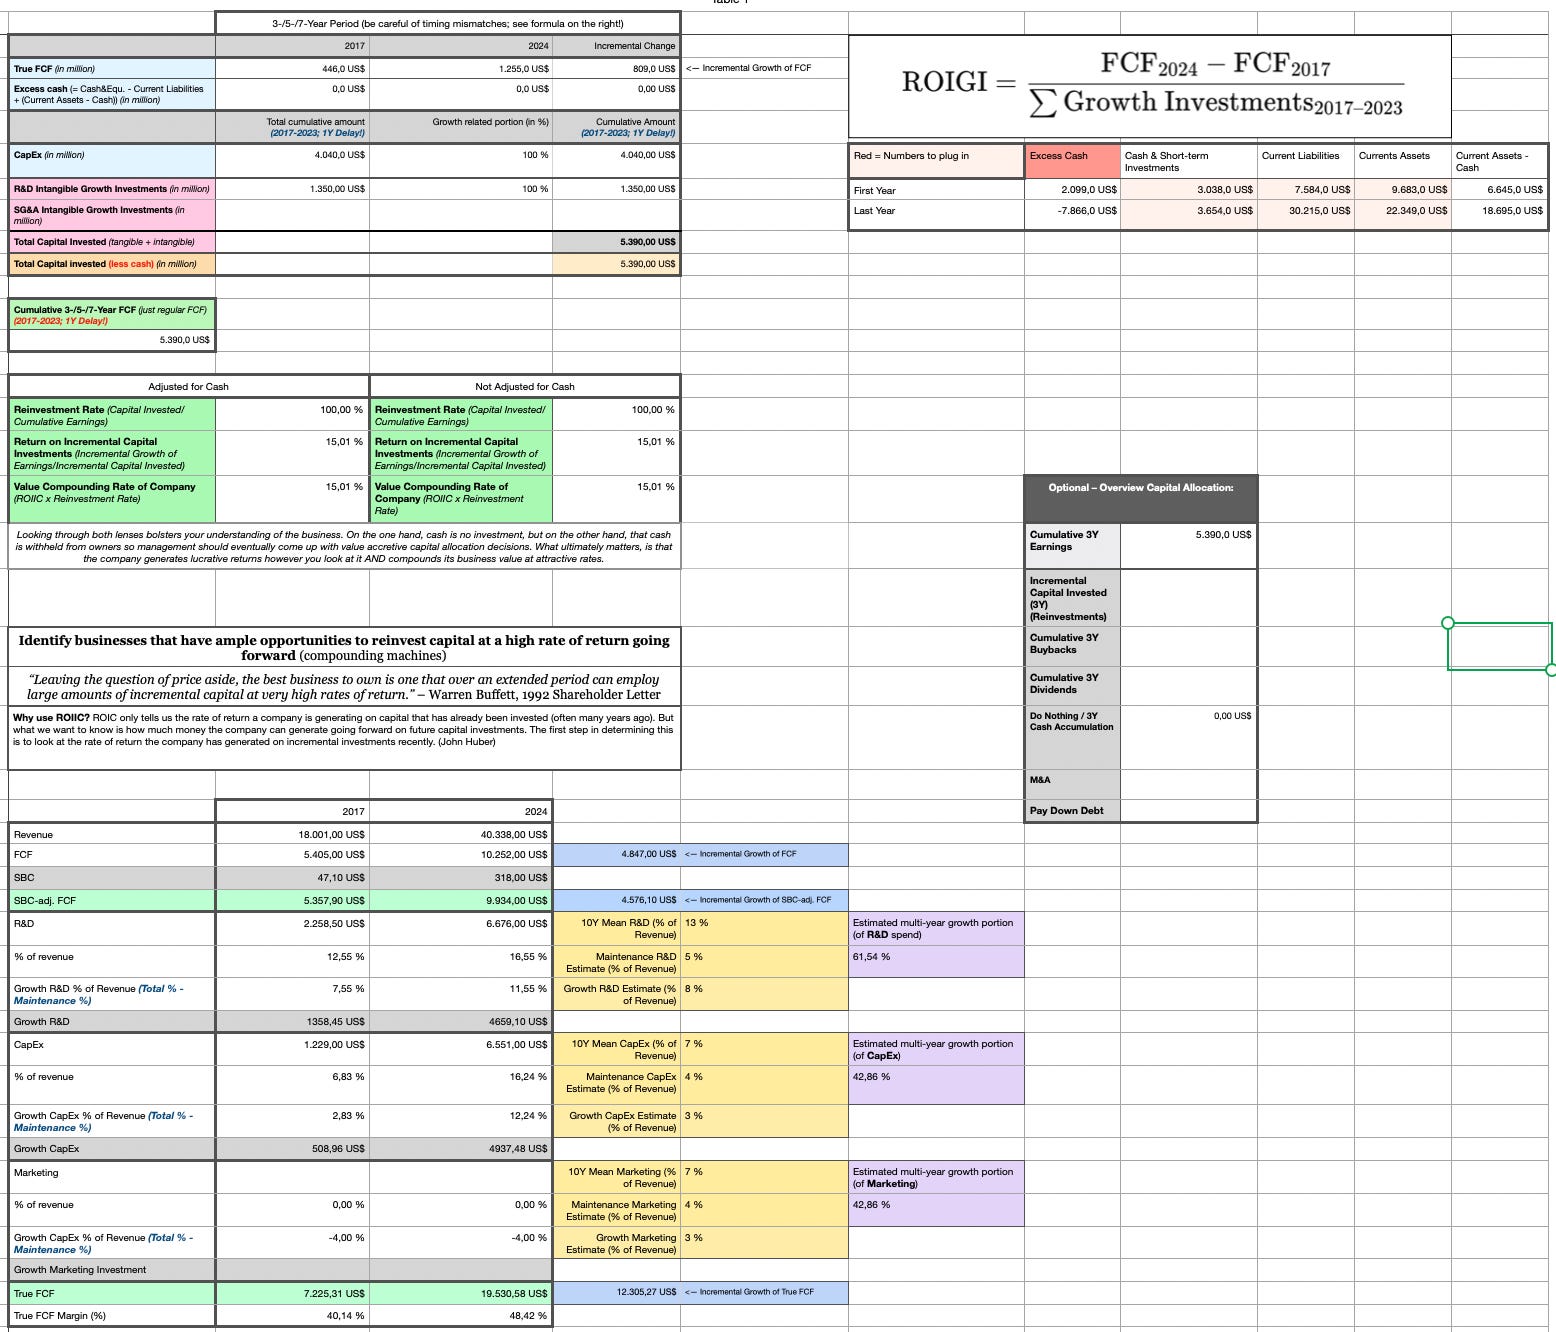
It worked.
Yet, it was also slow enough that in practice I did the calculation far less often than I should have in theory, and so for most companies on my watchlist, ROIIC stayed a purely qualitative judgment.
That has changed. NotebookLM has added tools over the past year that make the number crunching relatively quick, which means I can now run the exercise for every company I study in-depth.
My recent piece on Atour Lifestyle Holdings is a practical example: the incremental return figures in that post and the spreadsheet behind them both came out of the workflow I describe below.

One note before we start: I won’t lay out the concept of ROIIC again. I’ve written about why I care about it, and about the value compounding rate (ROIIC × reinvestment rate), in earlier posts, so this one focuses entirely on the how.
What made the difference?
Two updates changed the approach for me recently. In December 2025, Google added Data Tables, which pull figures scattered across your sources into structured tables you can export to Google Sheets. The bigger jump came in June 2026. NotebookLM now runs on Gemini 3.5, every notebook comes with a cloud computer that can write and run code, and the studio panel exports Excel files, CSVs (which helps me create these company-specific customized data visualizations in the deep dives), and charts. Those features rolled out to Google’s top AI tiers first, so check what your plan includes.
In practice, this means NotebookLM can read and screen multiple years of filings, do the math, and hand me a working spreadsheet with live formulas.
What used to be an evening of copy-and-paste is now a short conversation. And I want to share the workflow with you so you can apply it to companies in your own portfolio that I do not cover.
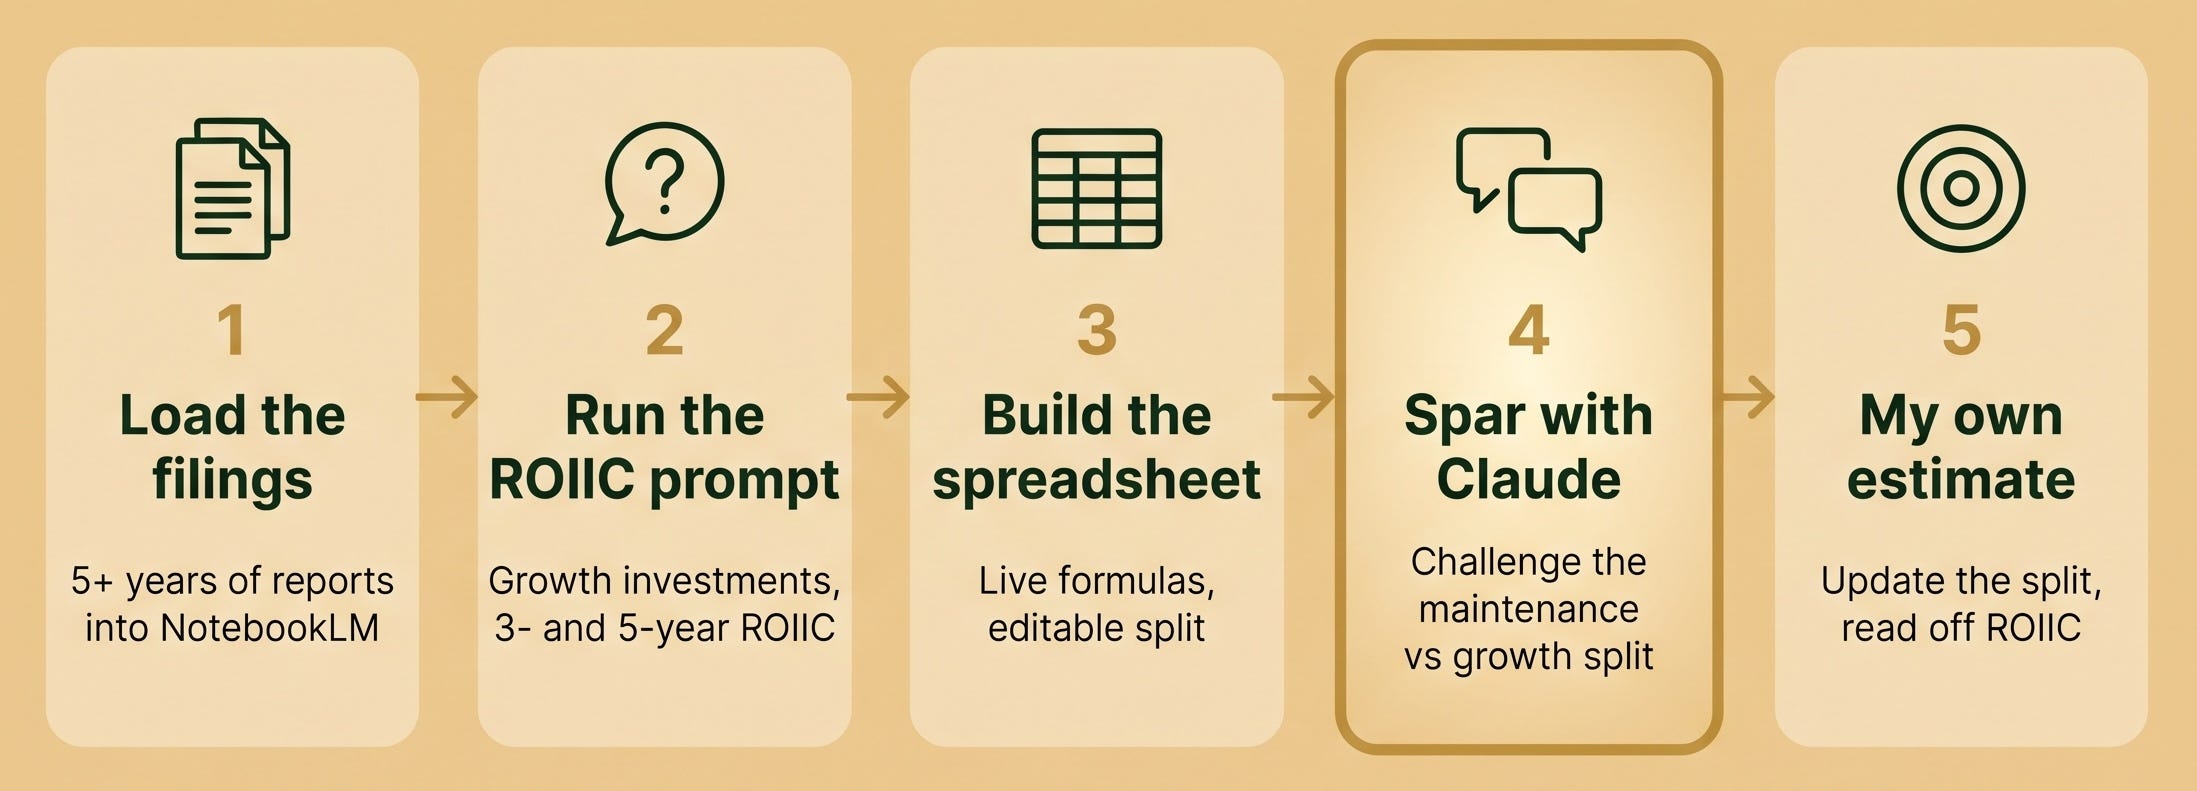
My workflow has five steps:
I load the annual reports, quarterly reports, call transcripts, and earnings decks for at least the last five years into a notebook.
I run my ROIIC prompt against those filings.
A follow-up prompt turns the answer into a spreadsheet.
I then couple the initial maintenance vs, growth split with my own understanding of the company and my own judgment when it comes to that split. That judgment is based on my understanding of the company itself, its runway, its growth ambitions, the competitive pressures, etc. etc. I then take my best guess to Claude’s most capable models and spar over it until I’m comfortable with my own numbers. This step is absolutely key. Remember: garbage in, garbage out.
Finally, I plug those numbers into the spreadsheet and read off my estimate.
Can AI tell you what counts as growth?
Partly. Every ROIIC estimate rests on one judgment call: how much of each spending line merely keeps the existing business running, and how much funds expansion. My prompt asks the AI for an educated guess on exactly that, and the answers are often reasonable. Claude on high effort is particularly good here. It reasons through each line, explains its split, and pushes back when my assumptions look off.
Still, I treat that guess as a starting point and nothing more. The split depends on how well you understand the business. Is a company’s marketing spend building a brand that keeps paying off, or is it buying this quarter’s orders on a platform that will charge again next quarter? Does the R&D budget fund new products, or does it keep the existing software running? No model answers those questions better than someone who has spent hours and hours studying a company.
So again, I form my own view on the split first. Then I bring Claude in as a sparring partner, compare its reasoning with mine and argue through the lines where we disagree. The number I end up with is my best estimate, and I own it. That ownership matters, because the split moves the result more than any other input in the calculation.

The ROIIC prompt
Here is the prompt exactly as I run it in NotebookLM: