The Temptation to Go All Cash …
Lately, I’ve seen a surge of posts from investors moving heavily into cash—or even going "all in" cash—across my social media feed.
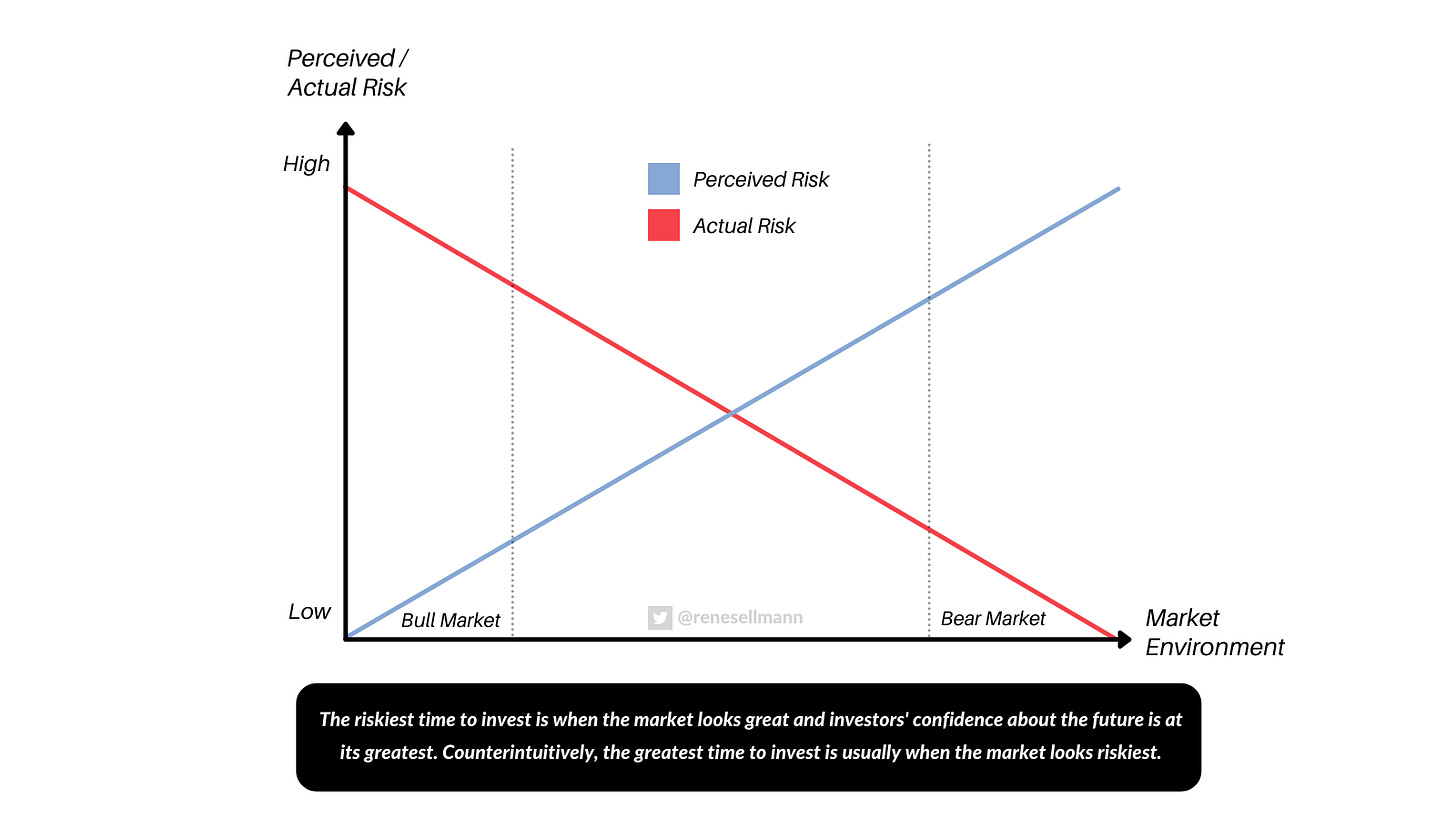
Given where we might be in the market cycle, it’s easy to see why this strategy appeals to so many. Late-cycle dynamics, the times when you can almost sense the euphoria among investors—when it seems “easy” to make money—are known for their heightened risks, and the rationale behind these decisions is understandable.
So while I resonate with the caution others are exhibiting—I can sense the exciement among (retail) investors too—, I’m not convinced that actively selling positions to build a larger cash buffer is the best approach for my portfolio.
The Signs of a Market Peak
The current market shows many classic signs of being in a late cycle. Some familiar indicators are particularly glaring:
Highly stretched valuations for certain stocks:
Widespread herding behavior amplified by social media echo chambers:
An influx of new or inexperienced investors asking for stock tips
excessive leverage
Historically high market valuations:
(S&P 500 Shiller PE Ratio)
And, perhaps most tellingly, an influx of people who usually aren’t interested in investing suddenly asking for stock tips.
Share the post with a friend that needs to read it ;-)
Add to this mix excessive use of leverage an AI-driven euphoria, and it’s clear why many investors are worried we’re near the peak.
Taken together, there are plenty of signals suggesting that we’re closer to the end of this cycle than the beginning.
The Thursday SMCI 0.00%↑ drama may just be the beginning …
Expensive Markets Don’t Guarantee Imminent Decline
But again, while I agree that future expected returns for US stocks, particularly the S&P 500, may not be as promising over the next decade, it’s crucial to remember that expensive doesn’t automatically mean “due for a crash.”
Markets can remain at high valuations for extended periods, as past cycles have shown. Just consider the chart below showing the Buffett indicator—the ratio of total US stock market value divided by GDP. You could’ve easily convinced yourself back in the early 2010s that the market is “too pricey” and you might’ve missed out on more than a decade of sweet double-digit compounding!
Timing when a market will correct is incredibly difficult, even for experienced professionals—expensive can always get more expensive.
In short, there’s no crystal ball for market timing, and a stretched valuation alone isn’t necessarily a sell signal.
The Flaws of Historical Comparisons
Additionally, comparing today’s valuations to historical averages (the Shiller PE’s median is 16x) without further context can be misleading. The quality of S&P 500 companies has improved over time, with more durable business models and globally diversified revenue streams.
Some of the factors to consider are:
Margins -> Higher profit margins justify higher P/S valuations
Competitive advantage -> Stronger moats justify higher valuations
Visibility & predictability of revenue -> High visibility (e.g. recurring revenues) justifies higher valuations
Growth -> Fast growth justifies higher valuations
Optionality -> Options to expand to new or adjacent markets justify higher valuations; in today's global and digitized world, businesses have more options
TAM -> Large TAMs justify higher valuations
CapEx intensity -> Low CapEx (arguably) lowers risk
Furthermore, many companies reinvest significantly in R&D and marketing, which can make earnings appear lower and inflate price-to-earnings (PE) ratios.
This modern reinvestment approach complicates simple historical comparisons, so a direct comparison with PE ratios from decades ago doesn’t fully capture today’s market dynamics—and we didn’t even start talking about changes in accounting standards.


