
The Golden Age of Stock Picking? Why Today's Volatility Explosion Is an Active Investor's Dream
Why this is arguably the most target-rich environment for active stock selection in a generation

You can read the majority of this article entirely for free. If you find value in this research, consider becoming a Premium Member to unlock our full archive and join our growing circle of investors (I highly recommend checking out “The Library” to see what’s inside; you can find it right on the homepage).
A few days ago, I was listening to an episode of This Week In Intelligent Investing featuring Shaun Heelan, CIO of MAAT Investment Group, and one exchange in particular stuck with me. The show host raised something I’d been noticing for a while: single-stock volatility has been trending meaningfully higher, and since COVID, it has essentially exploded. Double-digit percentage gains or losses after a quarterly update have become the norm – even among mega-caps.
Heelan’s response was characteristically direct. He acknowledged it as “an undeniable fact” – and then said something that I think cuts right to the heart of how serious investors should be thinking about this environment. Whether elevated volatility is a risk or an opportunity, he argued, depends entirely on the structure you operate with and the mindset you bring to the table.
“I think in some ways it’s a positive, depending on what structure you have, it’s a negative. I would take it as a net positive thinking opportunistically.”
That framing resonated with me. Of course it did. I’m a stock picker at heart—operating without restrictions and always willing to bet against the crowd.
“Volatility is a symptom that people have no clue of the underlying value.” - Jeremy Grantham
I think most investors – even experienced ones – default to treating volatility as the enemy (mostly subconsciously). It’s uncomfortable to watch a position drop 15% in a session. It’s deeply uncomfortable to hold through a 40% drawdown over several months, only to then face another 20% leg down after a disappointing quarterly report.
The instinct is to sell, to reduce exposure, to wait for things to “calm down.” In fact, all of your human instincts will tell you to do the opposite of what you should most likely do. And those instincts, understandable as it is, may be costing you more alpha than almost any other single mistake you can make.
“If you are susceptible to selling everything in a panic, you ought to avoid stocks and stock mutual funds altogether.” - Peter Lynch
This post is my attempt to argue the opposite case. Elevated single-stock volatility – and we are living through an historically elevated period of it, as I’ll show – is one of the most compelling features of today’s market for the patient, fundamentals-driven investor. Full stop.
The chaos is real. The discomfort is real. But so is the opportunity embedded within it – at least, for those a) willing, b) structurally able, and c) behaviorally wired to act in these moments.
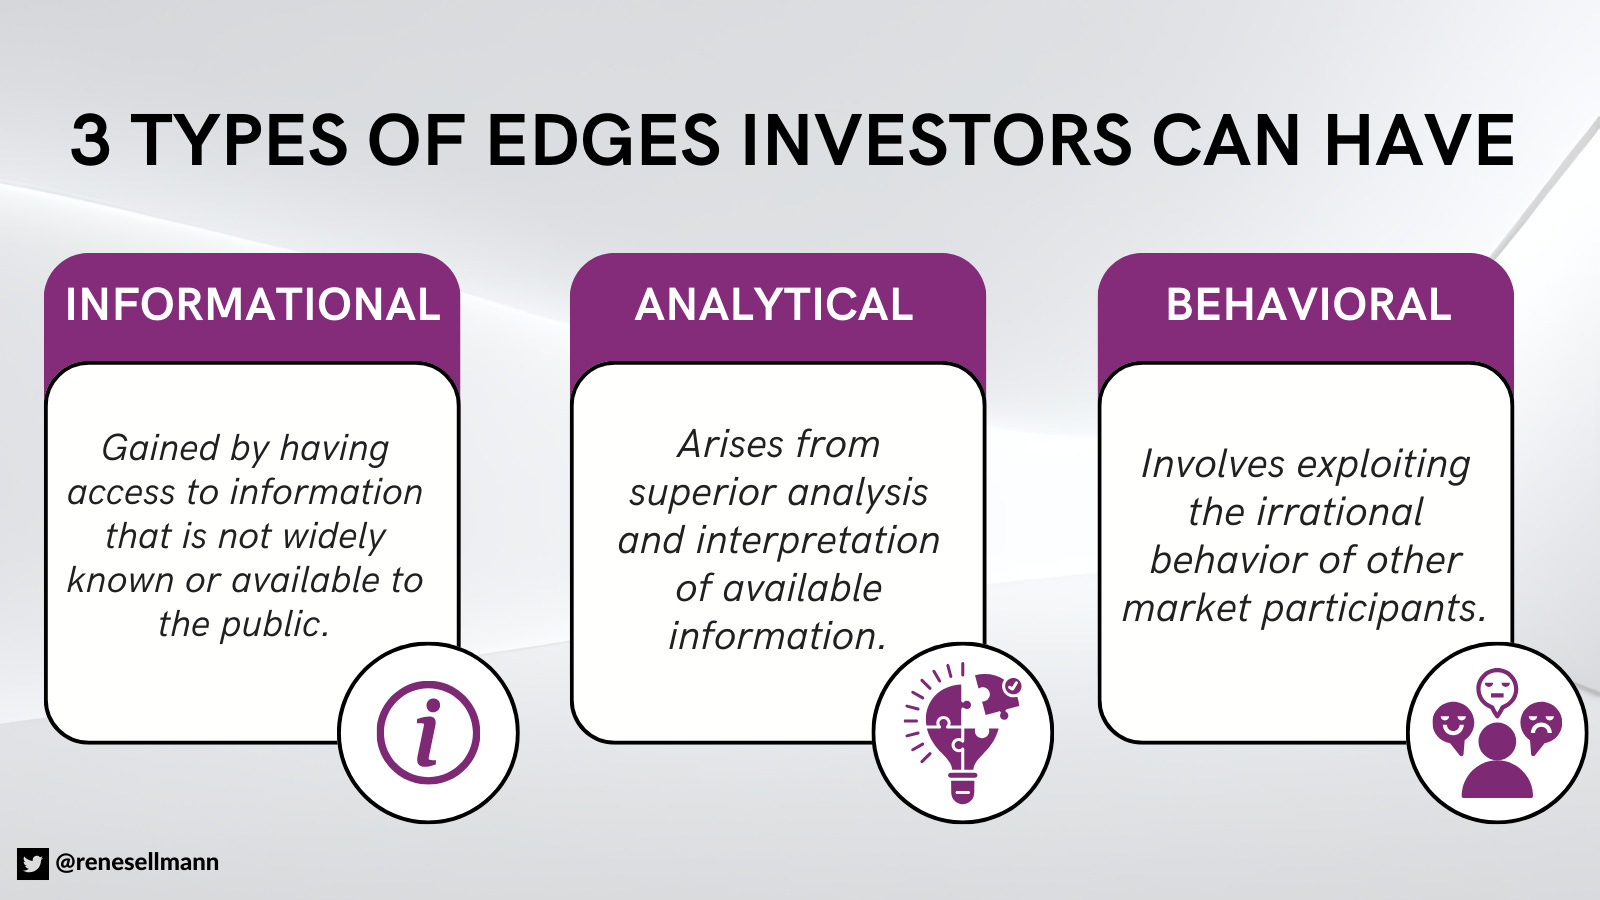
To be clear, I’m not dismissing the risks that volatility brings. Volatility cuts both ways, and I’ll get into that. But I want to make the case that in a market where the traditional edges – informational, analytical – have been largely competed away, the behavioral edge that comes from being able to sit calmly while others panic may be the most powerful source of alpha available to the individual (retail) investor today.
And paradoxically, the more volatile the environment, the wider that gap tends to become.
The Volatility You Don’t See in the Headlines
Look at the S&P 500 today – back to new all-time-highs – and you could be forgiven for thinking markets are in reasonable shape.
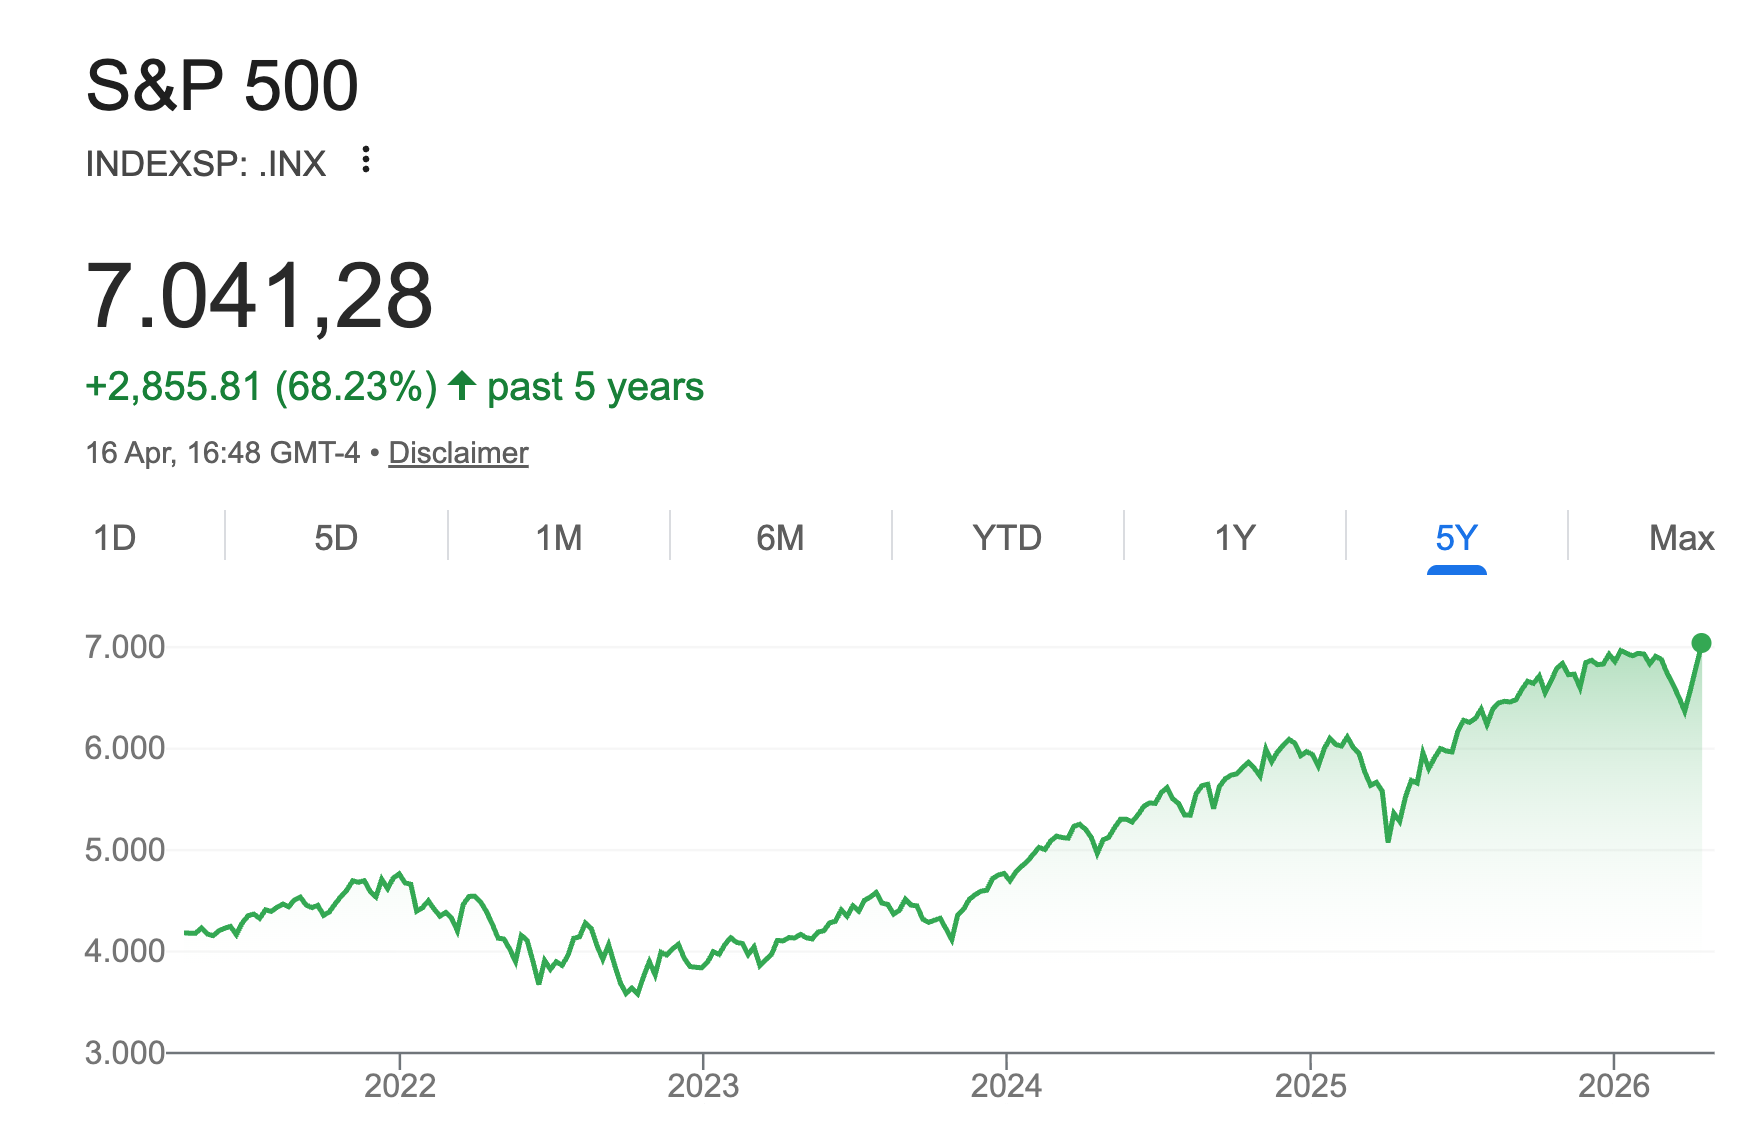
The VIX – the so-called “fear gauge” that most financial media reach for when they want to take the market’s temperature – is hovering around its long-term average of around 15 to 20 points (19.7 on average over the past 30 years).
Nothing to see here, right?

Wrong.
The surface calm is one of the most misleading things about today’s market, and I think it deserves a lot more attention than it gets.
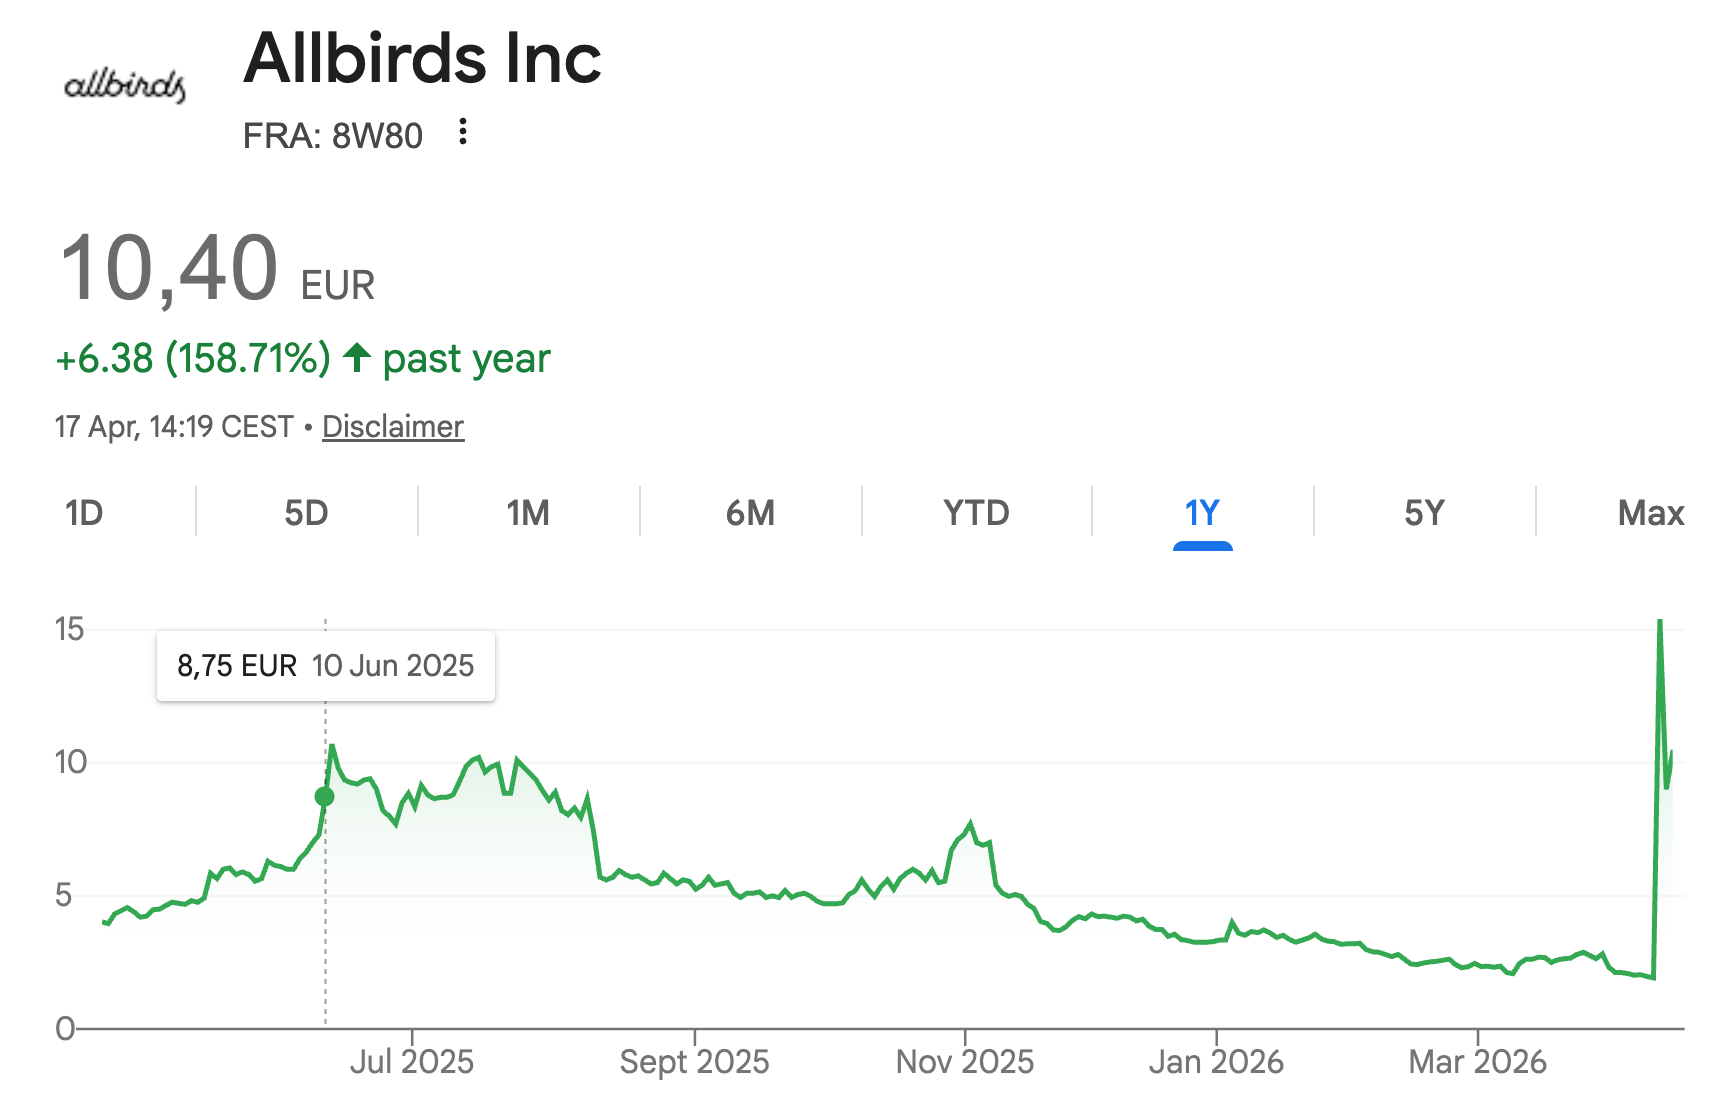
Here’s the number that should give you pause: as of last Friday, 74 out of 500 stocks in the S&P 500 are down more than 50% from their five-year highs. The index is near all-time highs, and roughly 15% of its constituents have been cut in half.
Software names have been hammered – 15 of them feature in that cohort – alongside the usual suspects: the over-hyped pandemic darlings that never had the fundamentals to justify their valuations.
But here’s what I find particularly striking. A meaningful chunk of those “halved” stocks aren’t speculative junk. They’re companies that were considered high-quality businesses for years, trading at premium earnings multiples that the market has now simply decided it’s no longer willing to pay, realizing their tail risk may be higher than previously thought, given the exponential progress we’re seeing in the realm of AI. The re-rating has been brutal – and I believe generally speaking, justified –, but, for many holders, completely unexpected.
What this tells you is that the index level is doing a lot of heavy lifting by a very small number of names. The math isn’t hard to figure out: if 74 constituents are down 50% or more from their peaks, something else has to be doing the heavy lifting to keep the index near record territory. What anmes are filling the voide? I believe it is predominantly the mega-cap technology names and semiconductors, which have recovered sharply and are essentially dragging the headline number upward, while a quiet carnage plays out beneath.
This, too, should be a stock picker’s dream.
Single-Stock Dispersion
This divergence between index-level stability and individual stock turbulence isn’t just a recent anecdote. It’s a structural feature of today’s market, and the data behind it is remarkable. According to research from J.P. Morgan Asset Management, the average rolling three-month pairwise correlation among S&P 500 stocks has fallen to just 13% – lower than it has been 98% of the time since 2022. A 13% correlation means that on average, a stock in the S&P 500 moves in the same direction as another random stock in the index only 13% of the time.
For context, dispersion measures how much the returns of individual stocks differ from each other. High dispersion means that stocks are diverging—some are experiencing massive gains while others are seeing significant losses. It indicates a “stock picker’s market” where selecting the right company matters more than just buying the whole index
In plain English: stocks are increasingly moving independently of each other rather than in lockstep with the broader market. The index looks calm precisely because the chaos is so dispersed.
The divergence between index-level volatility and single-stock volatility tells the same story in numbers. The VIX – which measures implied volatility on the index – remains near its long-term average of 15 to 18. Meanwhile, the VIXEQ, which measures implied volatility on the constituent stocks themselves, has shifted upward over the years to a baseline of 35 to 40.
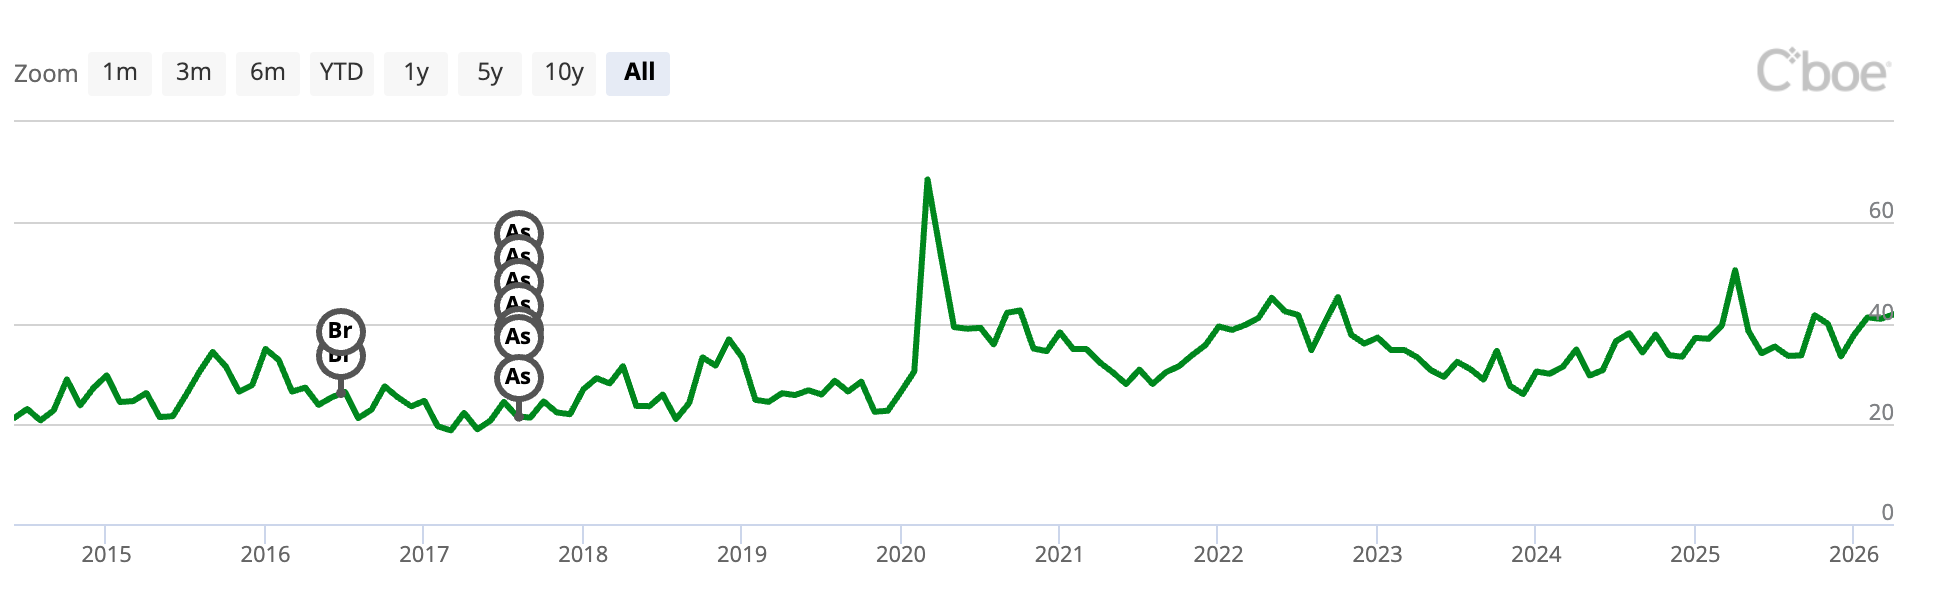
That’s not a minor gap. Pre-pandemic, the VIXEQ averaged around 25.6. The individual parts of the market are experiencing a fundamentally different volatility regime than the whole, and most investors who focus on the headline index number are simply not seeing it.
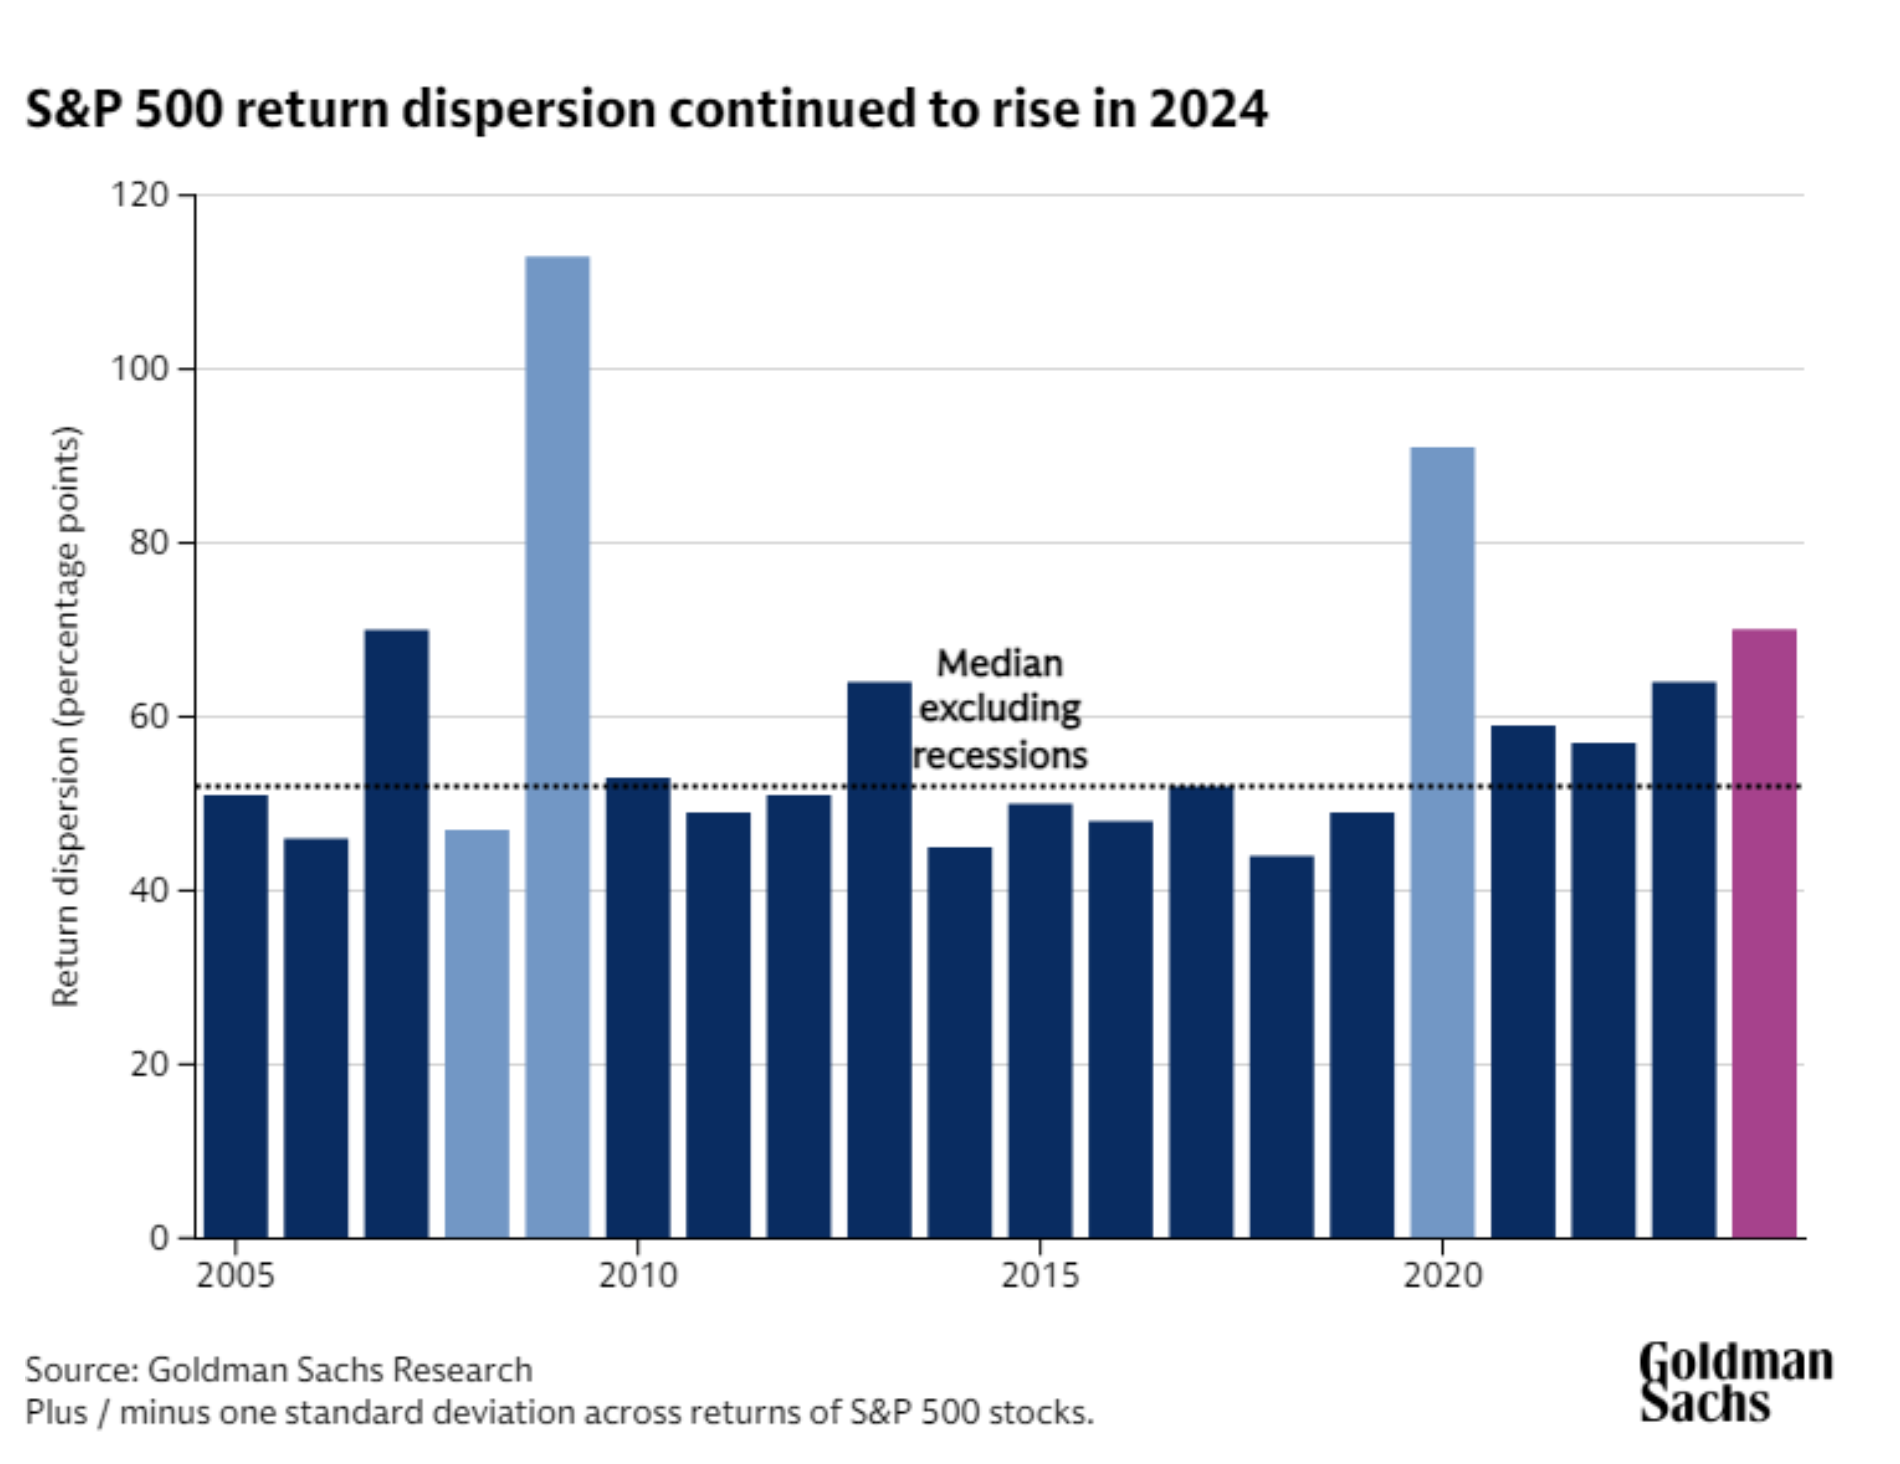
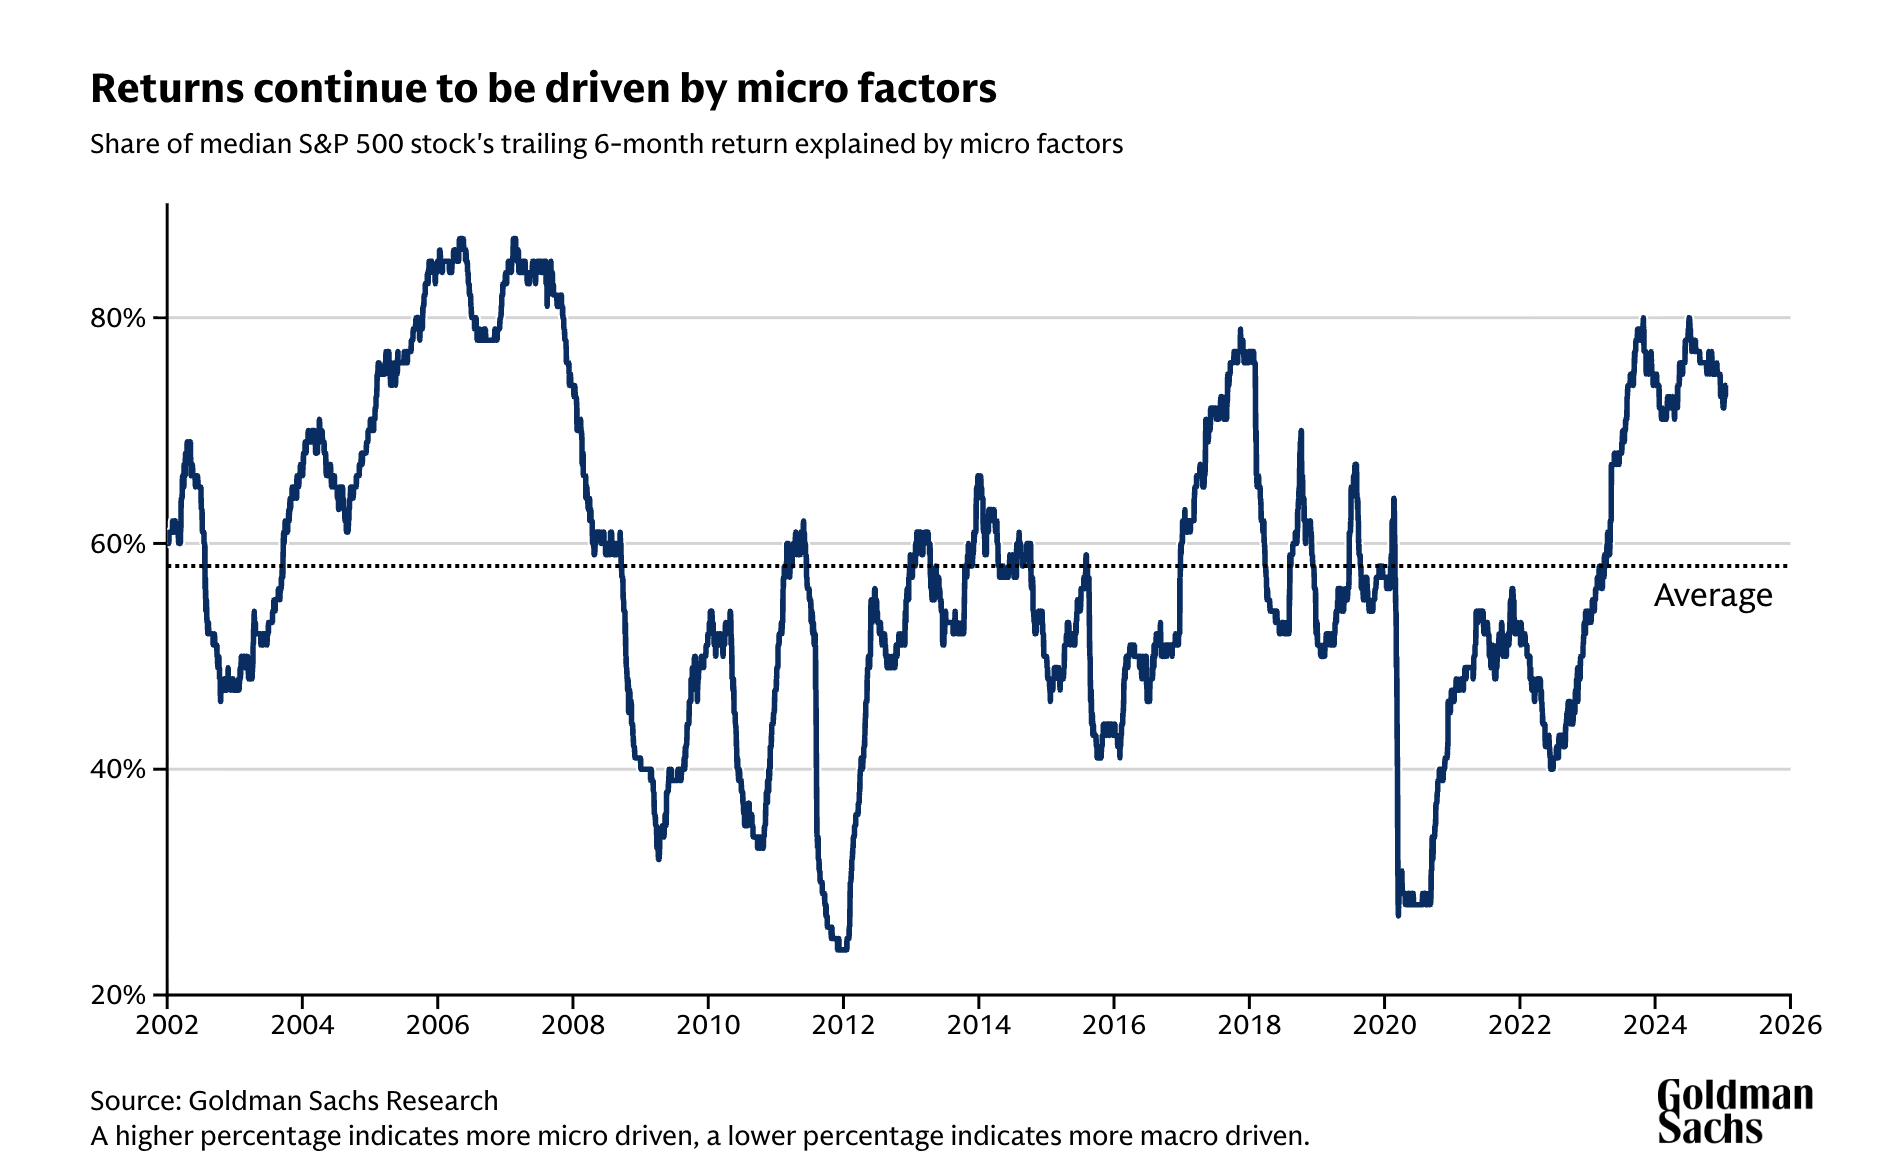
The Goldman Sachs research team has been particularly vocal about what’s driving this dispersion. In 2024 and 2025, approximately 74% of a typical S&P 500 stock’s returns were explained by company-specific, micro-level factors – up from a 20-year average of 58%. The consequence of that shift shows up starkly in return dispersion figures: in 2024, the gap between the best and worst performers in the S&P 500 reached 70 percentage points, the highest level since 2007 outside of recession years. That is an extraordinary spread.
“Six out of 11 sectors in the S&P 500 registered above-average return dispersion — the highest being Information Technology at 106 percentage points, while Real Estate was the lowest at 39 percentage points.“ – Goldman
It means the difference between owning the right stocks and the wrong ones has rarely mattered more.
There’s a deeper point here worth sitting with. The traditional mental model most investors carry – that “the market” went up or down by X% today – is becoming progressively less meaningful as a description of what’s actually happening. When 74 names are down 50% or more from their highs while the index prints near record levels, the index isn’t really telling you what’s going on. It’s telling you what a handful of mega-cap stocks are doing.
“[...] if you look historically, and this is ironically, it’s true on the debt side as well for corporate debt, if you look at prior periods where one given sector became extremely concentrated, so you mentioned the letter that we wrote, industrials were the go-go companies in the late 60s, consumer staples were in the nifty 50 in the early 70s, energy companies in 1980 or so, technology companies again around 2000, and then financials as a class around 2006, 2007. Anytime they got up to a very high percentage, 25 or higher or 30 or higher, what happened in the following five to 10 years tended to be not pleasant.” - Shaun Heelan, CIO of MAAT Investment Group
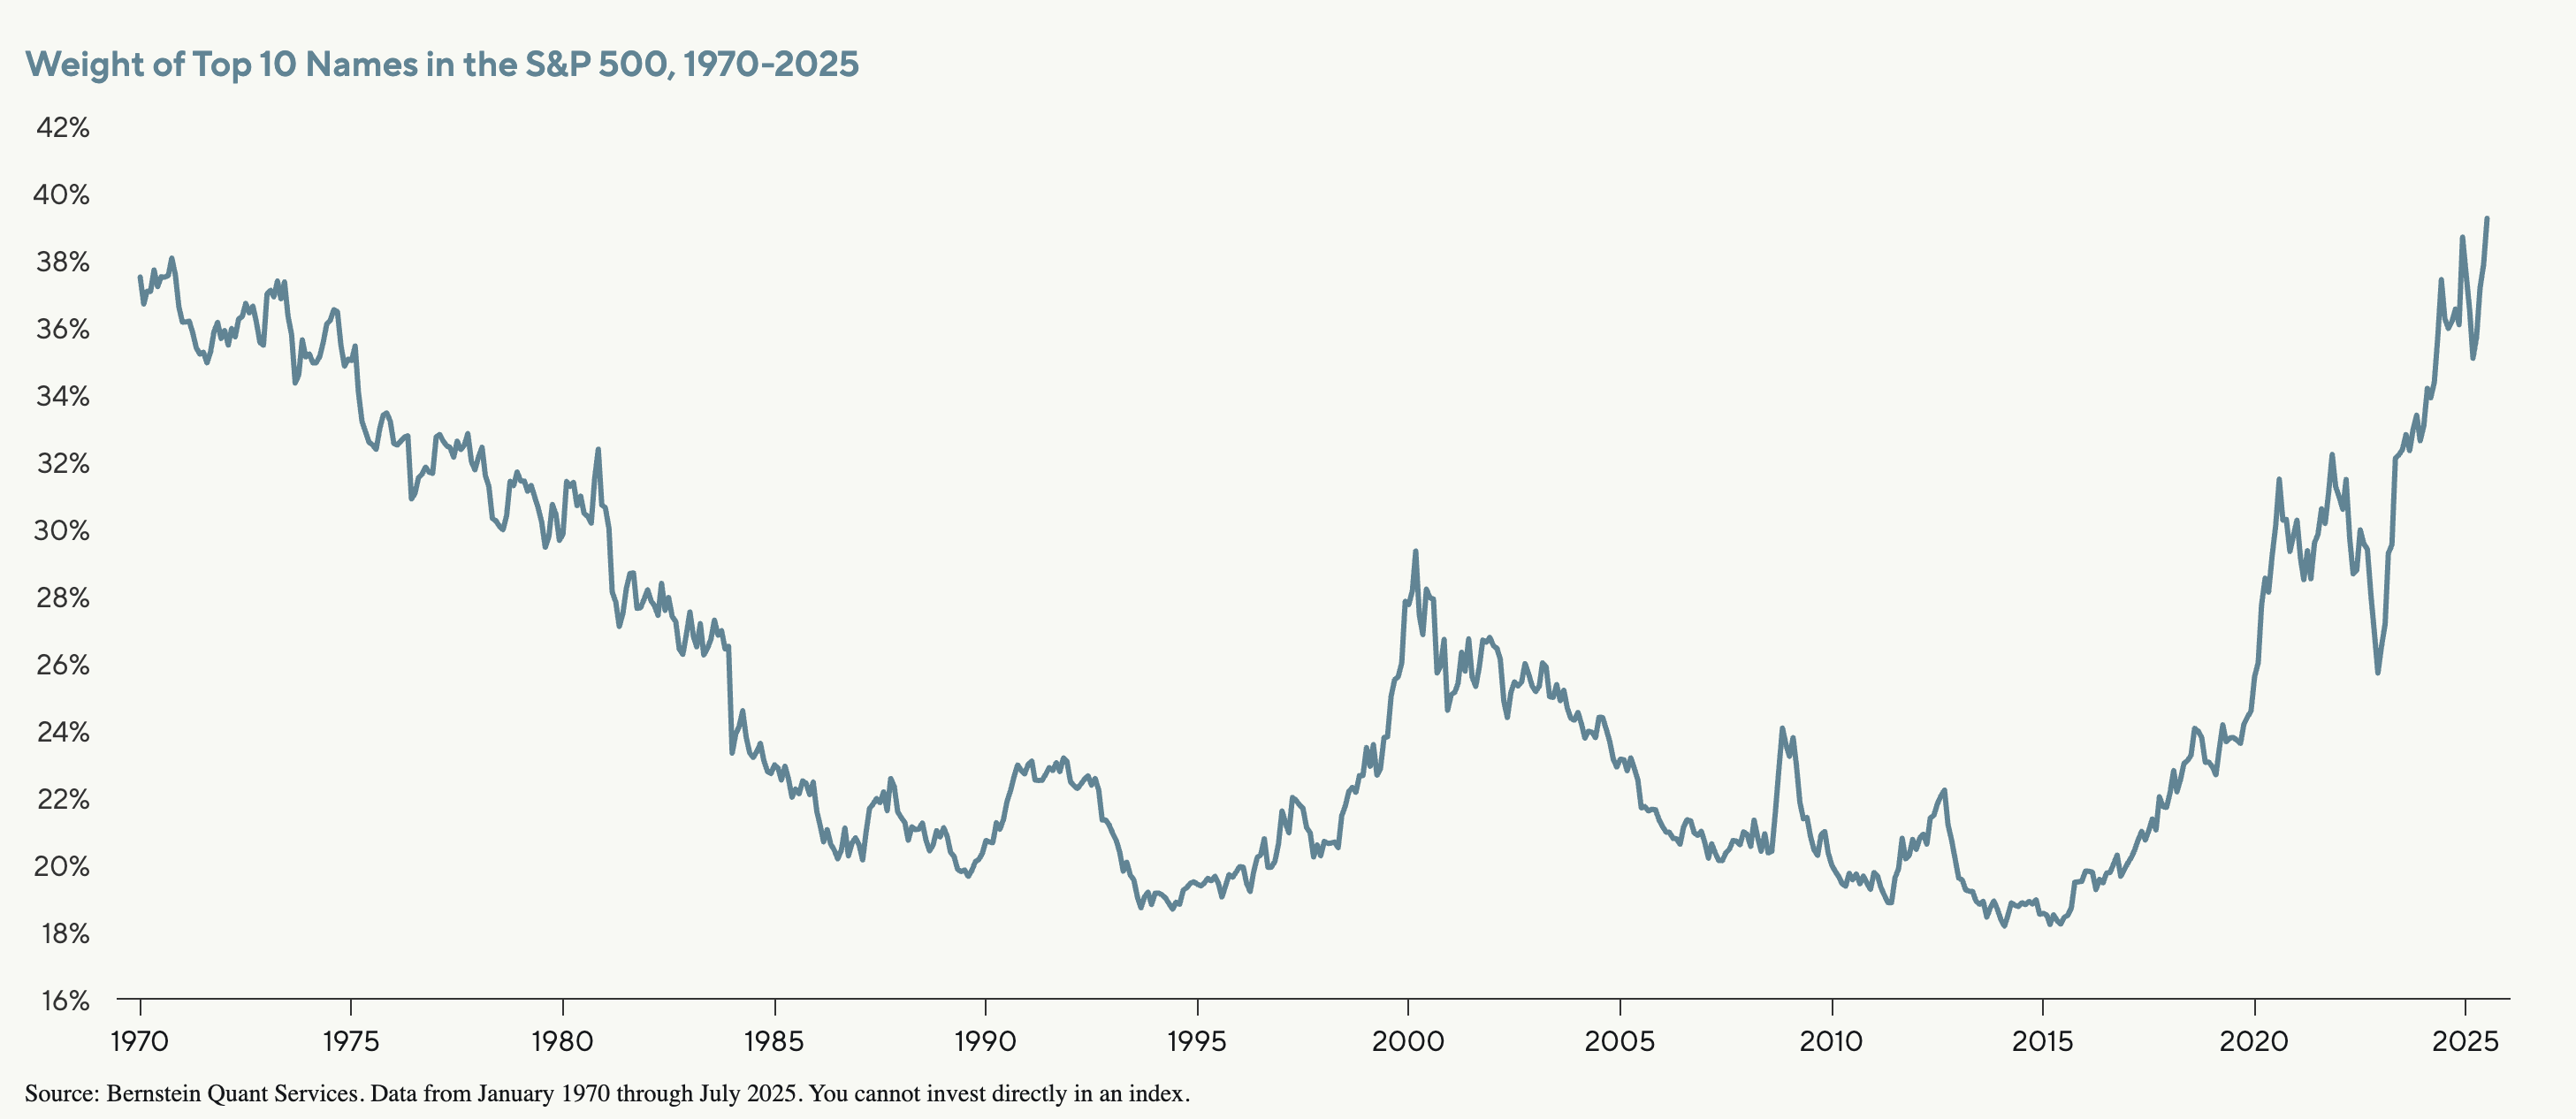
This isn’t entirely new. The dominance of a small number of names in cap-weighted indices has been a talking point for the past five years. But the degree to which the index now masks underlying turbulence has reached a level that I think warrants treating it as a qualitatively different environment.
The “Magnificent 7” cohort is a useful illustration: these stocks moved almost in unison through 2023 and 2024 – their average three-month pairwise correlation peaked at 78% in May 2025.
By early 2026, that figure had collapsed to 26%, as investors began differentiating sharply between the long-term winners and those facing disruption from AI or competitive pressures (Source: J.P. Morgan).
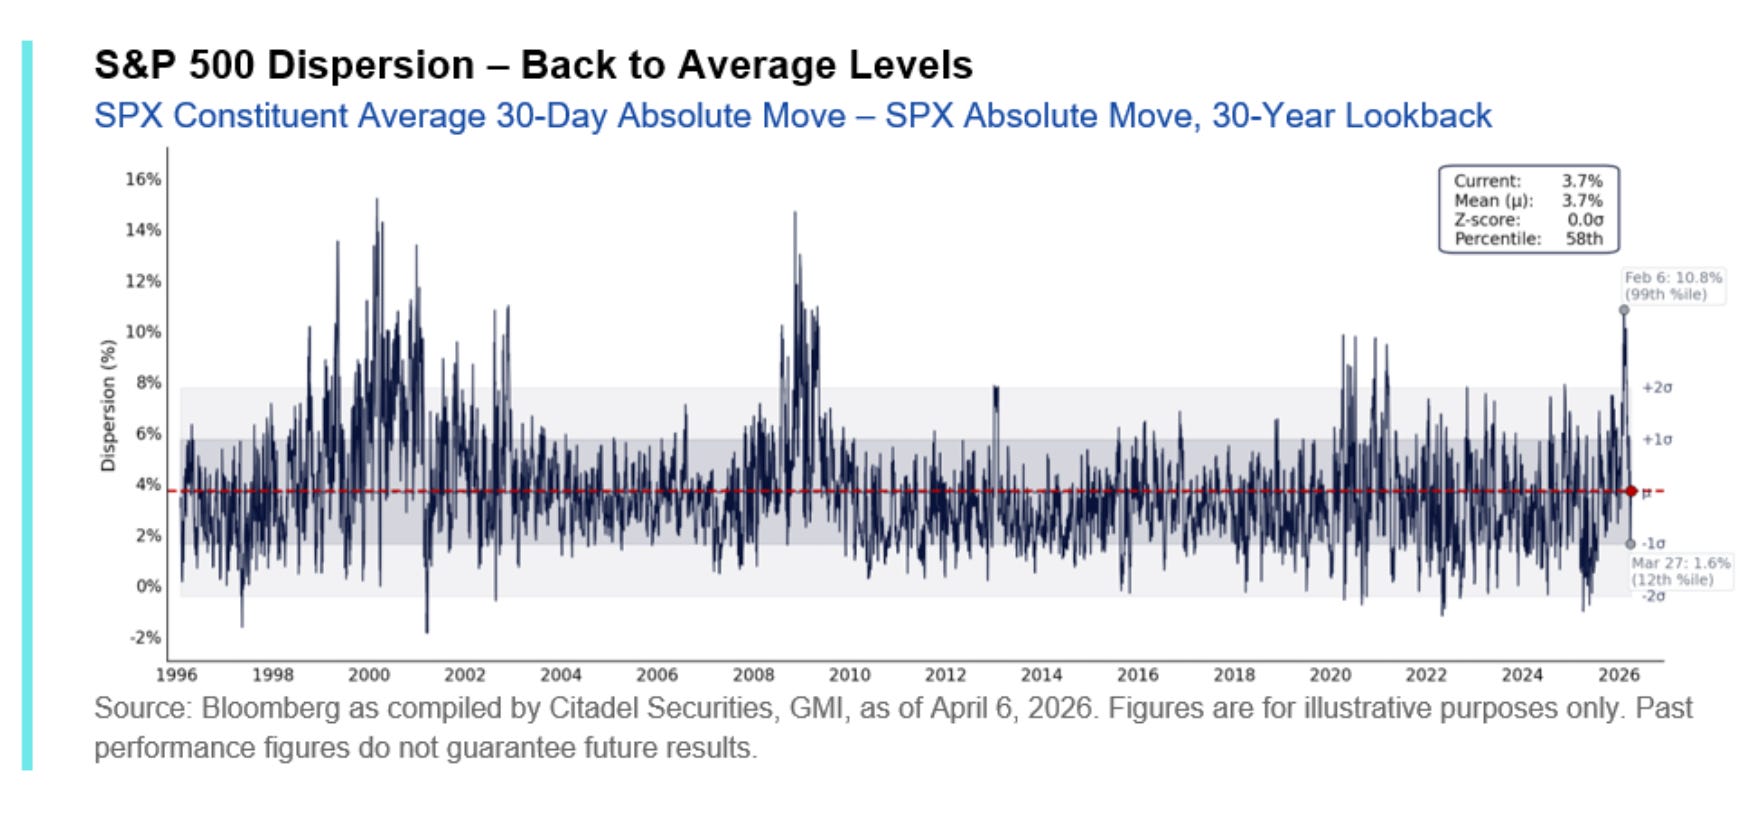
Institutional research from firms like Citadel Securities also highlights that single-stock dispersion – again, the difference in performance and volatility between individual stocks – reached the 99th percentile relative to the last 30 years in early 2026.
Why Is This Happening? The Forces Behind the Surge
Understanding that single-stock volatility has structurally shifted higher is one thing. Understanding why it has shifted – and why it’s unlikely to simply revert – is what separates a useful insight from an actionable one. There isn’t a single culprit here. It’s a confluence of structural forces that have been building for years and, in several cases, accelerated dramatically since COVID.
Back to Fundamentals?
For much of the post-2008 era, macro dominated everything. Central bank policy, interest rate expectations, and broad risk-on/risk-off sentiment were the primary drivers of stock returns. In that environment, individual company fundamentals mattered less – a rising tide lifted most boats, and a hawkish Fed statement could sink them all simultaneously. Correlations between stocks were high, and the index was a reasonably faithful representation of what was happening beneath the surface.
That world is largely gone. The macro backdrop still sets the stage, but the performance of individual businesses – their earnings trajectory, competitive positioning, balance sheet resilience, management quality – is doing far more of the work in determining where a stock actually goes. This is a profound shift, and it means that stocks are increasingly being priced on their own merits rather than as interchangeable units of “market exposure.” Naturally, that leads to much greater dispersion in outcomes.
Zero-Day Options
If the macro-to-micro shift is a slow-moving structural force, the explosion of zero-days-to-expiration options – 0DTEs – is a faster and more mechanical amplifier of single-stock volatility. By 2025, total listed options volume reached 15.2 billion contracts, with 0DTE options accounting for 24% of overall US listed volume, up from 21.5% in 2024 and nearly double the 2022 share. In the S&P 500 specifically, 0DTE options now account for nearly half of all trades.
The way these instruments amplify stock moves is worth understanding. When market makers intermediate 0DTE trades, they’re exposed to directional risk and must hedge that exposure by buying or selling shares in the underlying stock. Because 0DTE options have extreme sensitivity to price changes even a modest move in a stock forces market makers to execute large, immediate hedges. That hedging activity itself moves the stock further, which triggers more hedging, which moves the stock further still. It’s a procyclical feedback loop, and it can turn what might otherwise be a contained 3% move into a 7% or 8% swing within a single session. The “Liberation Day” episode in early 2025, during which the VIX repriced from 17.48 to 52.33 in a single session, is an extreme illustration of exactly this dynamic playing out at scale.
High-Frequency Trading
Furthermore, High-frequency trading firms now account for more than half of all US equity trading volume.
“The current market structure is thus highly competitive, highly fragmented, and very fast. It is also dominated by the trading of high frequency traders, who by some estimates make up half or more of all of trading volume. Understanding what high frequency traders do is crucial for comprehending why markets today are so very different from times past.” - Maureen O’Hara: High frequency market microstructure
HFT firms operate with high speed, minimal inventory, and zero interest in company fundamentals. Their business model depends on normal, orderly conditions. The moment a macro announcement hits, a geopolitical shock lands, or a stock starts moving in ways their models don’t expect, they don’t provide liquidity – they consume it, or exit the market entirely. The result is a market that looks extraordinarily liquid in calm periods and becomes dangerously thin precisely when investors most need to execute. This “disappearing liquidity” phenomenon creates sudden imbalances between the available depth in the order book and actual trading demand, amplifying price gaps and exaggerating moves in individual stocks.
It’s one of the more insidious features of modern market structure, because it’s invisible until it isn’t.
Retail, Reddit, and the Sentiment Machine
Then there’s the retail and social media dimension, which has permanently altered the volatility landscape for at least a subset of stocks. The meme stock phenomenon that erupted in 2021 wasn’t just an entertaining footnote – it demonstrated that large numbers of retail investors coordinating on platforms like Reddit’s r/WallStreetBets could overwhelm institutional short positions and cause stocks to move in ways that had nothing to do with fundamental value.
Statistical research has since confirmed a strong bidirectional feedback loop between social media engagement and trading volume, with online sentiment capable of driving short-term price action independently of any underlying business development.
The good news, if you want to call it that, is that by early 2026 there are signs this particular force is cooling somewhat – daily retail equities trading volume fell 11% in February.
But the infrastructure for sentiment-driven volatility is permanent. Commission-free trading, social media coordination tools, and the cultural normalization of speculative trading aren’t going away.
For smaller and mid-cap stocks, especially, where even modest concentrated buying pressure can cause violent moves, this remains a live and meaningful source of idiosyncratic volatility.
AI: Creative Destruction in Real Time
Finally, and perhaps most consequentially for the years ahead, there is artificial intelligence – operating simultaneously as a driver of enormous value creation and as a force of rapid, unpredictable disruption across entire business models. Research suggests that increasing R&D expenditure in periods of technological uncertainty increases stock volatility, because the market is essentially pricing a wide range of outcomes when the winners and losers of a technological transition aren’t yet clear. That is precisely the environment we’re in.
The AI boom has also extended well beyond software into the physical infrastructure layer – the copper, lithium, rare earth minerals, and electricity grid capacity required to actually build and run the data centers that AI depends on. By 2030, global electricity consumption for data centers alone is projected to double. The stocks of companies positioned along this “material layer” are experiencing their own elevated volatility as markets try to price structural supply constraints, permitting timelines, and geopolitical access to critical inputs – none of which are easy to forecast with precision.
In summary, the net result of all these forces operating together is a market where the index-level calm is real but thin, and where, beneath it, individual stocks are navigating a genuinely turbulent set of currents. That turbulence has structural roots. It won’t simply fade because the Fed cuts rates or trade tensions ease.
And that – as I’ll argue in the next chapter – is actually very good news if you’re the right kind of investor.
The Only Edge Left – And Why Volatility Is Your Friend
Let’s start with a premise that has become increasingly hard to argue against: the traditional sources of investment edge are eroding.
Informational advantage – knowing something the market doesn’t – has been largely commoditized by the speed and breadth of modern information distribution. The moment an earnings report hits, thousands of algorithms have already parsed it.
Analytical advantage still exists, but it too is under pressure. The proliferation of sophisticated quantitative models, AI-assisted financial analysis, and the general raising of the analytical bar across the investment industry means that finding a genuinely differentiated view on a business’s intrinsic value is harder than it has ever been.
This isn’t a controversial observation – it’s something the most thoughtful investors and allocators have been saying with increasing frequency throughout 2025 and into 2026.
What remains – and what I’d argue is increasingly the only durable source of alpha for the individual investor – is behavioral edge.
The ability to think and act differently from the crowd at precisely the moments when doing so is most psychologically difficult. Sitting on your hands while a position drops 20%. Buying more when a stock you own falls 15% on a news event that doesn’t change the long-term thesis. Holding through the kind of volatility that causes most institutional managers to reduce exposure simply because their risk models tell them to.
None of this is intellectually complicated. All of it is extraordinarily hard in practice.
This is where the podcast conversation I referenced at the start of this post becomes directly relevant to how you should be thinking about your own positioning. Shaun Heelan made a point in that podcast that I keep coming back to. Many of the most sophisticated market participants – multi-manager platforms, quant funds, and institutional allocators operating under strict risk mandates – are essentially forced to reduce or exit positions as volatility rises, regardless of whether the underlying business has changed at all. Their risk limits are defined by value-at-risk models with 12 or 24-month lookback periods. As volatility picks up, those models demand position reductions. It’s mechanical, not analytical.
“[…] if I go back to when I was at firms like Bluecrest, DW and Brevin Howard, much like you would see with the multi-manager or podshops today, they have very, very strict risk limits.“ - Shaun Heelan
Heelan described it with a vivid analogy: running a Formula One car with a spike on the steering wheel. Sure, you’ll get around the track, but you’ll be very careful – and there are certain moves you simply cannot make. When volatility spikes, these players don’t ask whether the selloff is rational. They ask whether their VAR budget – VAR stands for Value at Risk and refers to a strategic framework where an organization allocates “risk units” instead of just “dollar amounts” – allows them to stay in the trade. Often it doesn’t. They get knocked out.
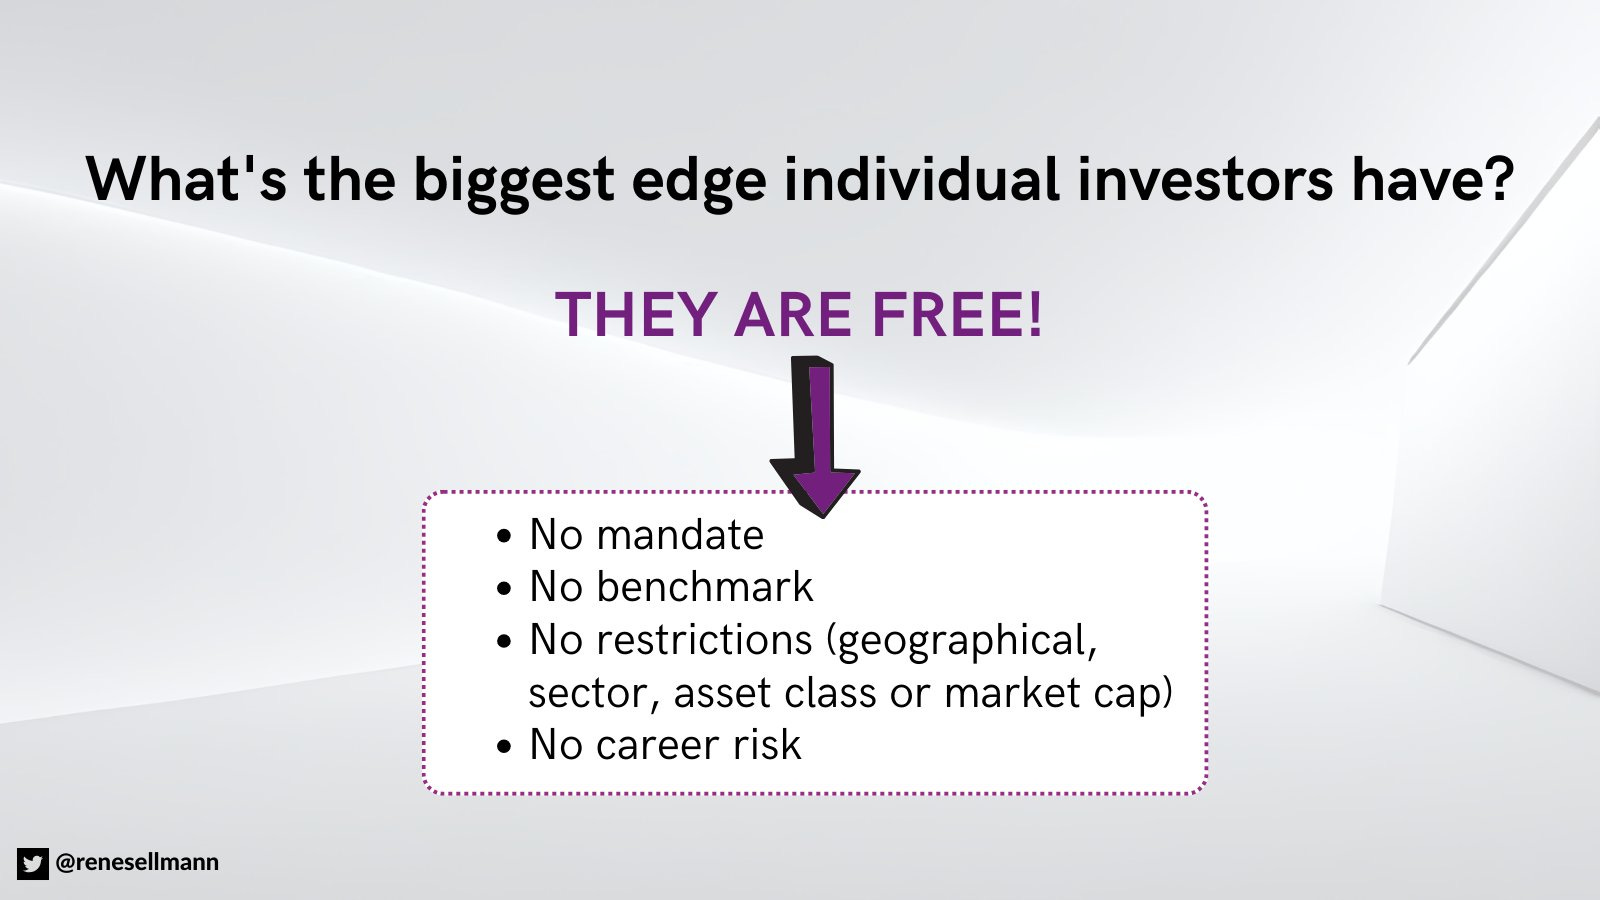
For you, as an individual investor without such constraints, without a quarterly redemption cycle, and without an institutional risk committee looking over your shoulder, this is a profound structural advantage – but only if you’ve done the work to have genuine conviction in what you own. The opportunity isn’t just that stocks may get cheap (or overpriced) when volatility spikes. It’s that some palyers in your competitive set are being systematically forced to sell at exactly the moment you’re free to buy. The more volatile the environment, the more competitors get sidelined, and the wider the potential gap between price and value.
There’s a behavioral dynamic at work in high-volatility environments that I think is underappreciated even by experienced investors. Price drives narrative. I’m sure you’ve seen that phrase before. But have you fully comprehended it? I doubt it!

When a stock is down 30% over six months and then falls another 20% on a weak earnings print, the narrative around that business almost universally turns negative. Analysts cut targets and lower “exit multiples.” Financial media produces explainers about structural headwinds. Other investors – seeing the price action and reading the commentary it generates – become incrementally more negative.
The story the market tells about a business is almost always heavily influenced by what its stock has been doing, often with very little reference to whether the underlying business has actually deteriorated in proportion to the move.
This creates a very specific kind of opportunity for the investor who can separate signal from noise. If a stock drops 15% because a recent development (e.g, the CEO stepping down) introduced short-term uncertainty around a business that has a long and durable runway ahead of it, the question worth asking is “has anything actually changed about the next five to ten years?” Most of the time, in a high-volatility environment, the answer is no. The fall reflects positioning, fear, and mechanical selling more than any genuine reassessment of intrinsic value.
Recognizing that – and acting on it (which is the hard part!) – is exactly what behavioral edge looks like in practice.
It takes a particular kind of fortitude, and I won’t pretend otherwise. Buying into sharp drawdowns goes against every instinct that markets cultivate in participants over time. The investor who steps in when a quality business is down 50% from its five-year high – when the narrative is terrible, when consensus is negative, when momentum is firmly against them – is doing something that feels genuinely dangerous in the moment.
But that discomfort is precisely the source of the return. If it were comfortable, the opportunity wouldn’t exist.
Why Capital Allocators Matter More Than Ever
There’s one more dimension to this that I think deserves attention, and it connects to something I’ve written about before in the context of market structure.
Playing a Different Game: When Fundamentals Aren’t Enough Anymore! (Part 1)

This will be a 3-part series. If you don’t want to miss the follow-up pieces, make sure to subscribe to the blog.
In a high-volatility, high-dispersion environment, the quality of the management team running a business – and specifically their capital allocation discipline – matters significantly more than it did in the low-volatility, liquidity-driven era of the 2010s.
Here’s why. If you buy a stock that subsequently falls 30% because of broad market turbulence or sentiment-driven selling, you need a mechanism by which the gap between price and intrinsic value eventually closes. In an ideal world, that mechanism is a management team that recognizes the disconnect and acts on it – aggressively repurchasing shares at a fraction of intrinsic value, for instance, thereby increasing your ownership stake in the business at an attractive price, or returning capital through dividends that reward your patience while you wait for the market to come around.
A great capital allocator effectively becomes your partner in exploiting the market’s irrationality. They’re doing the arbitrage for you, systematically and at scale, every time Mr. Market has one of his episodes.
This is why, in my view, the elevated volatility environment doesn’t just reward patience in a general sense – it specifically rewards owning businesses run by managers who think like owners, who have a clear-eyed view of intrinsic value, and who have both the mandate and the discipline to act when the market hands them an opportunity. Without that, a cheap stock can stay cheap for a very long time.
Embracing the Turbulence
There's an irony worth acknowledging here. Volatility is, at its core, a neutral phenomenon – it can, however, also be a double-edged sword that simultaneously creates the conditions for outsized gains and the risk of catastrophic losses for existing holders. Depending on your behavioral make-up.
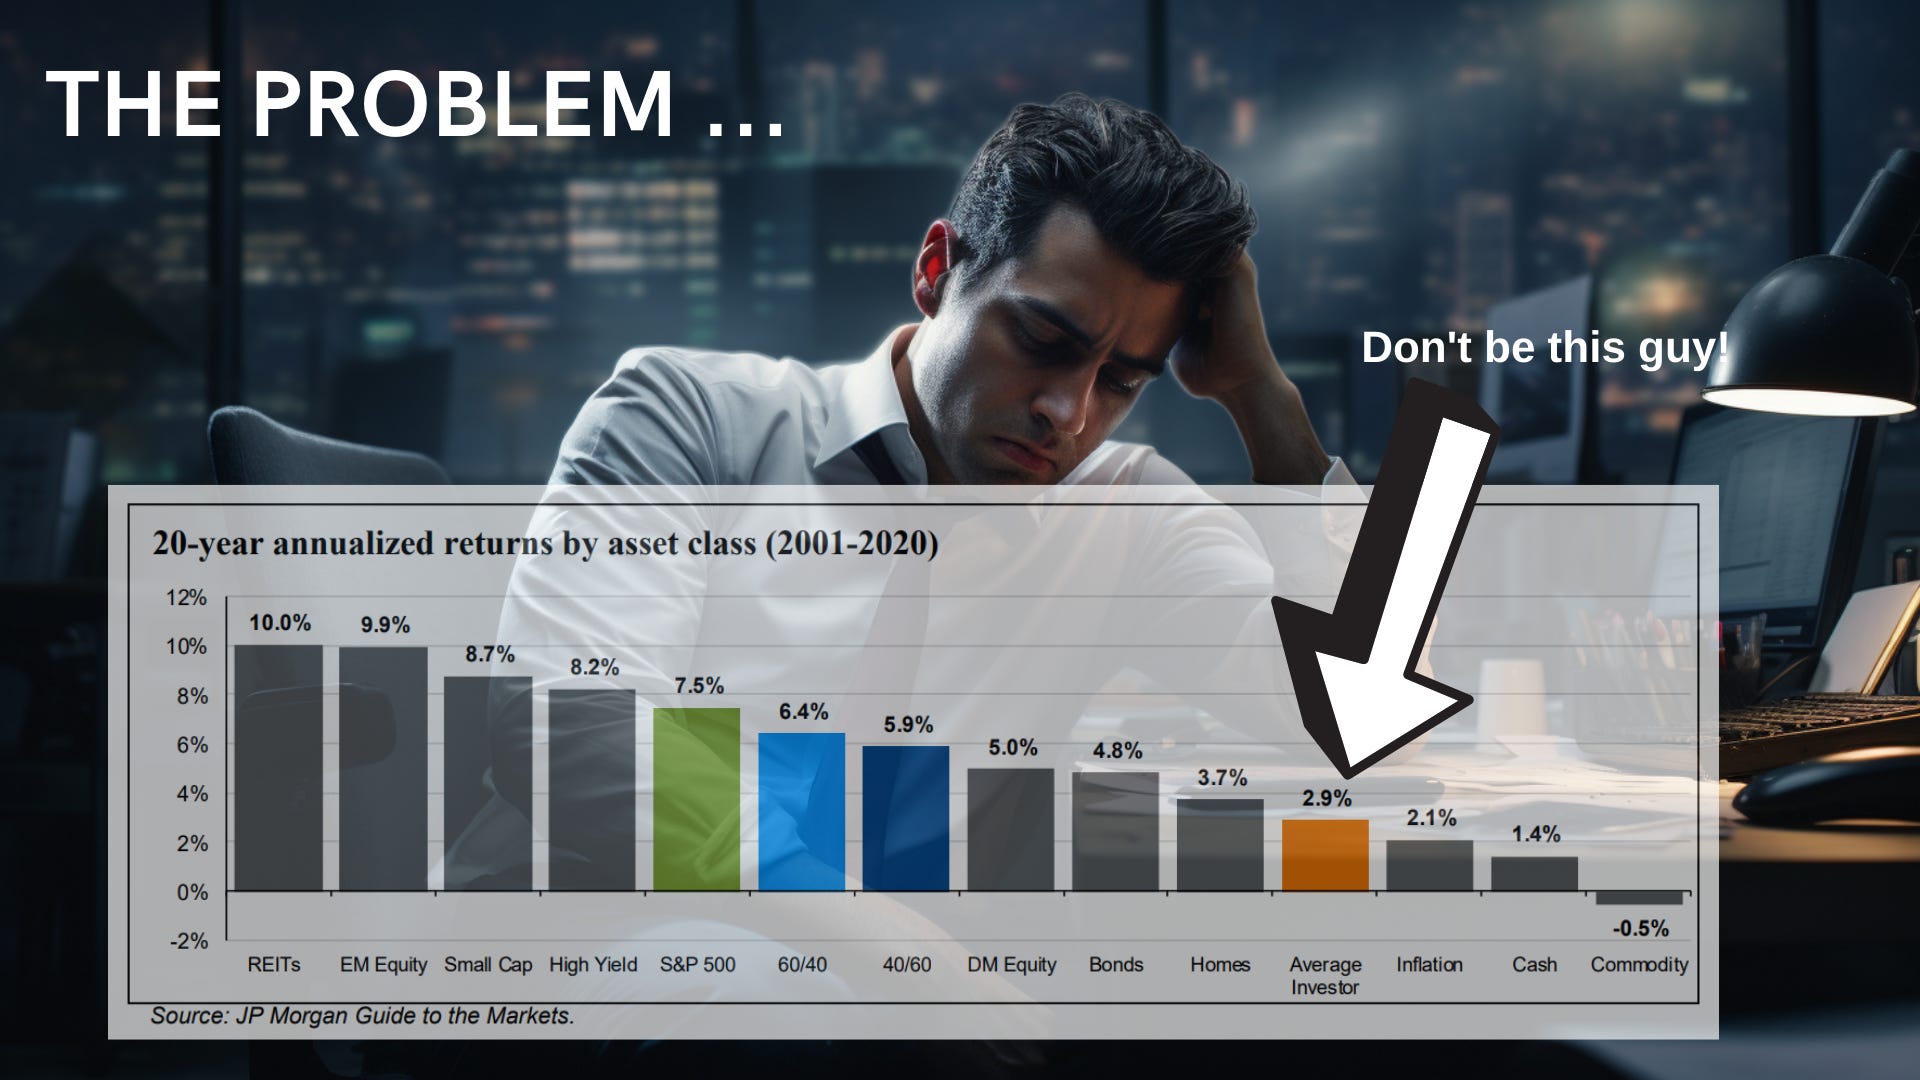
When you look at where most generational wealth has actually been built, it's overwhelmingly in low-volatility assets. Real estate. Private businesses. Assets that don't have a ticker, don't print a daily price, and don't tempt their owners into doing something stupid at the wrong moment. Why is that? Because most “investors” have a terrible temperament. The very absence of a quoted market price is, for most people, a feature rather than a bug – it removes the psychological trigger that causes so much value destruction in public markets.
So while I'd argue that the volatility explosion in single stocks represents a genuine opportunity for the disciplined, long-term oriented investor, it's worth being honest: most people are better served by assets that don't test their behavioral constitution every trading session.
Concluding Thoughts
So where does this leave us? The data is unambiguous: single-stock volatility has structurally shifted higher, the index masks more turbulence than it reveals, and the forces driving this regime – a more micro-driven return environment, 0DTE options mechanics, evaporating HFT liquidity, AI-driven creative destruction – are not transient. They are features of the market we now inhabit.
For the passive investor or the institutionally constrained allocator, much of this is simply noise to be endured.
But despite the US market, on a headline level, seeming incredibly richly valued, for the patient, fundamentally-oriented, global, industry- and size-agnostic stock picker with a genuine long-term time horizon and the psychological constitution to act against the crowd at uncomfortable moments, I’d argue this is arguably the most target-rich environment for active stock selection in a generation. The dispersion between winners and losers is at multi-decade highs. The gap between what the index tells you and what’s actually happening beneath the surface has never been wider.
And your competition – the VAR-constrained, redemption-pressured institutional complex; the Reddit 'investor' operating without a fundamental compass; the Reddit "investor" who lacks a deeper understanding of fundamentals and valuation, and the Buffett-reading average investor who lacks the behavioral wiring to actually lean in when fear takes hold – is structurally and temperamentally prevented from taking full advantage of the mispricings that volatility creates.
As Shaun Heelan shared on the This Week In Intelligent Investing podcast, the Chinese symbol for crisis contains within it the character for opportunity.
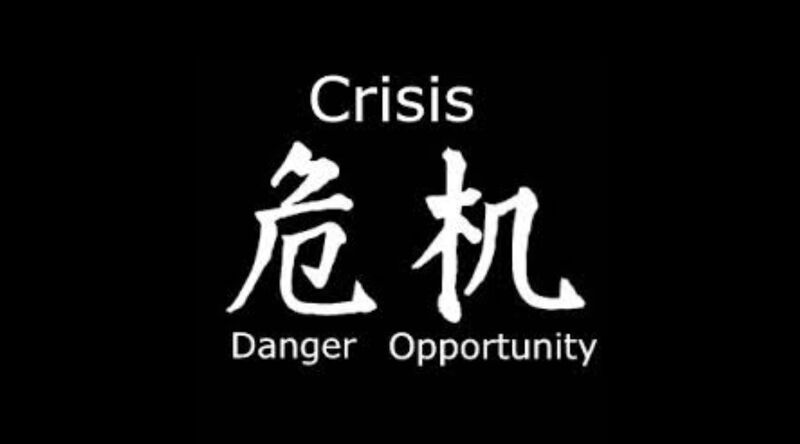
It’s an observation that gets quoted so often it risks becoming a cliché. But in the context of what’s happening in equity markets right now – beneath the surface, away from the index headline – I think it’s the most accurate single-sentence description of the environment available to us.
Nice insights.