
The 10 Hidden Dangers of the PE Ratio: The Definitive Guide to Wall Street’s Most Overused Metric
How to Avoid the Most Common Valuation Traps

The Price-to-Earnings (P/E) ratio is one of, if not THE most widely recognized and used metric in not only stock valuation, but also more generally stock market investing. It seems to offer a simple way to assess whether a company is overvalued or undervalued, and many investors rely on it as a shortcut to gauge a stock’s potential.
But here’s the thing – while the P/E ratio is popular, it’s far from perfect. In fact, it’s often misleading.
As investors, we are constantly looking for efficient ways to evaluate companies. The P/E ratio seems to provide that efficiency – it’s easy to calculate, easy to pull up (and chart) on investment research terminals, easy to understand, and is frequently quoted in news articles and stock commentary.
But there’s a significant catch. While the P/E ratio might give us a quick snapshot, it hides crucial details about a company’s growth prospects, financial health, and risks.
In this post, we’ll take a deeper look at the 10 most common pitfalls of the P/E ratio and explore why relying on it can be dangerous.
We’ll examine some of the key factors that the P/E ratio fails to account for. We’ll also dig into real-world examples to illustrate how the P/E ratio can mislead investors, especially in complex, high-growth companies.
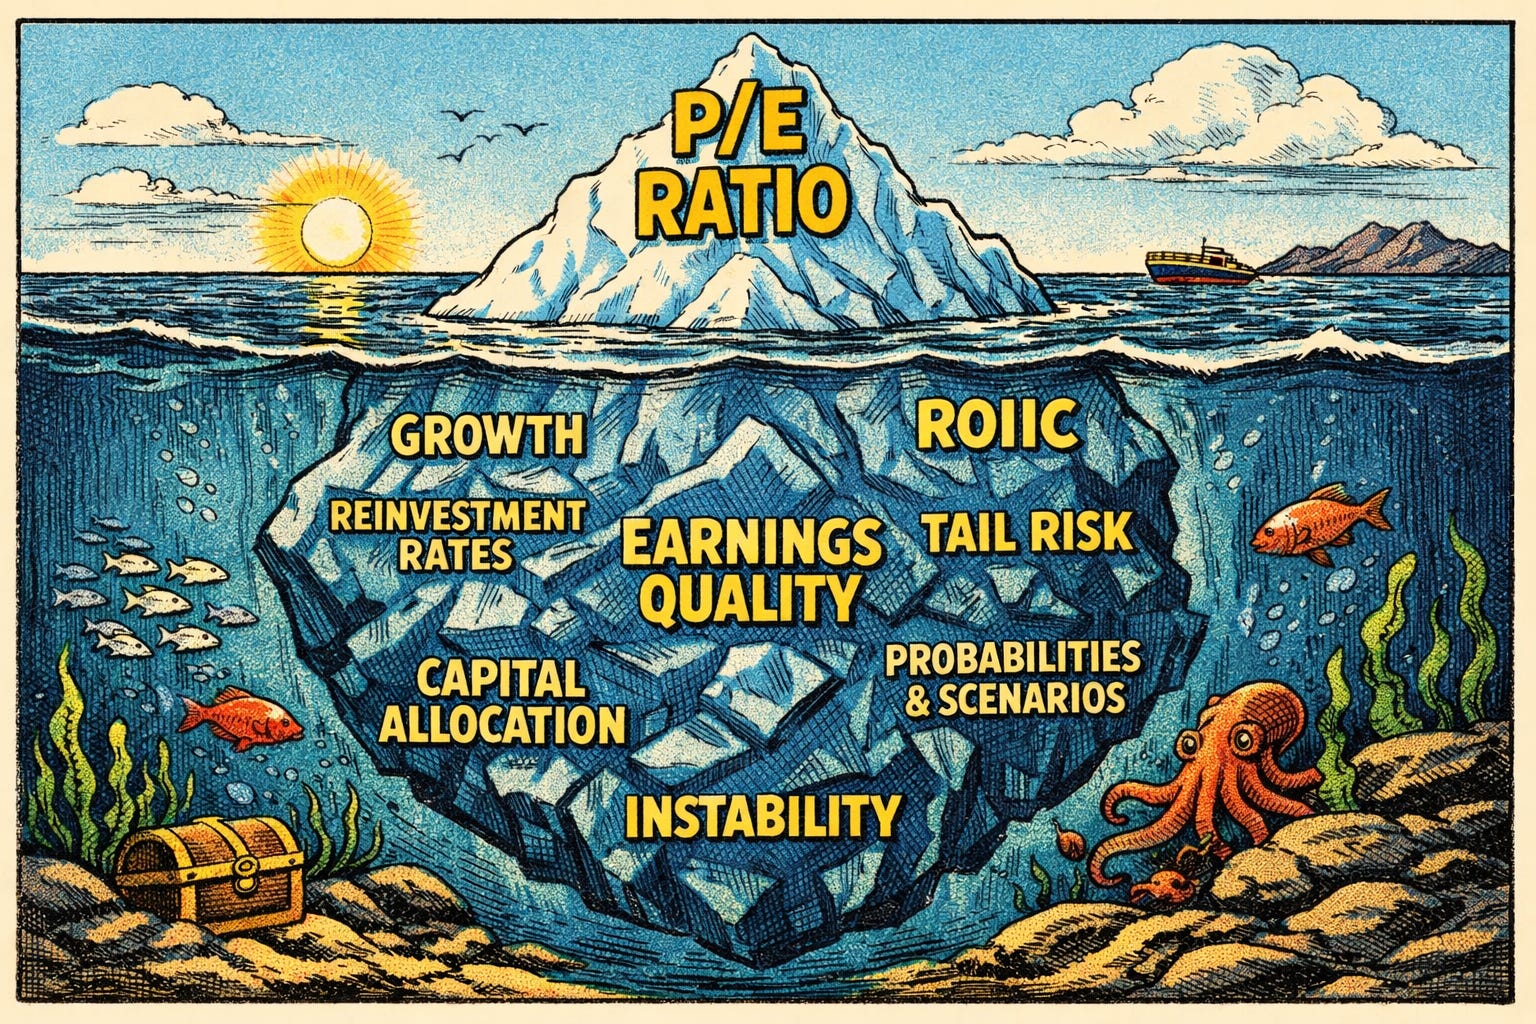
By the end of this post, you’ll hopefully have a clearer understanding of why the P/E ratio is just the tip of the iceberg when it comes to company valuation. We’ll discuss alternative ways to think about a company’s true worth—ways that provide a more comprehensive and accurate picture of its potential.
Part 1: 10 Common Pitfalls of the P/E Ratio
The P/E ratio might seem like a straightforward tool, but it hides a wealth of critical information about a company’s true financial position, and can thus be incredibly misleading. While it often gives a rough indication of how expensive or cheap a stock is relative to its earnings, it fails to account for several important factors that can dramatically affect a company’s future prospects and value.
Let’s break down the ten key pitfalls of the P/E ratio tat I’ve identified for this post, starting with what it overlooks.
1+2) Reinvestment Rate, Reinvestment Runway & ROIIC
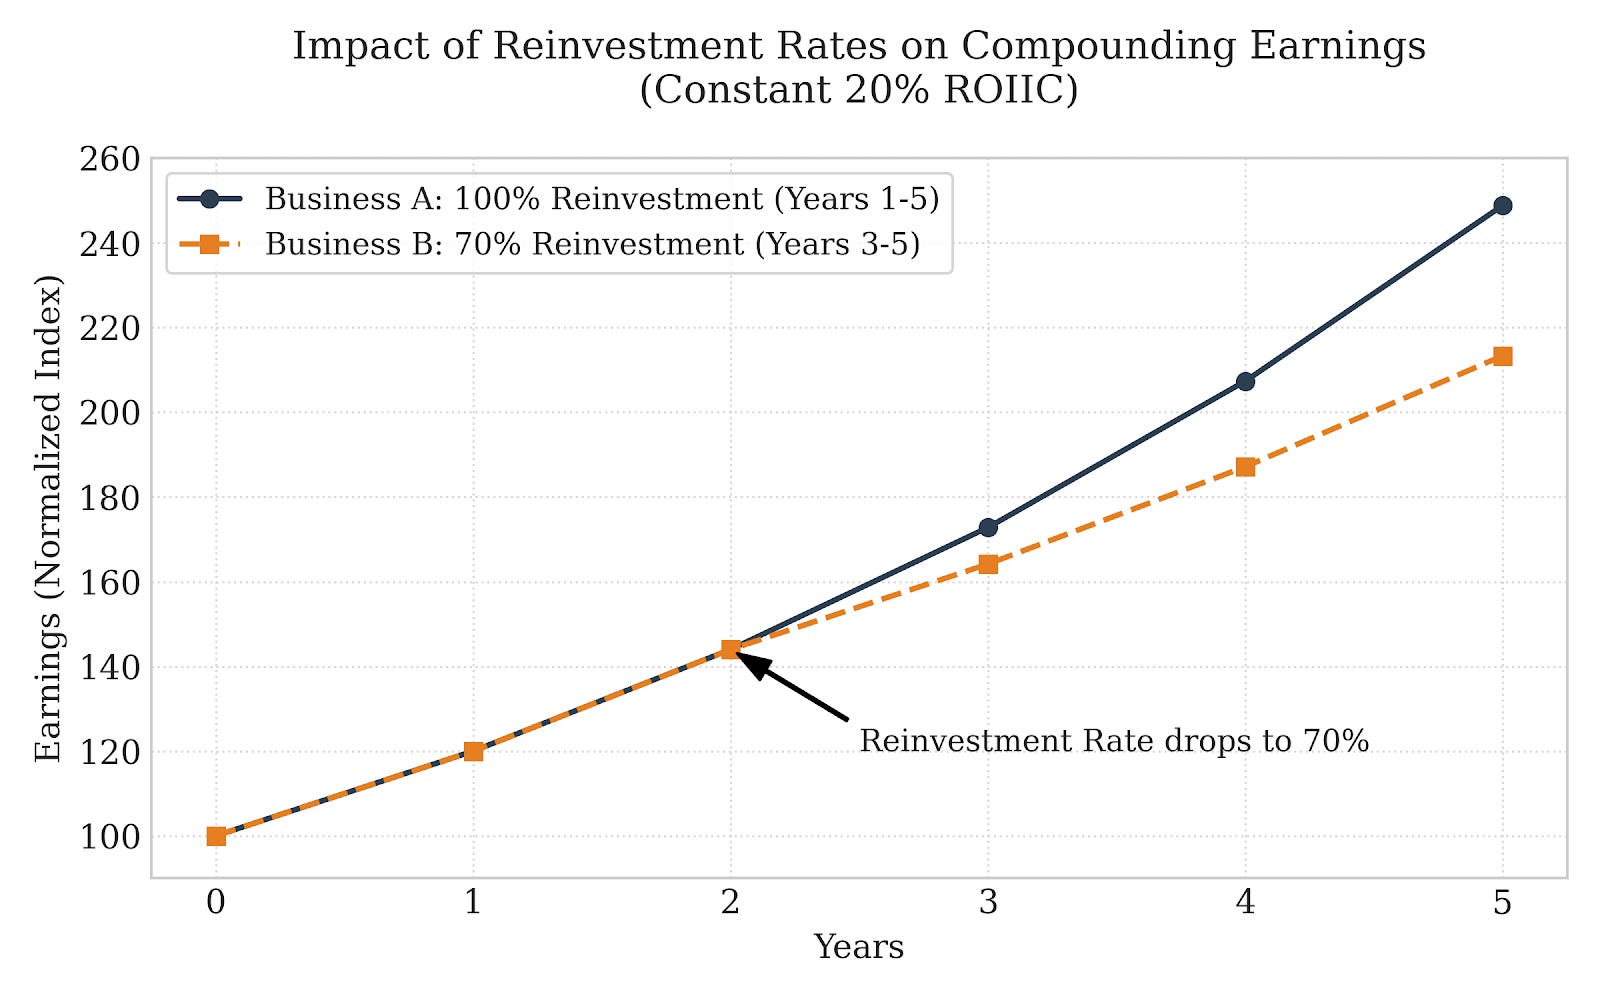
One of the biggest limitations of the P/E ratio is its inability to capture how much of a company’s earnings can be reinvested into the business at attractive rates, crucially, for how long this can continue, and what returns (ROIIC) it generates on each additional dollar of invested capital. In fact, we’ve packed to metrics into one here.
Because two businesses earning 20% on incremental invested capital in the next five years can follow completely different trajectories if one of the two can only reinvest all of its capital at this rate for the next two years before it has to lower its reinvestment rate to 70% to maintain the 20% ROIIC.
ROIIC x Reinvestment Rate is arguably one of the most important formulas in investing. Yet, it is rarely covered by the financial media or “educators.” Companies with high ROIIC on reinvestments – meaning they can generate strong returns on new investments – have a greater potential for superior long-term growth.
However, the P/E ratio doesn’t tell you anything about how much capital a company is reinvesting in its operations, acquisitions, or other opportunities, and at what ROIIC. A company that can reinvest earnings at a high return can justify a MUCH, much higher multiple because its future growth is higher, more sustainable, and predictable.
On the flip side, if a company’s reinvestment opportunities are dwindling, its growth prospects become less certain, even if its earnings are currently strong.
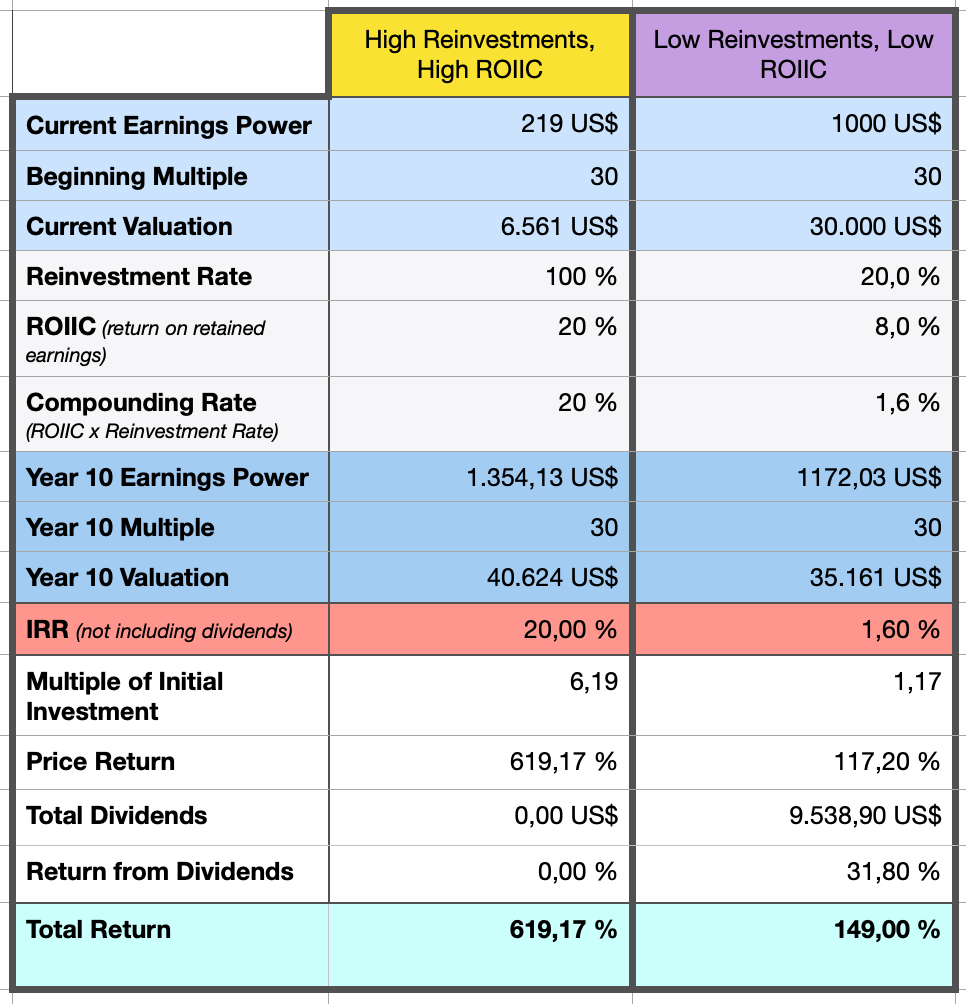
And even two companies growing at the same growth rate do not “deserve” to trade at the same “fair” multiple. Because if one company arrives at 20% growth by reinvesting only 50% of its earnings power (40% ROIIC) and another one gets there by reinvesting all of its profits (100%) at a ROIIC of 20%, the first company generates more distributable cash!
Before we dive back in, a quick note…
Share this with your friends that are new to investing OR those that have been investing for a couple of years, THINK they are already rather knowledgable, but in reality, they aren’t.
So, without factoring in the reinvestment rate AND the ROIIC in future investment, the P/E ratio provides an incomplete picture of a company’s true value. A company might look cheap based on its P/E ratio, but if its ROIIC is low or declining, it’s a sign that the company is not efficiently using its capital to grow. Conversely, a company with a high P/E ratio but also high ROIIC could be worth the premium, as it shows the business is reinvesting wisely and generating strong returns.
3) Capital Allocation
The P/E ratio also overlooks a company’s approach to capital allocation, which is another vital element for long-term success. Capital allocation refers to how a company decides to use its resources – whether through reinvestment in the business, acquisitions, share buybacks, debt reductions, or paying dividends.
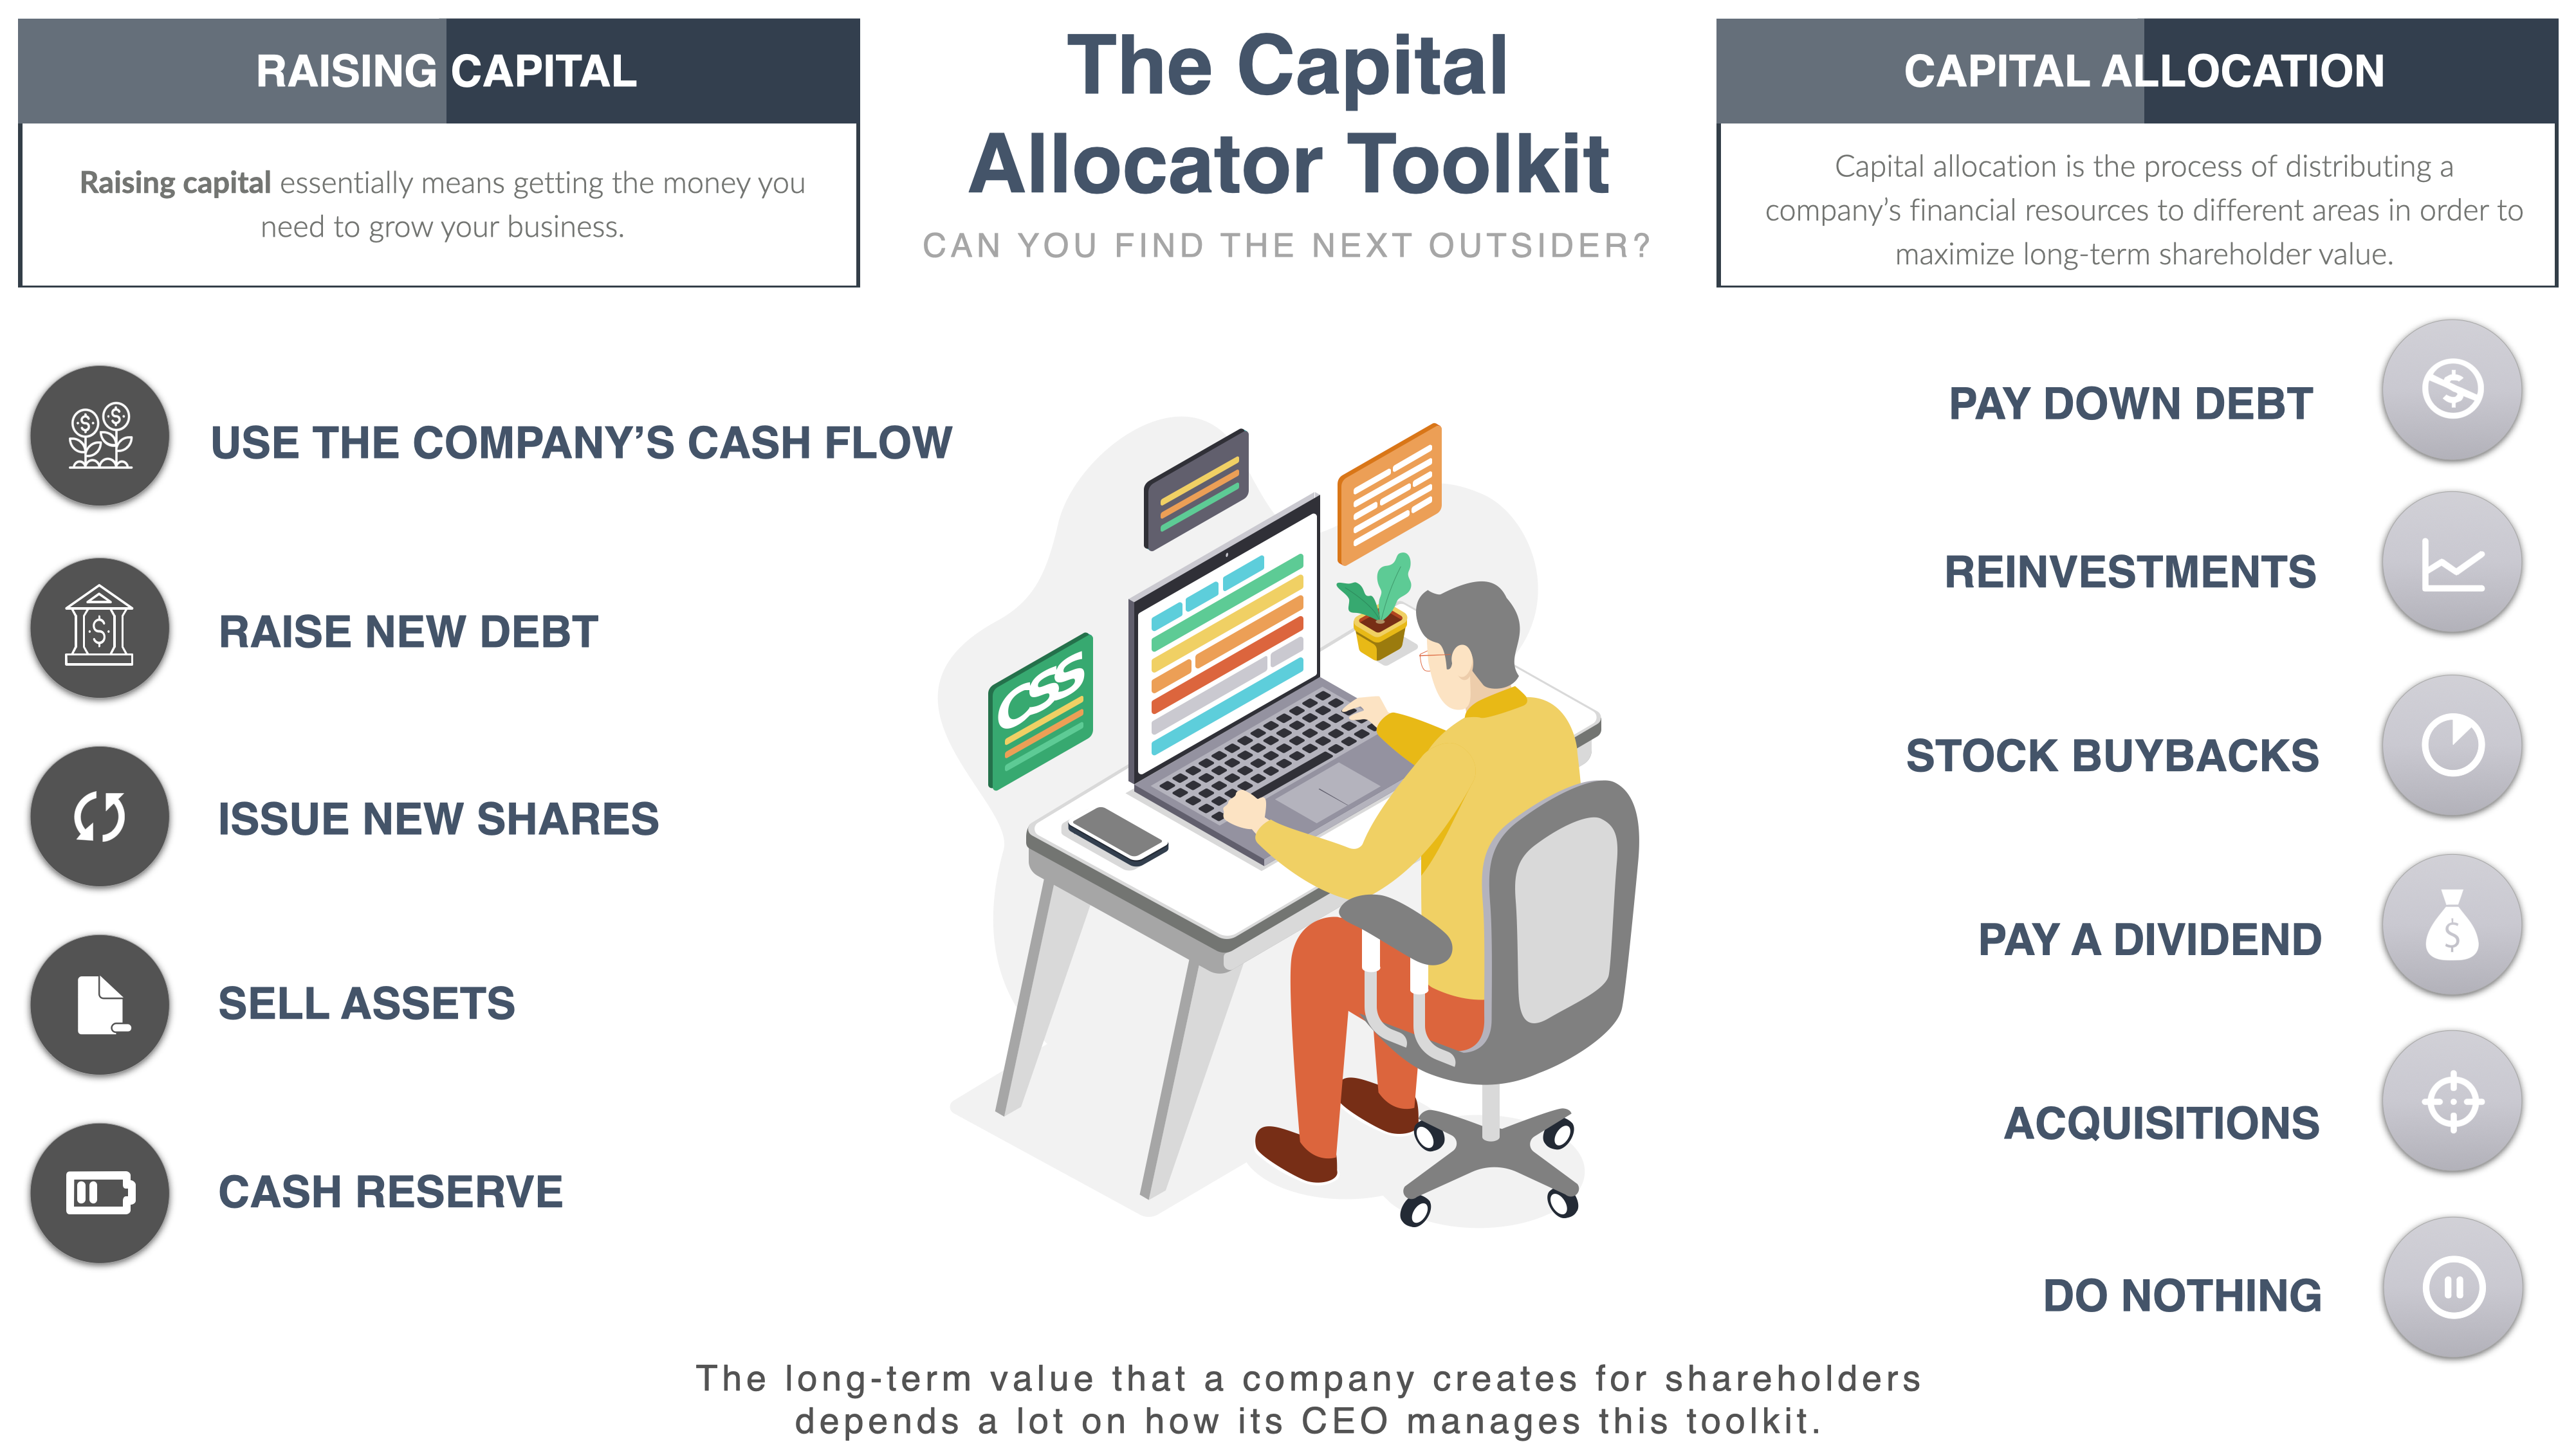
A management team that is skilled in capital allocation can make all the difference between a company’s success or failure. However, the P/E ratio doesn’t shed any light on how effectively management is using the available capital – is it creating tons and tons of value or quite literally setting shareholders’ money in fire?
A company that reinvests wisely and selectively buys back stock at an opportune time might be a good candidate for an investment, even if its P/E ratio looks higher than its peers.
But if the company is inefficient in deploying capital – say, by overpaying for acquisitions, or making large capital expenditures that don’t create value (not all growth is valuable!) – the P/E ratio will fail to alert you to these risks. The decision to allocate capital intelligently is a key factor that will drive a company’s long-term performance, and yet it is invisible in the P/E ratio.
PS: I guess one could bring up stock-based compensation, the rate of dilution, and actual per-share profit growth as well in this segment.
4) Earnings Quality
Another serious issue with the P/E ratio is its reliance on reported earnings, which can be distorted by various accounting practices. The quality of earnings can vary significantly between companies, and relying on earnings that are artificially inflated or deflated can lead to misvaluations.
For instance, a company might report strong earnings due to cyclical peaks, such as a booming market or high commodity prices. But this can be misleading if those earnings are not sustainable in the long term. Counterintuitively, cyclical companies tend to be the best investment when they look the most expensive.
The P/E ratio, however, treats these high earnings as if they reflect the company’s true earning potential, ignoring the fact that those numbers may be cyclical or inflated by one-time events.
A more effective approach would be to look at earnings adjusted for non-recurring events or to evaluate companies based on steady-state earnings (future profitability once growth reinvestments have stopped) and/or mid-cycle earnings (adjusting for embedded cyclicality).
But the P/E ratio doesn’t distinguish between cyclical peaks and attractive growth reinvestment opportunities, which can lead to faulty conclusions about a company’s valuation.
5) Durability & Moats
A company’s moat – its competitive advantages – plays a major role in its long-term success. The P/E ratio, however, doesn’t account for the durability of these advantages or the potential risks of disruption by new competitors.
Companies with strong, durable moats – such as a powerful brand, network effects, or regulatory barriers – can command higher valuations because they are better positioned to sustain profitability over time.
On the other hand, companies without a strong moat or with weak competitive positions might face significant challenges that could erode their earnings over time, even if they have a favorable P/E ratio.
6) Tail Risk
The P/E ratio also fails to account for tail risk – the possibility of rare, catastrophic events that can drastically affect a company’s valuation. In financial markets, tail risks are events that have a very low probability but can cause significant damage when they occur. Examples include regulatory changes, technological failures, technological disruption, or unexpected economic shocks.
If a company’s future earnings are highly vulnerable to such events – such as a heavily regulated industry or a business model exposed to unpredictable shocks or a business relying on a single product or just 1-2 key customers – the P/E ratio does not provide any insight into how these risks could affect its valuation. These black swan events might be overlooked entirely when assessing a company based solely on its P/E ratio, which is based on historical earnings and does not factor in extreme, low-probability outcomes.
For example, a company in an industry facing rapid disruption may be trading at a low multiple, but the P/E ratio would overlook the full scale of risk it faces from new competitors, and even that low multiple may still not be “fair.”
7) Probabilistic Modelling
Investing is inherently uncertain, and the future is rarely predictable in a linear way. Yet the P/E ratio treats earnings as if they are deterministic, based on the assumption that current profits will continue at the same pace. This approach ignores the range of potential future outcomes.
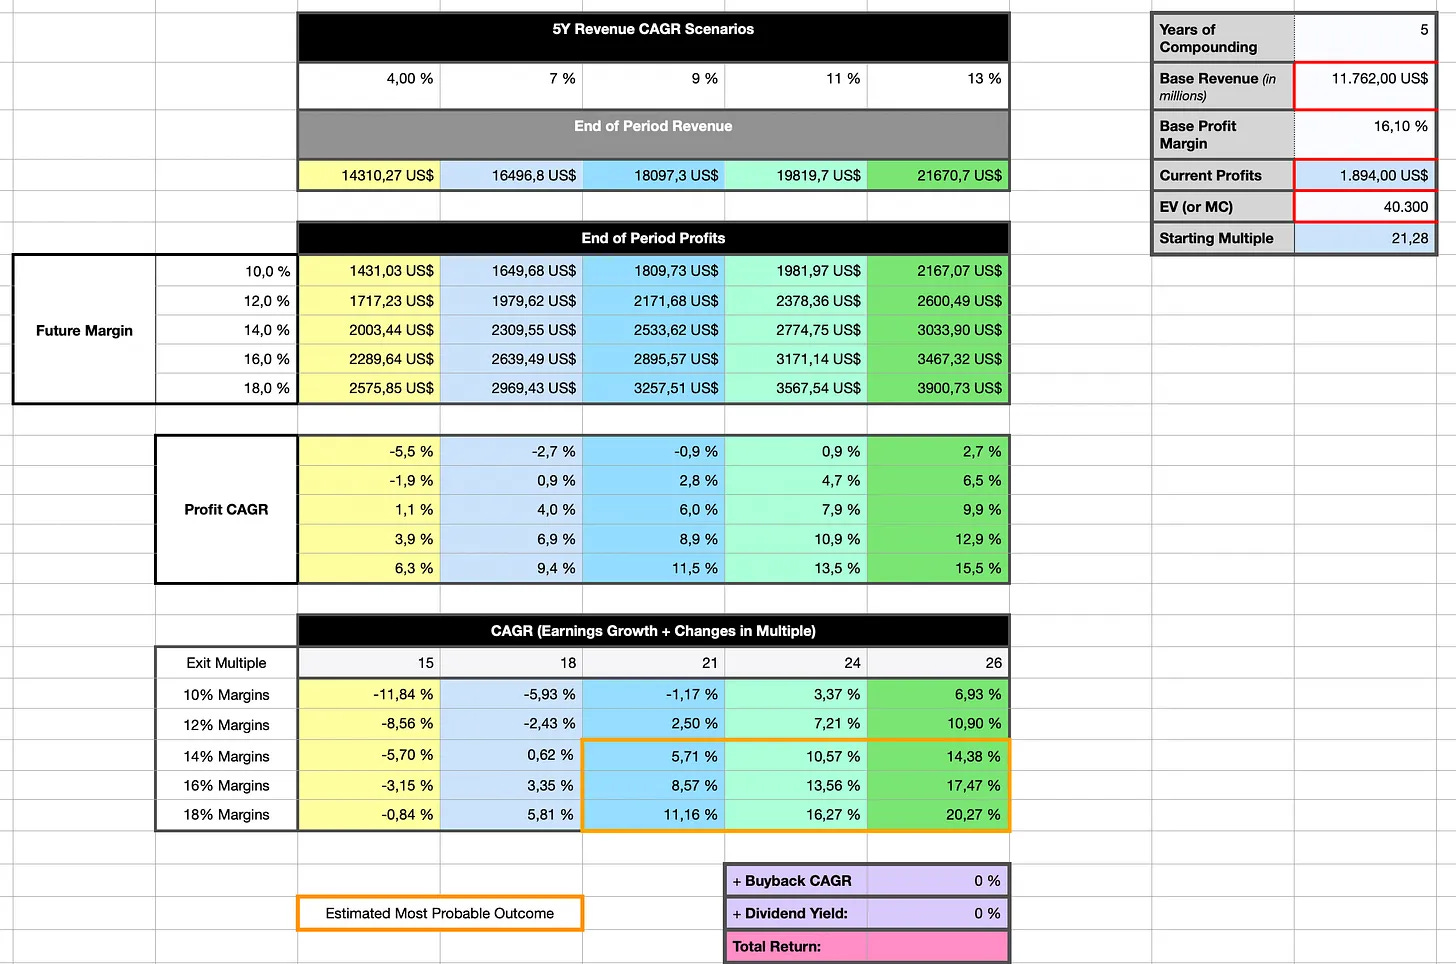
Probabilistic modelling, on the other hand, involves considering multiple scenarios and assigning probabilities to different outcomes. This approach gives investors a better understanding of the potential risks and rewards a company faces, rather than relying on a single estimate of future earnings. The P/E ratio doesn’t take this into account, which means it fails to factor in the inherent uncertainty of the business world and the unpredictability of future events.
Here’s an example of a recent scenario-based valuation attempt I recently shared in one of my deep dives:
To learn more about this topic, read this post next:
Thinking in Bets: What Poker and Horse Racing Teach Us About Markets

Most people wouldn’t naturally group stock market investing, poker, and horse betting into the same category. One has billion-dollar companies and earnings calls, another is played in smoke-filled card rooms (or sleek online interfaces), and the third involves animals, turf, and betting slips.
8) Opportunity Cost
Lastly, the P/E ratio doesn’t consider opportunity cost – the idea that the value of a company should be evaluated in the context of its alternatives. For example, a stock trading at a 20x P/E might seem reasonable in a low interest rate environment, but in a world where interest rates rise to 5%, that same multiple might look excessive. The opportunity cost of investing in a company with a high P/E ratio in a high-rate environment can be substantial, as investors could achieve better returns elsewhere.
9) Tiho Brkan’s Concerns on Pattern Recognition in Unstable, Nonlinear Fields
In addition to the standard pitfalls of the P/E ratio, Tiho Brkan, a critical voice in the investing community, has raised some very important points about how pattern recognition can mislead investors in unstable and nonlinear markets.
One of Brkan’s main arguments is that pattern recognition works well in stable and linear fields. In these fields, past events and data points can be a reliable predictor of future outcomes. For example, in chess, where the rules are fixed and the variables are constant, identifying patterns can lead to successful predictions and strategies.
However, the stock market is not a stable, linear field. It is an unstable and nonlinear environment, where past performance doesn’t necessarily predict future results. The stock market, like many complex systems such as military strategy, geopolitical events, or even public health, is characterized by nonlinearity – where cause and effect aren’t always directly connected and where outcomes can be counterintuitive.
In such environments, traditional methods like the P/E ratio, which rely on identifying patterns in historical earnings, can be misleading. The P/E ratio simply doesn’t capture the full complexity of market dynamics, and using it as a shortcut for stock valuation can create a false sense of security. Investors might mistakenly assume that the patterns observed in a company’s past earnings will continue into the future, overlooking the possibility that the environment has changed, or that new, unpredictable factors are at play.
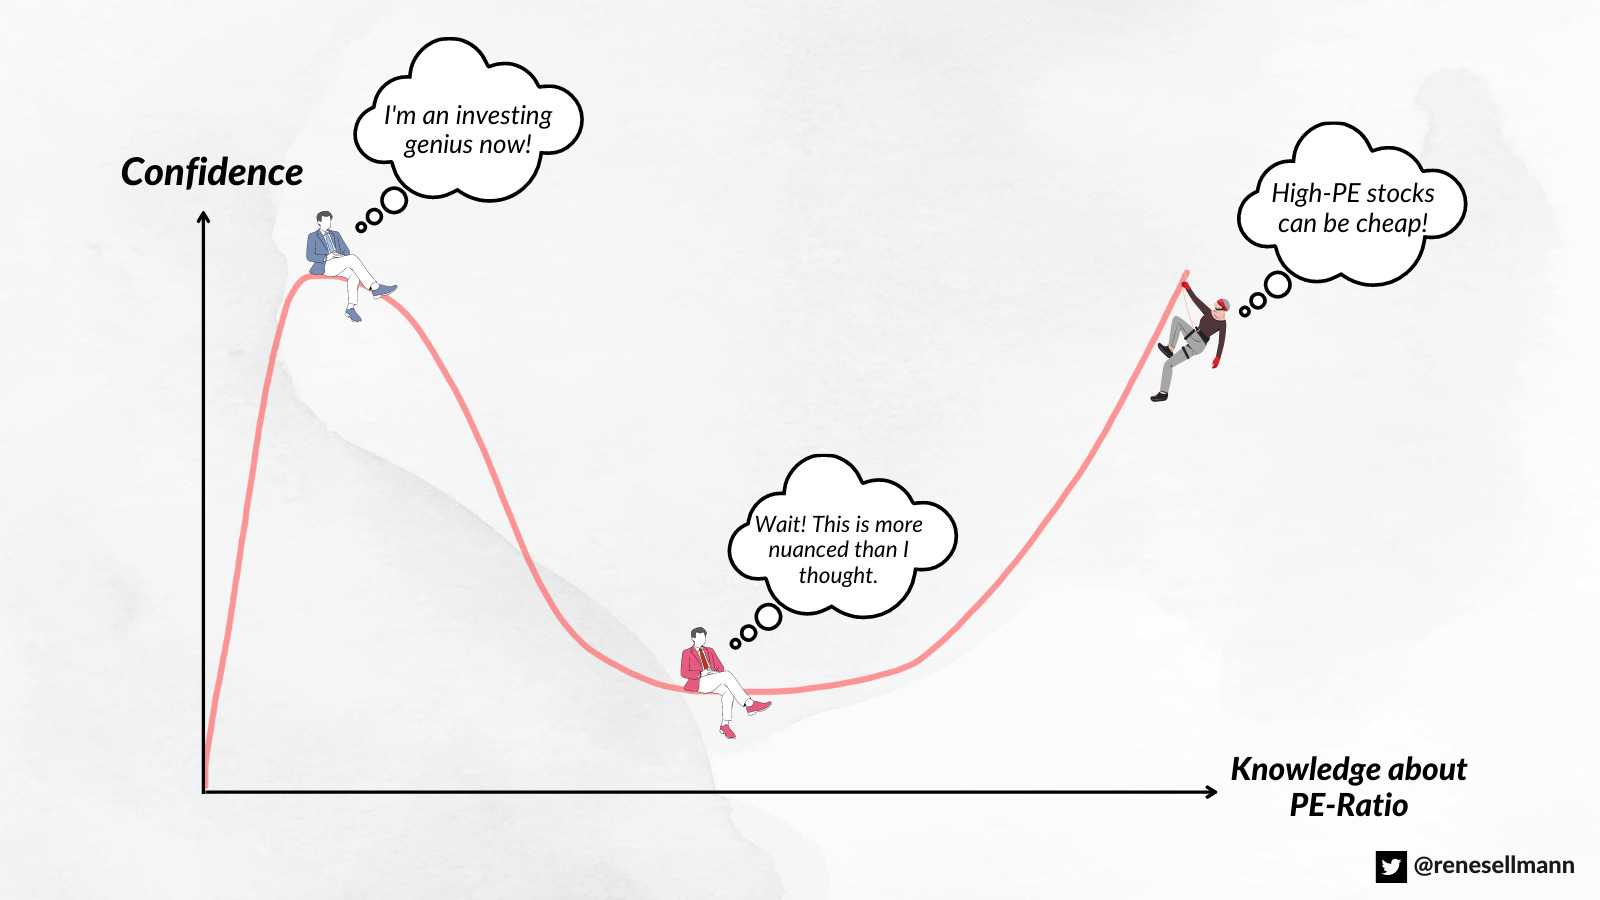
10) Overconfidence Bias and the Misuse of the P/E Ratio
Another critical insight from Brkan is the concept of overconfidence bias, which is particularly prevalent among seasoned investors. Overconfidence occurs when investors, especially those with experience, place too much trust in their tools and frameworks, assuming that what worked in the past will always work in the future. Brkan argues that many investors, after years of using the P/E ratio and other multiples, become overly reliant on these methods, even in a rapidly changing market environment.
As Brkan highlights, experience – while invaluable – is not the same as expertise. Overconfident investors, particularly those relying on traditional multiples, may misapply their knowledge, leading to costly mistakes. In a dynamic and volatile market, overconfidence in the P/E ratio and other valuation tools can create blind spots, preventing investors from seeing the bigger picture.
Join the private WhatsApp community!
Discuss stock ideas, ask questions, and get behind-the-scenes thoughts in real-time.
Available exclusively for paid subscribers. Want in? Choose the annual subscription plan + reply with your number (more details in the welcome email).PS: Using the app on iOS? Apple doesn’t allow in-app subscriptions without a big fee. To keep things fair and pay a lower subscription price, I recommend just heading to the site in your browser (desktop or mobile) to subscribe.
Part 2: Business-Specific Pitfalls
While we’ve discussed many of the broader pitfalls of using the P/E ratio, there are certain business-specific factors that make the metric even more inadequate.
In the real world, no two companies are alike, and the factors that influence one business’s valuation can differ significantly from those of another. These factors – ranging from complex accounting practices to unique business models or complex balance sheets – can make the P/E ratio a particularly misleading tool in some cases.
When dealing with companies that have intricate financial structures, aggressive acquisition strategies, or unique operational models, it becomes evident that traditional valuation multiples fall short.
These business-specific pitfalls often cannot be neatly categorized in a general list, as they require a deeper, often qualitative, understanding of the company’s specific context, strategy, and financial nuances.
One example of this that I recently covered on the blog is Topicus, a serial acquirer in the VMS space with a complex ownership structure and accounting practices that make its financial statements particularly difficult to interpret.
Deep Dive: Topicus.com Inc. ($TOI) – Master Piece

What started as a curiosity about a Constellation Software spin-off evolved into a massive 40,000-word journey through the intricacies of European software consolidation. To make this research as accessible as possible, I’ve woven all four parts of the
Below, I’ve excerpted a section from my deep dive on Topicus, where I discuss how the P/E ratio can be misleading when applied to such a company:
Why The P/E Ratio Is a Trap
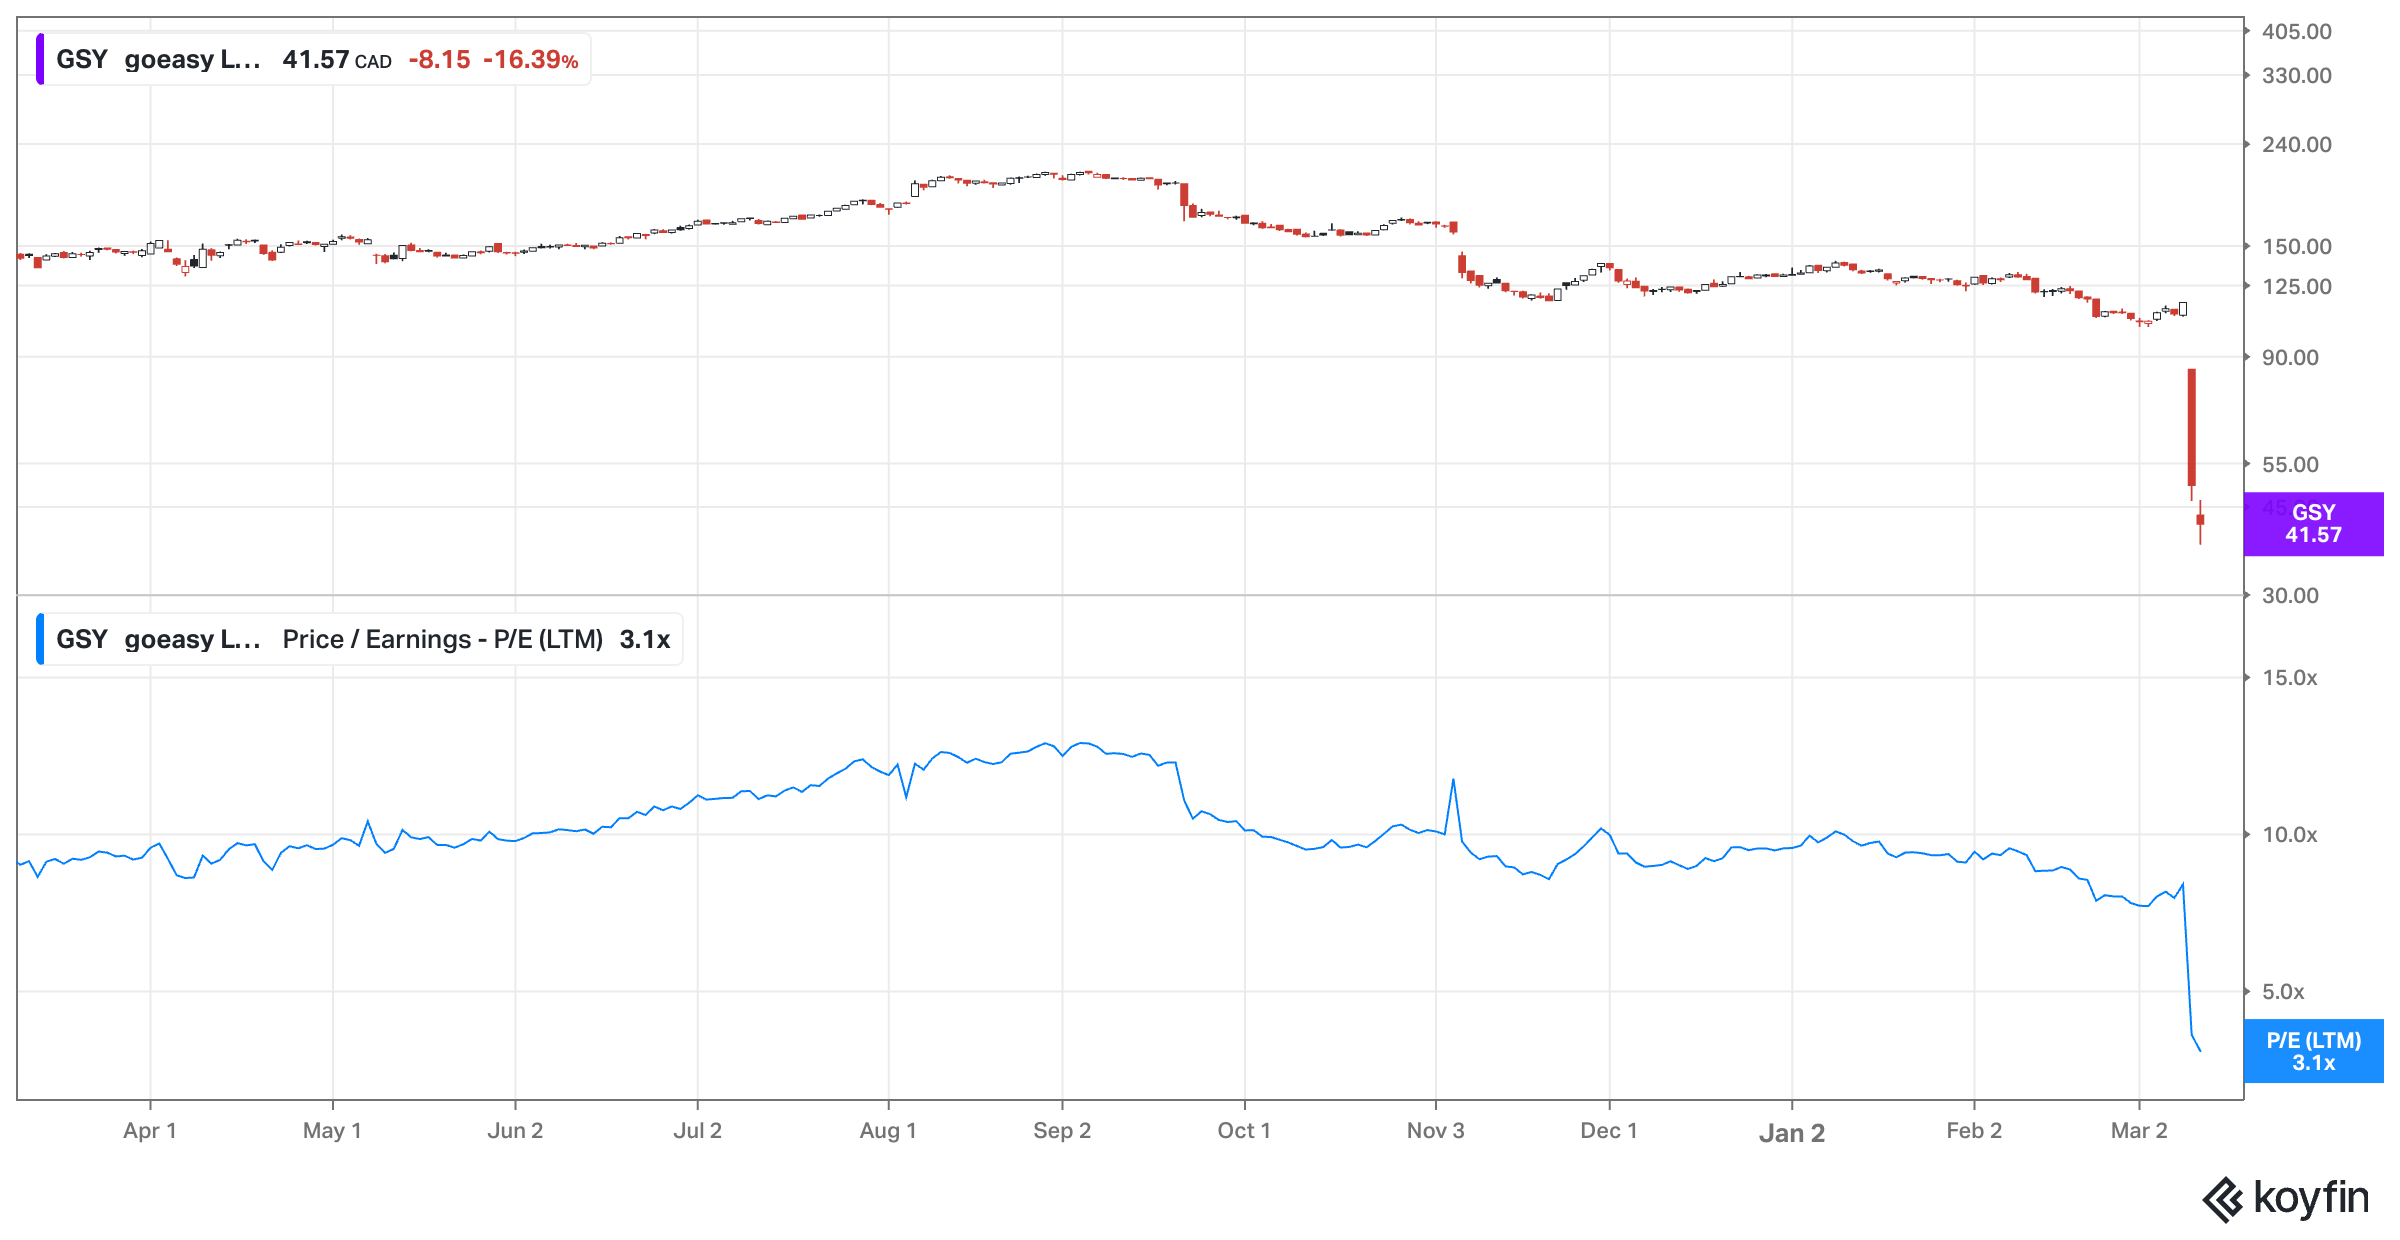
If you pull up a standard financial screener and look at the price–to–earnings ratio for Topicus, you are likely to see a number that looks either terrifyingly high or completely nonsensical.
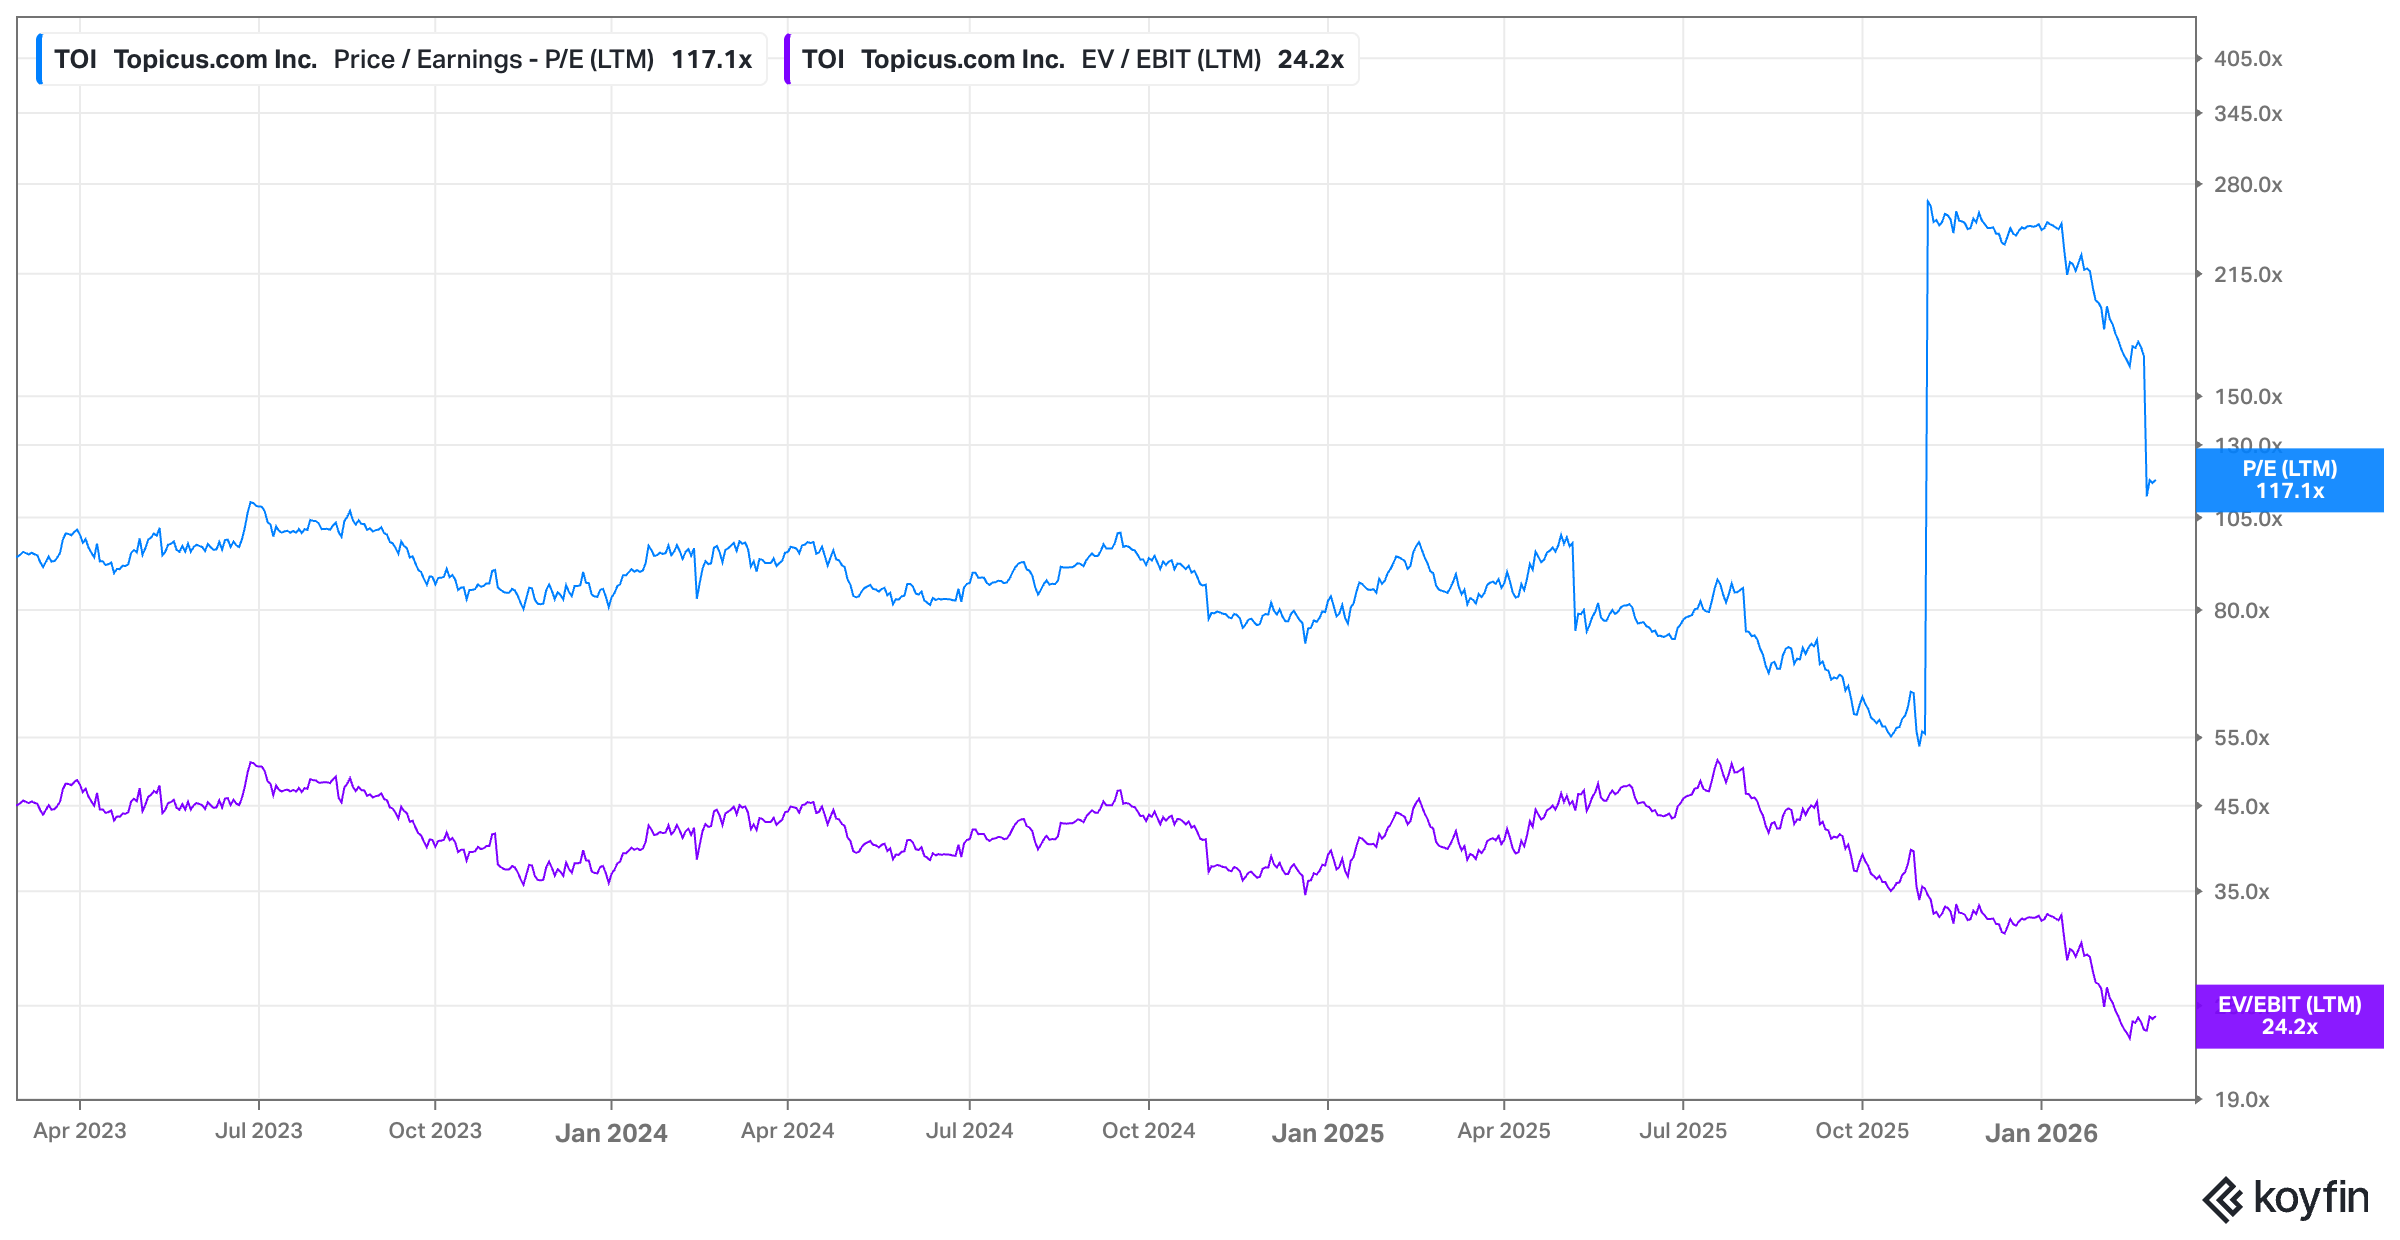
It is a common mistake. I see investors dismissing the company because the “multiple” doesn’t fit their value framework, but they are using a broken compass. The income statement of a serial acquirer like Topicus is intentionally designed to be “ugly” from a GAAP perspective. It is a byproduct of how they grow. If you rely on net income to value this business, you are doing it wrong. Here’s why:
The most recent source of confusion is the way Topicus handled its investment in Asseco Poland. As I mentioned earlier, the transition to the equity method in September 2025 forced a massive, non–cash revaluation loss of €221.7 million onto the books. In the eyes of a simple P/E screener, that looks like a collapse in profitability. In reality, it was just a technical reset. The company didn’t lose a cent; they simply changed the way they labeled the asset.
When you add the complexity of majority–owned subsidiaries like Sygnity, where you have to subtract non–controlling interests, and consider the complexity of Topicus’ ownership structure itself (go back to part 1 to fully understand the non-controlling interest associated with the shares held by entities like Joday and Ijssel), the “bottom line” becomes a hall of mirrors.
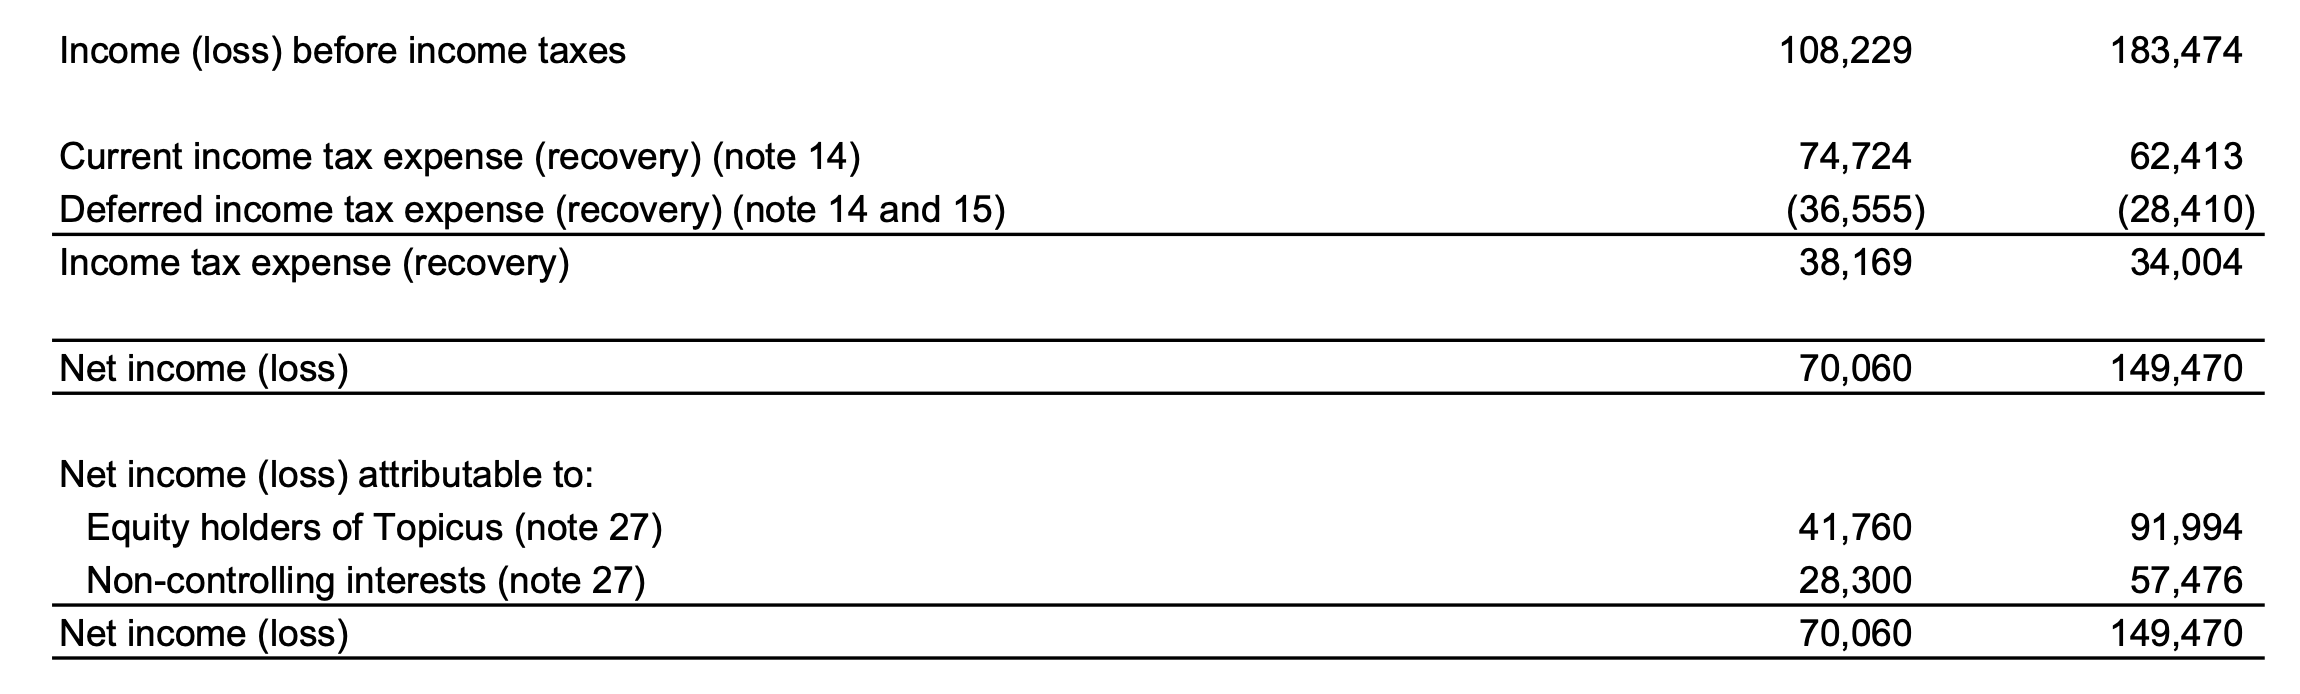
You are looking at a mix of fully consolidated revenues, proportional profits from associates, and subtractions for minority partners. The income statement is trying to tell too many stories at once.
Another reason the P/E ratio fails here is the heavy burden of amortization. When Topicus buys a software company, they have to allocate a huge chunk of the purchase price to “intangible assets” (we discussed this in our balance sheet analysis) – basically the value of things like the software code and the customer relationships. They then “depreciate” these assets over several years. This creates a massive non–cash expense that pulls down net income.
Is the software actually losing value that quickly? Usually not. In many cases, the mission–critical nature of VMS means software solutions will be used for decades, yet the accounting rules force Topicus to pretend they are evaporating. This is a gift for the company because it reduces their taxable income, allowing them to keep more cash for the next acquisition. But for the investor looking at the P/E ratio, it makes the company look much less profitable than it really is. It’s a classic case where a “bad” income statement is actually a sign of a very healthy, tax–efficient cash machine.
I also want to briefly touch on the working capital dynamics, which is perhaps the most underappreciated part here. Because Topicus mainly sells subscription software (as a reminder, maintenance fees account for approximately 70% of revenue), they often collect payment upfront at the beginning of the year (“Many of the businesses invoice customers for annual software maintenance fees in Q1 each year resulting in a disproportionate amount of cash being received in the first quarter as compared to the remaining three quarters […]”). This creates “deferred revenue” – a liability on the balance sheet that hasn’t been recognized as income yet.
You receive the cash today, but you only get to report the “earnings” slowly over the next twelve months. This creates a beautiful disconnect. The cash is already in the bank and being used to buy the next company, but the income statement hasn’t been given permission to show it to you yet. If you only look at net income, you are missing this constant float of “free” capital. It is a business model that essentially funds its own growth through its customers’ wallets.
When you piece it all together – the accounting dynamics, the non–cash amortization, and the upfront cash collection – you realize the P/E ratio isn’t just suboptimal. It’s a distraction.
In the excerpt above, I detail the unique challenges of valuing a company like Topicus, which, despite its growth and strategic acquisitions, may appear overvalued when looked at through the lens of the P/E ratio. As highlighted in the case of Topicus, the P/E ratio doesn’t capture important aspects like the impact of non-cash revaluation losses, deferred revenue, non-controlling interests, or the nuances of the company’s capital allocation strategy.
Part 3: But What if I Change the Denominator?
After discussing the limitations of the P/E ratio, one might naturally wonder whether using an alternative denominator – like “Free Cash Flow (FCF)” or if you want to out yourself as a Buffett disciple, “Owner Earnings” – might offer a more accurate picture of a company’s value.
The logic behind this is simple: while the P/E ratio is based on net income, there are several other financial metrics that can give a clearer picture of how much cash – real profits – a company is actually generating, which is ultimately what matters for long-term growth and shareholder returns.
However, while these alternative denominators may address some of the flaws of the P/E ratio, they also come with their own set of challenges and require further adjustments. Let’s dive into how these alternatives compare and whether they solve the underlying issues we’ve discussed.
Free Cash Flow is often seen as a more reliable measure of a company’s financial health compared to net income. It represents the cash a company generates after accounting for capital expenditures (CapEx), and it’s a key indicator of whether a company has enough resources to reinvest in the business, pay dividends, or reduce debt (capital allocation decisions). Because free cash flow focuses on cash generation rather than accounting earnings, it provides a clearer view of a company’s ability to create value over time.
Another metric that can provide a more accurate valuation snapshot may be Owner Earnings. This concept, popularized by Warren Buffett, refers to the “true” cash earnings available to shareholders, after accounting for necessary capital expenditures, working capital changes, and non-recurring items. Unlike the P/E ratio, which doesn’t adjust for these factors, Owner Earnings gives a more nuanced view of a company’s ability to generate sustainable returns.
The major advantage of both Free Cash Flow and Owner Earnings over the P/E ratio is that they focus on actual cash generation, which is what really drives the long-term value of a company. A company may have strong earnings on paper, but if those earnings don’t translate into cash flow – whether due to high capital expenditures, accounting adjustments, or other factors – then the P/E ratio can be misleading.
However, even these alternative denominators have their limitations, and there are nuances that need to be taken into account.
While Free Cash Flow and Owner Earnings can offer a more accurate view of a company’s financial health, they are still subject to the same factors (e.g. ROIIC and reinvestment rates) and accounting complexities we discussed earlier – all influencing the actual “fair” multiple.
To fully account for the real value generated by a business, many investors, including myself, use a more adjusted version of Owner Earnings, which strips away non-recurring and non-cash items, such as stock-based compensation, capitalized R&D, and interest payments. Here’s an example of how to adjust for these items:
Owner Earnings = Operating Cash Flow (OCF) – Capital Expenditures (CapEx)
+/- Adjustments:
Subtract Stock-Based Compensation (SBC)
Adjust for Lease Principal Payments (IFRS 16)
Account for Capitalized R&D
Subtract Interest Paid if reported in financing activities
+/- Normalized Working Capital Adjustments (e.g., changes in accounts receivable or payable)
+/- One-Off Tax Effects
This adjusted formula provides a clearer picture of a company’s true earnings potential by accounting for these accounting distortions.
No Single Metric is Perfect
Ultimately, while Free Cash Flow and Owner Earnings offer improvements over the P/E ratio, no single metric is perfect. Each has its own set of challenges and limitations and requires critical judgment.
Investors should be wary of relying too heavily on any one metric, whether it’s P/E, Free Cash Flow, or Owner Earnings. A more comprehensive approach involves looking at the entire financial picture, including capital allocation decisions, reinvestment rates, competitive advantages, debt, and the company’s exposure to risks (such as tail risk or disruptions in its industry).
By combining multiple metrics and adjusting for key accounting complexities, investors can gain a better understanding of a company’s true value – one that goes beyond surface-level earnings or multiples. This holistic approach allows investors to make more informed decisions and avoid the pitfalls that come with over-reliance on a single valuation metric.
Part 4: The Other Half of the Equation: The “P” in the P/E Ratio
While much of our discussion around valuation ratios like the P/E ratio so far focused on the denominator (earnings), it’s essential to also consider the numerator, which, in this case, is the market capitalization. The “P” in P/E can be just as flawed as the denominator and, when misunderstood, can lead to major miscalculations in valuation.
One of the most significant flaws in the “P” is that it does not account for net cash or net debt. This is crucial because a company with a strong cash position or minimal debt may deserve a lower multiple due to its ability to weather economic downturns, invest in growth, or return capital to shareholders. Conversely, a company with heavy debt might deserve a higher multiple due to the additional risks associated with its financial structure. And of course, if you’d acquire the entire company, you’d acquire the debt too!
For example, imagine a growing company that trades at a P/E ratio of 20, which, on the surface, seems reasonable. However, upon closer inspection, you find that the company holds a significant portion of its market capitalization in cash. When you adjust for the cash on hand, the company’s effective P/E ratio could drop significantly, making it actually more attractive than the headline P/E figure would suggest.
On the flip side, a company that’s highly leveraged could have a deceptively low P/E ratio.
Cash on the Balance Sheet & Value Traps?
But here’s where even more nuance comes in: cash on the balance sheet can sometimes become a value trap. If a company is sitting on a large cash hoard, yet management has no clear plans to deploy that cash productively – yes, I’m looking at you Japanese management teams ... – then that cash may not be worth much to shareholders, and valuing the business on its Enterprise Value instead of its market cap may turn into yet another pitfall.
In these cases, even if the company’s “adjusted P/E ratio” looks much more attractive because of its large cash reserves, the market could still be mispricing the stock. Cash sitting idly on the balance sheet for decades does not generate returns for shareholders.
The same principle applies when looking at debt. A company that takes on a significant amount of debt might appear to be undervalued based on its P/E ratio, but the financial risk tied to that debt can often outweigh the apparent value. Debt can be a double-edged sword—it might fuel growth in the short term, but if it isn’t managed properly, it could lead to financial strain, especially in periods of economic volatility.
Conclusion: Rethinking the P/E Ratio and Embracing a Comprehensive Approach to Valuation
The Price-to-Earnings (P/E) ratio is undoubtedly one of the most popular tools in an investor’s toolkit. It’s simple, it’s familiar, it’s accessible to beginners, and it provides a quick snapshot of how “expensive” or “cheap” a stock might be.
But as we’ve seen, it really DOES NOT.
This seemingly straightforward metric comes with significant flaws that can easily mislead investors, especially when used in isolation.
The P/E ratio fails to account for key factors like a company’s reinvestment rate, the efficiency of its capital allocation, and the true quality of its earnings. It doesn’t capture the durability of a company’s competitive advantages, its exposure to tail risks, or its ability to generate sustainable growth over the long term. In some cases, like with Topicus, the P/E ratio fails miserably to reflect business-specific accounting practices.
Additionally, while adjusting the denominator to metrics like Free Cash Flow or Owner Earnings can provide a clearer view of a company’s cash-generating ability, these metrics come with their own set of challenges. Accounting complexities, like stock-based compensation, capitalized R&D, and working capital manipulation, still need to be carefully accounted for to avoid overestimating a company’s true financial earnings power.
But perhaps just as importantly, the numerator, the “P” in the P/E ratio, introduces its own set of distortions. The market cap fails to account for the company’s net cash or net debt, which can significantly affect the multiple.
So, what’s the takeaway?
The P/E ratio is just the starting point, not the be-all and end-all of stock valuation. Investors need to go beyond the numbers, adopting a more holistic approach to valuation that includes an in-depth analysis of a company’s growth potential, capital allocation strategy, risk factors, and balance sheet dynamics. Understanding a company’s true earnings power, factoring in net cash or net debt, and adjusting for accounting complexities is crucial for getting an accurate picture of its long-term value.
As investors, we must be willing to embrace a deeper, more nuanced understanding of the businesses we invest in. This is a competitive field and if you want to generate alpha, you better work hard on improving your valuation skills. Relying on a single multiple like the P/E ratio may seem convenient, but it’s a shortcut that often leads to more harm than good (i.e. underperformance). A more comprehensive approach will help you make better-informed decisions and uncover opportunities that others might overlook.
In the end, it’s not about rejecting the P/E ratio entirely—it’s about recognizing its limitations and using it as part of a broader toolkit. In a complex and dynamic market, that’s the only way to truly uncover the value of a business and make intelligent, long-term investment decisions.
Great post @René Sellmann!
I would also add that the PE ratio does not take into account accounting subtleties such as depreciation and amortization (which reduce profits but not necessarily cash generated) and does not make any adjustments to CAPEX between maintenance and growth.