

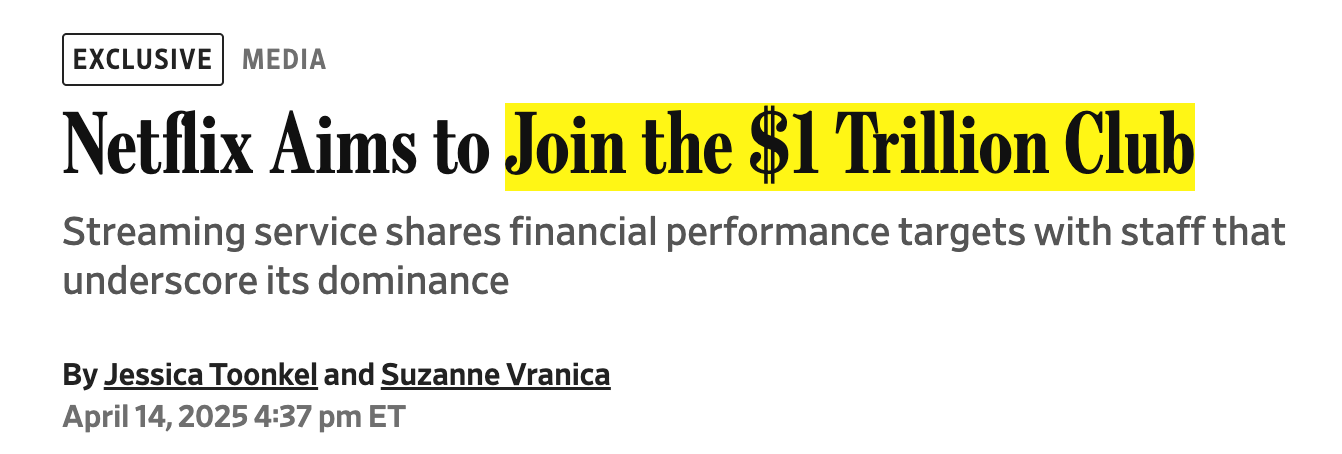
In April 2025, the Wall Street Journal ran an exclusive with a headline that has aged like a carton of milk left on a radiator: “Netflix Aims to Join the $1 Trillion Club.” The piece reported that management had shared internal financial targets with staff, and the subhead described figures that “underscore its dominance.”
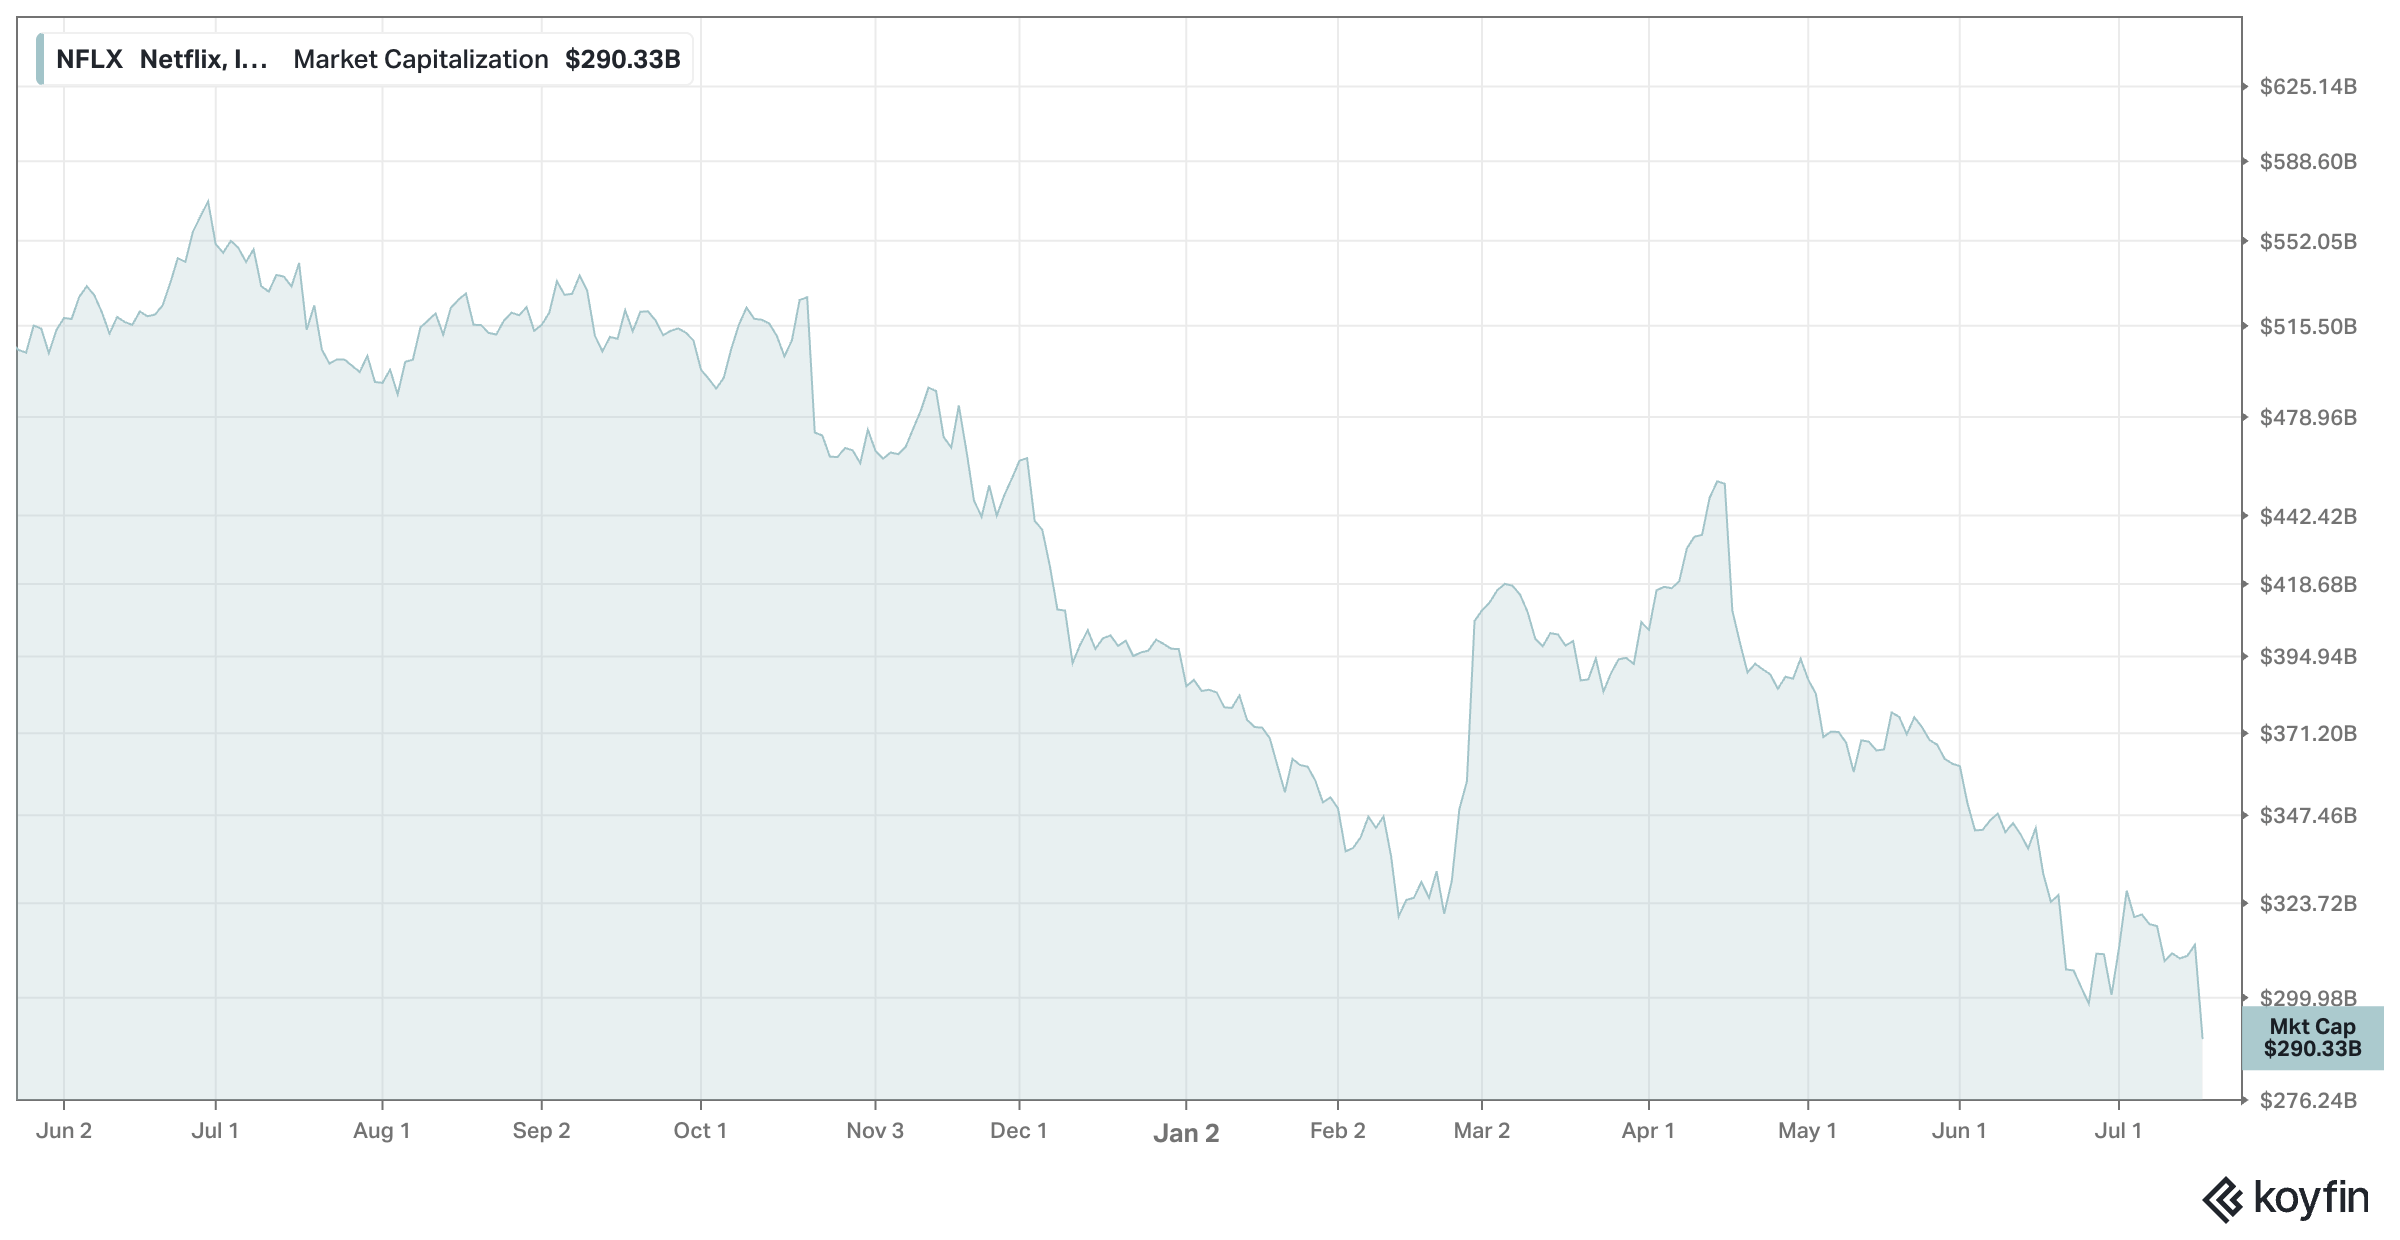
Fifteen months later, Netflix’s market capitalization sits below $300 billion. The trillion-dollar club will have to wait.
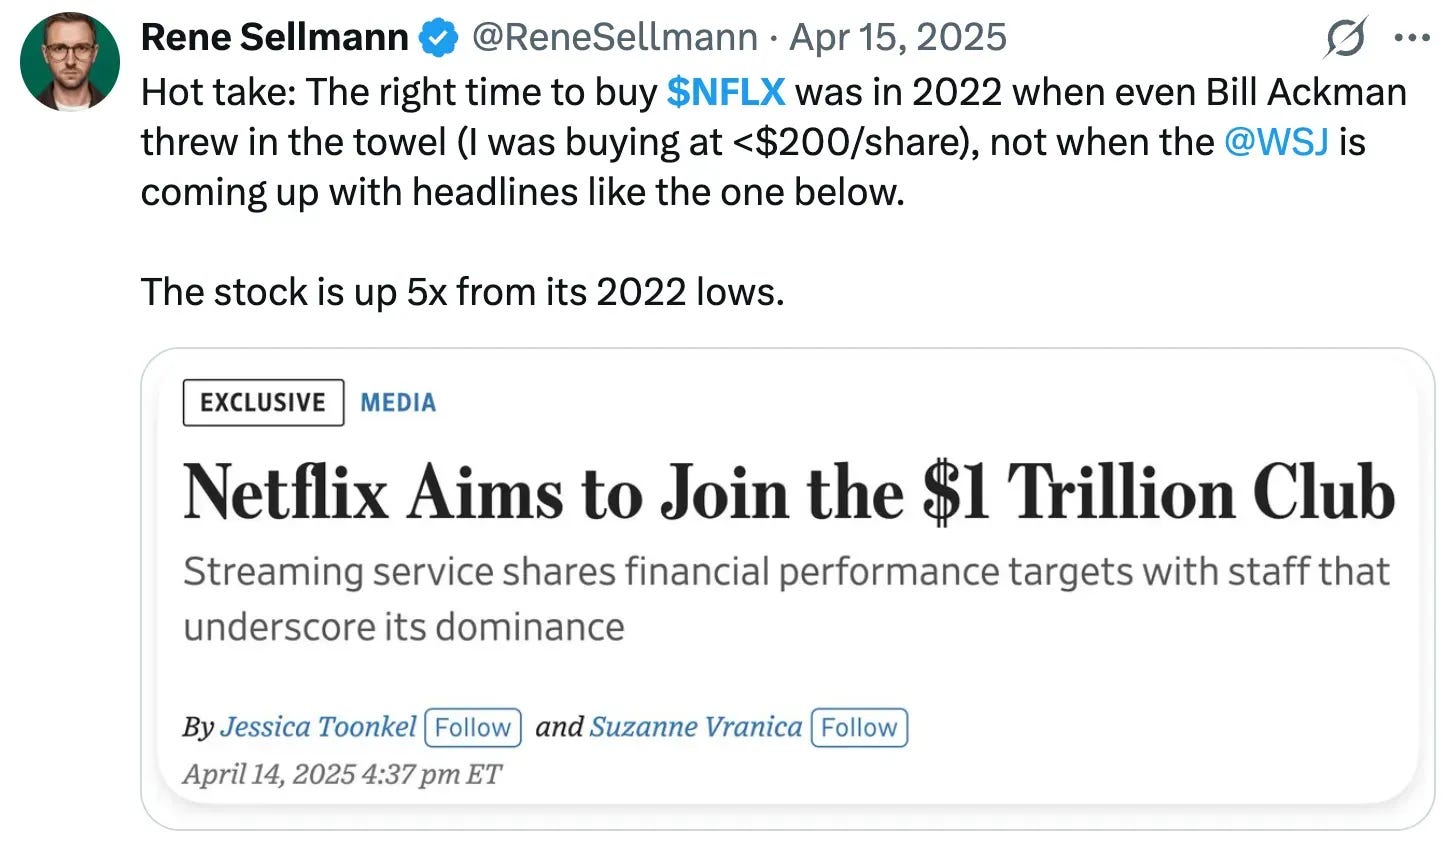
I remember reading that headline and feeling the specific discomfort that comes from owning something everyone has finally agreed is wonderful. I posted about it at the time, arguing that the moment to buy Netflix had been 2022, when Bill Ackman capitulated and dumped his entire position at a loss and I was picking up shares below $200, rather than the moment when the financial press starts writing about trillion-dollar ambitions. The stock was up fivefold from its 2022 lows when I wrote that.
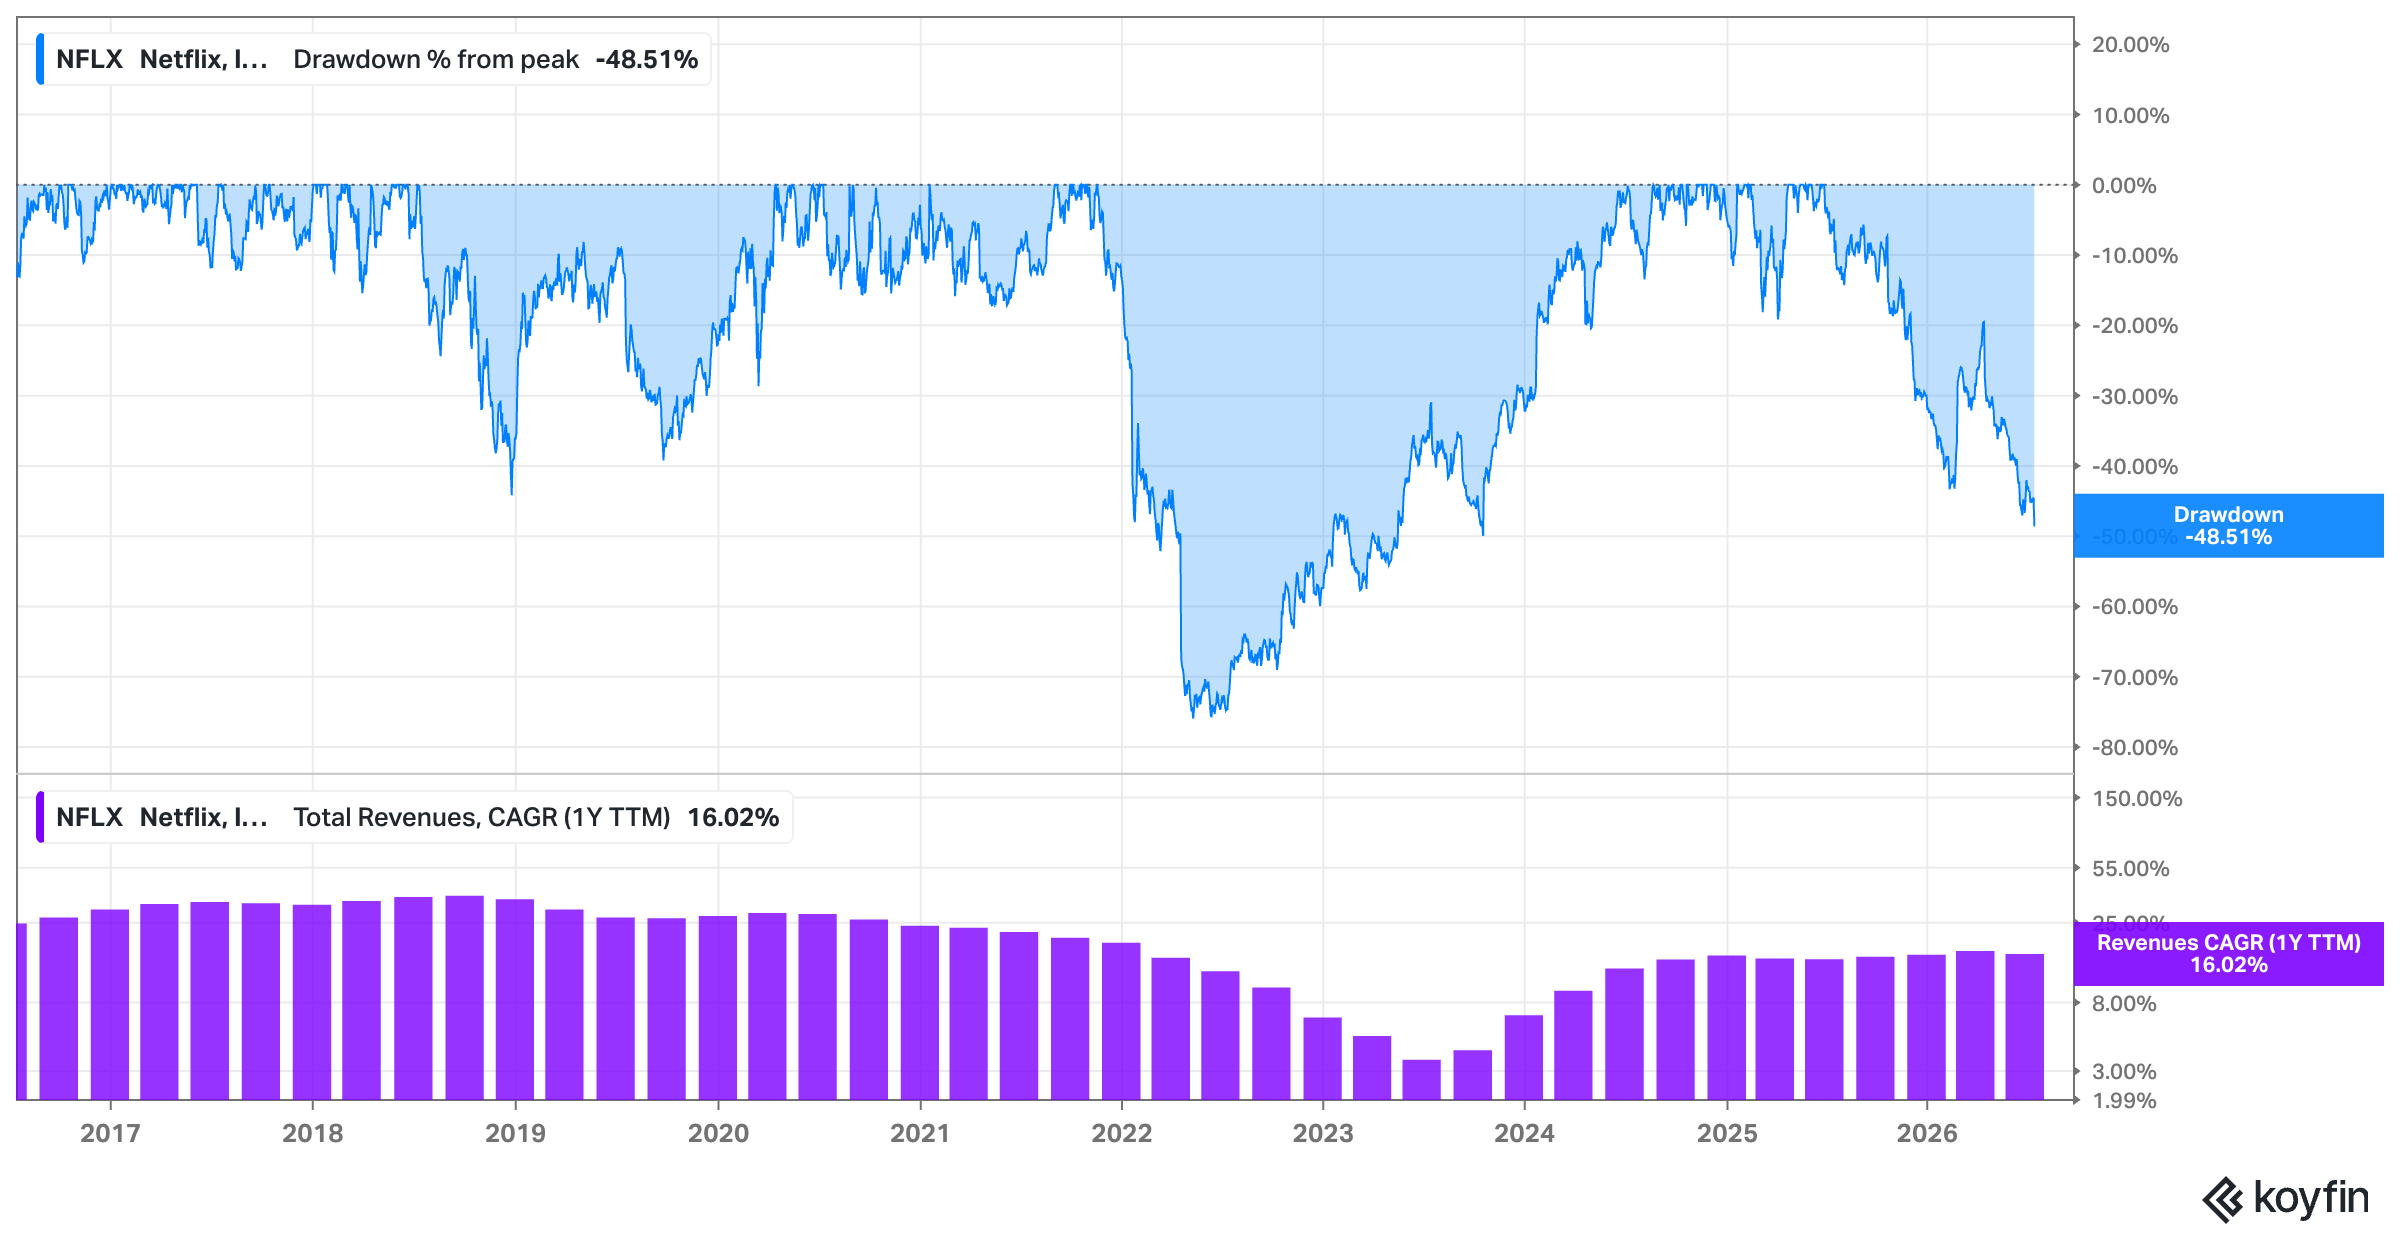
From the June 2025 high, Netflix has given back about 50%, and anyone who bought the day that WSJ headline ran is sitting on a loss today.
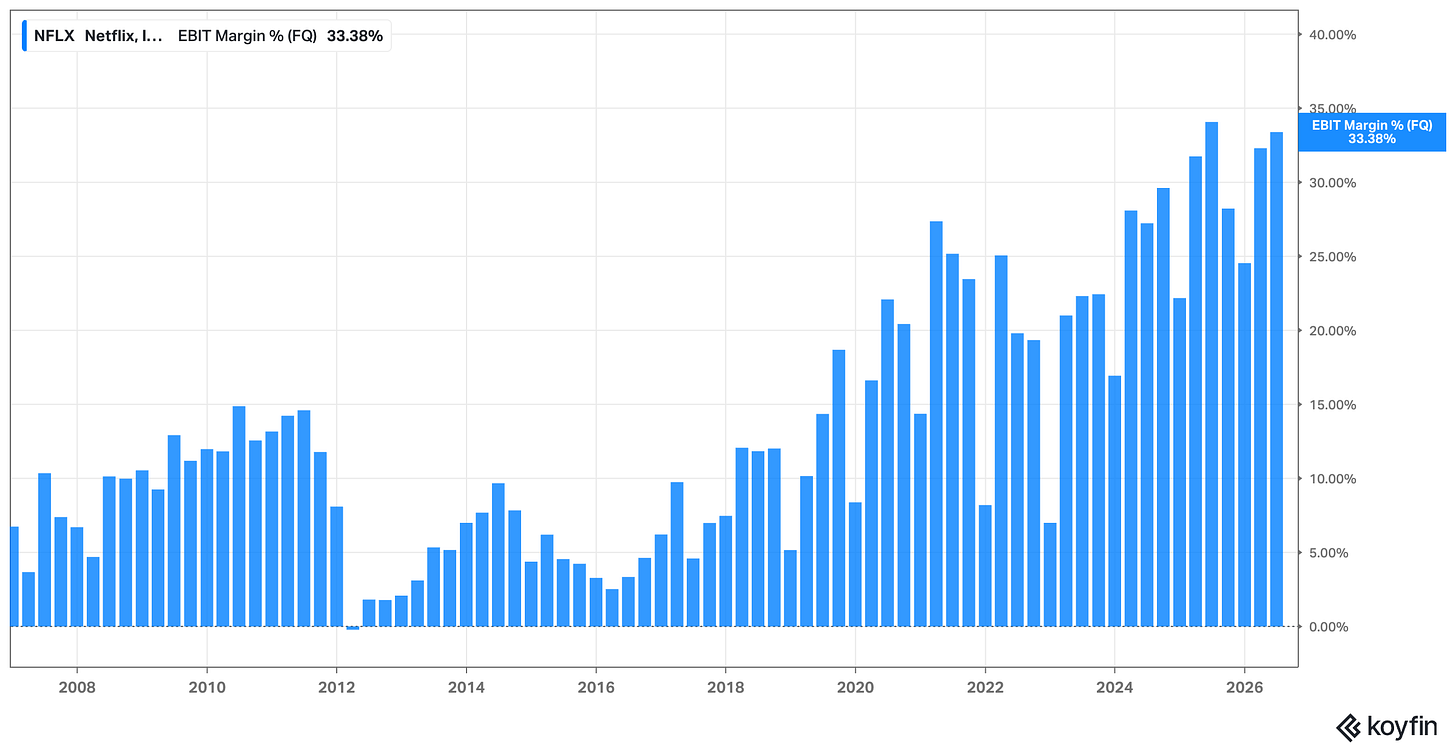
So here we are, and the setup is genuinely strange. Netflix won the streaming wars. There is no serious argument left about that. It is the only pure-play streamer earning a substantial operating profit, its competitors are merging out of exhaustion, and it just posted a quarter with a 33.4% operating margin and $3.4 billion of net income.
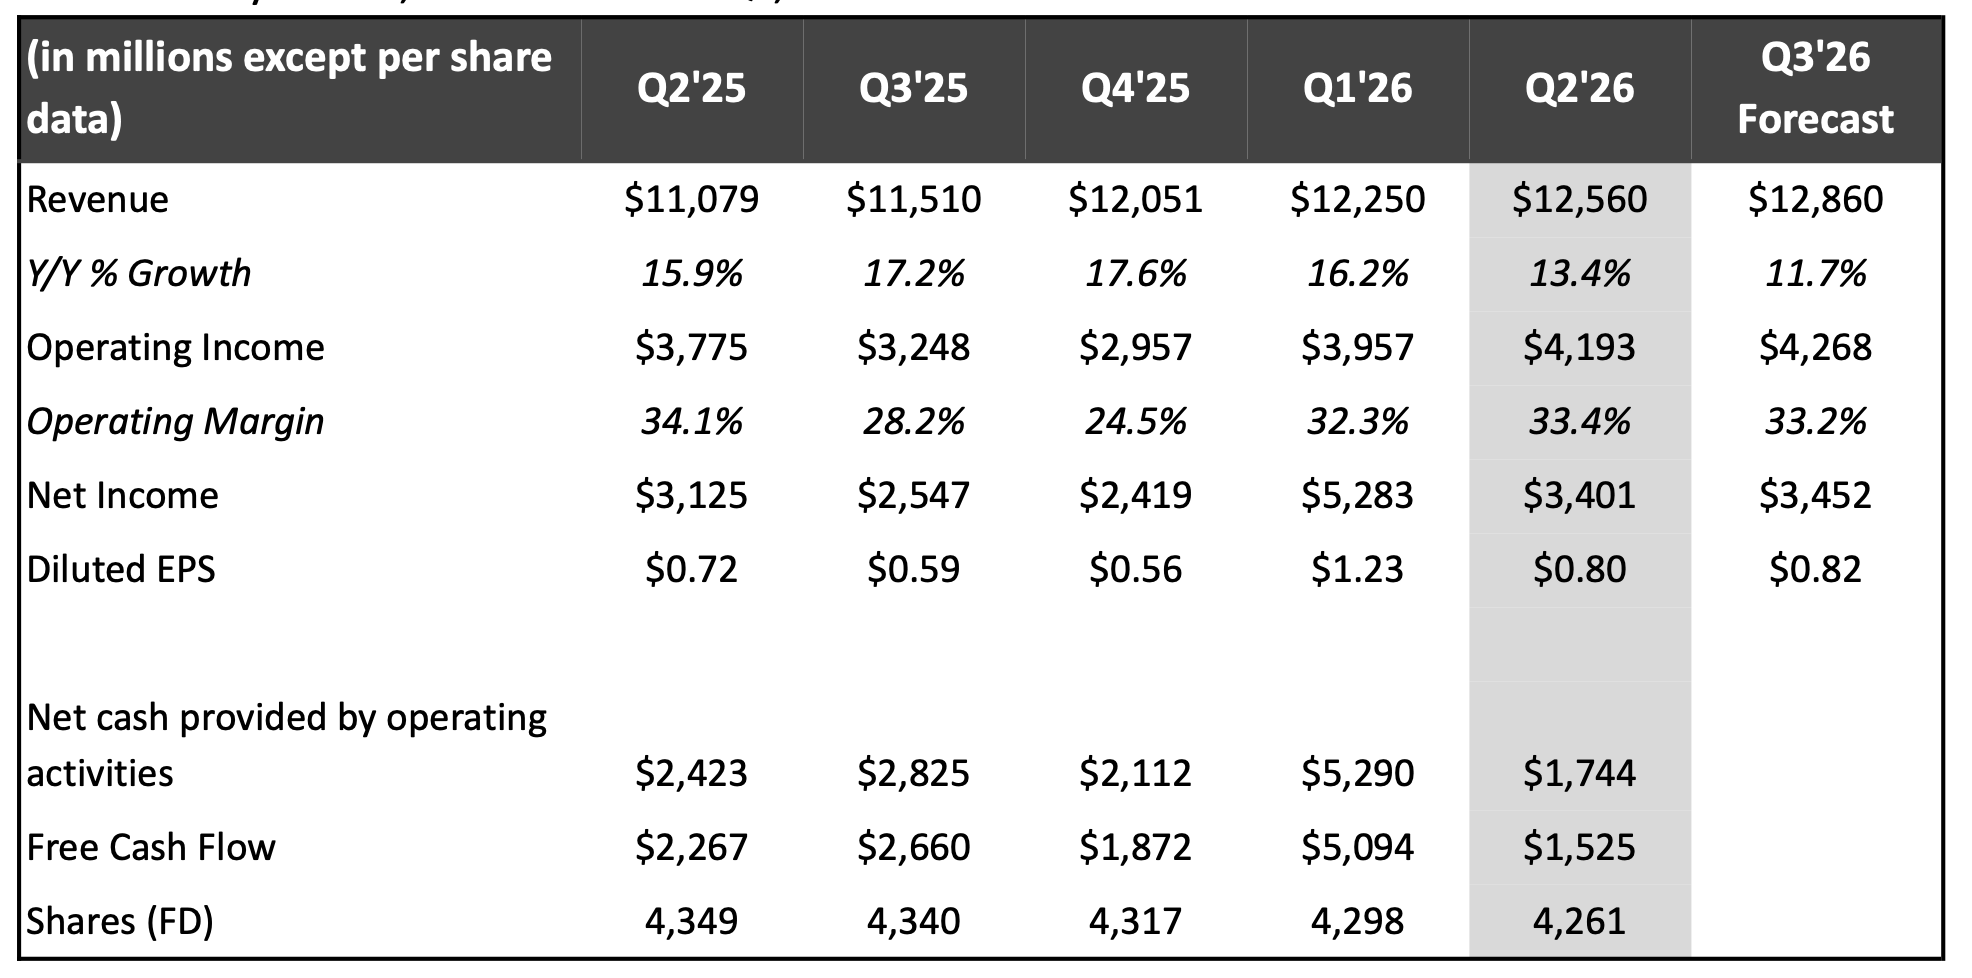
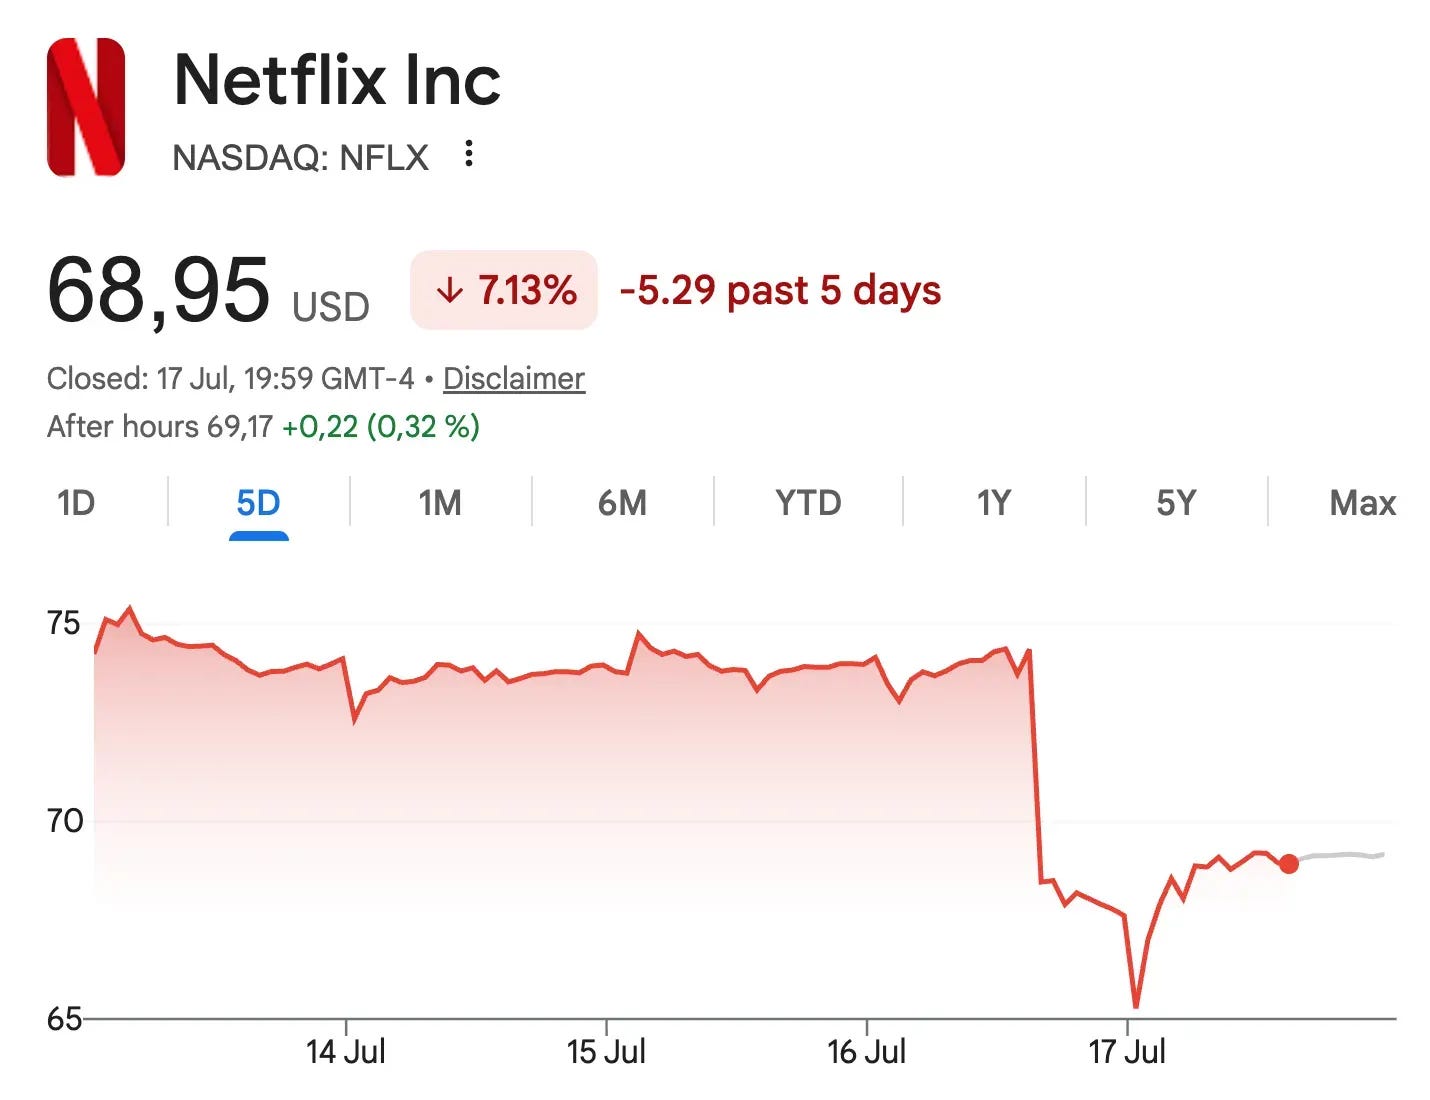
The company is generating more profit than at any point in its history. And the stock fell nine percent after hours.
That gap is what this piece is about.
What we cover today:
Over the next several sections, I’m going to rebuild my valuation model from the ground up:
A look at the Q2 results and what it reveals.
How big is the addressable market and how much of it can Netflix credibly take?
What growth rate can you underwrite for the next five years, …
… and which drivers actually deliver it once you strip out double-counting effects?
Where do margins settle, and how fast do they get there?
Whether AI is a threat to Netflix's content moat, a subsidy for it, or something more awkward than either?
And then the question I keep coming back to: I bought this stock in 2022 at around ten times EBIT when Wall Street doubted streaming could ever be highly profitable, and I want to work out honestly whether the bet available today is the same one, or merely a good one wearing the same clothes.
And finally, a downloadable model so you can make your own adjustments.
Disclaimer:
As of the date of publication the author owns no shares in the company; but that may change. The analysis presented in this blog may be flawed and/or critical information may have been overlooked. The content provided should be considered an educational resource and should not be construed as individualized investment advice, nor as a recommendation to buy or sell specific securities. I may own some of the securities discussed. The stocks, funds, and assets discussed are examples only and may not be appropriate for your individual circumstances. It is the responsibility of the reader to do their own due diligence before investing in any index fund, ETF, asset, or stock mentioned or before making any sell decisions. Also double-check if the comments made are accurate. You should always consult with a financial advisor before purchasing a specific stock and making decisions regarding your portfolio.
1) Q2 Results: An Adequate Quarter Nobody Liked?
Let’s start with the latest quarterly report as a starting point. Q2 2026 was fine. Revenue came in at $12.6 billion, up 13% year over year, landing on consensus. Operating income was $4.2 billion. Earnings were eighty cents a share. Operating margin at 33.4% actually beat the company’s own guidance, which I believe is the single most important number in the release, and I’ll come back to why.
The sell-off had nothing to do with any of that, I believe.
What spooked the market was the Q3 guide of $12.86 billion, implying growth of around 11.7%, another step down the deceleration ladder.
In addition, I want to flag six things that were in Netflix’s Q2 release that are worth carrying forward into the serious valuation work we will conduct further below:
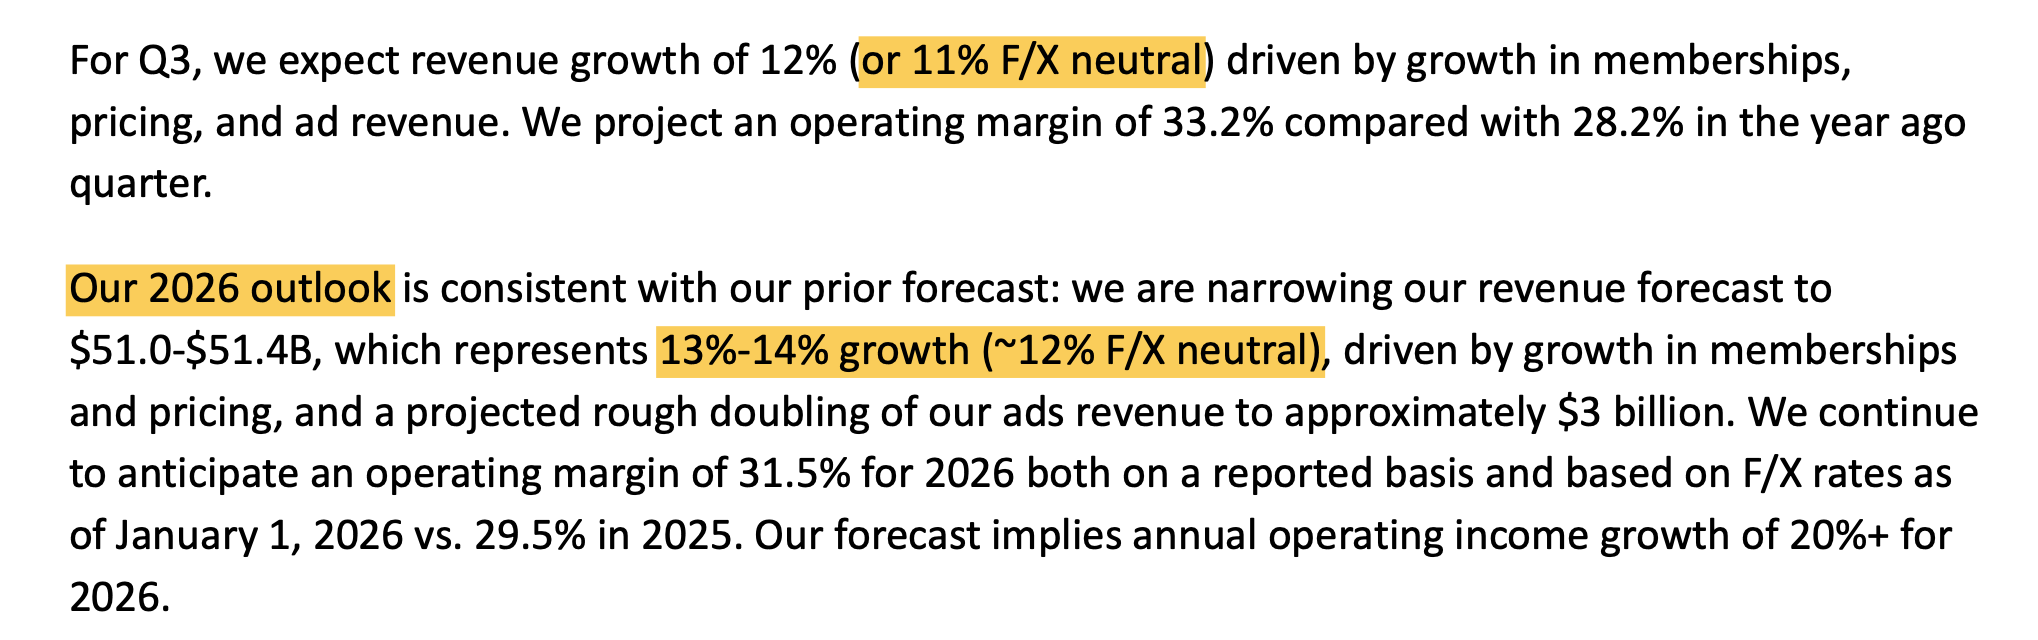
Netflix narrowed its full-year revenue guidance to $51.0 to $51.4 billion and has stopped reporting quarterly subscriber counts altogether. Management is asking to be judged on revenue and operating profit rather than unit additions, which is a defensible position for a business at this stage and also removes the metric investors had been using to check the thesis. You now have to trust the monetization narrative or find another way to verify it.
The second is the margin inflection. Content expense is growing around 10% this year while revenue grows 13%, and when your largest cost line rises slower than your topline, operating leverage kicks in. That 33.4% print suggests the structural leverage is arriving on schedule. Push that dynamic out several years and margins in the high thirties become a reasonable base case rather than a bullish stretch.
The third is advertising, which is doing more work than the market gives it credit for. Ad revenue should hit roughly $3 billion in 2026, about double last year, and management estimates it now accounts for around a quarter of incremental revenue growth.
“This year going from $1.5 billion of ads revenue last year to $3 billion this year and you look at our overall revenue guidance, which is plus or minus $6 billion of incremental revenue growth year-over-year, that puts ads at about a 25% contributor to growth. So we’re delivering more balanced growth across all of those, and that’s what we’ve really been building to, and that’s playing out in the business.“ - March Q&A at Morgan Stanley Technology
The ad tier passed 250 million monthly active viewers by May. Three years in, Netflix has built an advertising business the size of a mid-cap media company almost from scratch.
The fourth is an underrated development of the past year. In June, Netflix went live in France with a full integration of TF1, putting a national broadcaster’s linear channels and on-demand catalogue inside the Netflix interface. Combine that with an expanded NFL slate, WWE, MLB and the 2027 FIFA Women’s World Cup, and you can see the outline of something larger than a subscription service. Netflix is positioning itself as the operating system for television, the layer through which everything else gets watched.
Fifth, total view hours grew just 2% in the first half, to 97 billion, and hours per member are declining as the subscriber base expands faster than aggregate viewing. Management’s response is that not all hours are equal, that they’re optimizing for “moments of truth” and high-value fandoms, and that internal engagement-quality metrics are at all-time highs. Maybe. Netflix also announced it will move engagement reporting from semi-annual to annual starting in 2027, which is an awkward moment to reduce disclosure on the metric under the most scrutiny.
“there is not a linear relationship between view hours and revenue and profit because all hours are not created equal. All hours don’t provide the same kind of value to the business. And a really great example of this is live programming. So live events do a lot of lifting for us for acquisition. They’re good for monetization. They drive ad revenue, fandom. They’re also a promotional platform, but they do not yield typically as many Raw view hours. So live, we expect will be 5% of our content budget this year, but we think that will only be 1% of view hours. Having said that, 6 out of top 10 new member sign-up days over the past 5 years have come from live events. And if you compare that to another content category, take animation series, kids family TV, it’s also about 5% of our content spend, so the same amount of spend, but it’s going to drive, we expect 8% of view hours. So same spend and 8x the Raw view hours. You can see the differences there, even though because as indicated by the amount that we’re investing in both those categories being the same, we think they’re doing the same value for the business. So we’re constantly looking to improve across every dimension of engagement. We look at these as 3 dimensions: quality, variety, quantity, because they, taken collectively, drive acquisition, they drive retention, they drive the value that our consumers and our advertising partners ascribe to our service. We described in the last few earnings calls the progress that we’ve made on quality over the years. We’re not going to go into the details of that quality metrics because, frankly, it’s taken years for us to develop it and vet it and assess it and improve it, and we think that those details are a competitive advantage. We’re also continuing to expand the variety of our entertainment offering. You see us launch new types of content like live, like video podcast, cloud TV games. Those are all doing things, different things in our portfolio to support different needs from our members. And then on quantity, view hours grew 2% in the first half of 2026. That’s an incremental 1.5 billion hours relative to the same period last year. It’s a slight acceleration compared to 1.5% growth in 2025. And just to be very clear, like all those other dimensions, we remain focused on continuing to grow that number. And better understanding how we are doing at delivering member value, member love is critical to our business.“ - Q2 Call
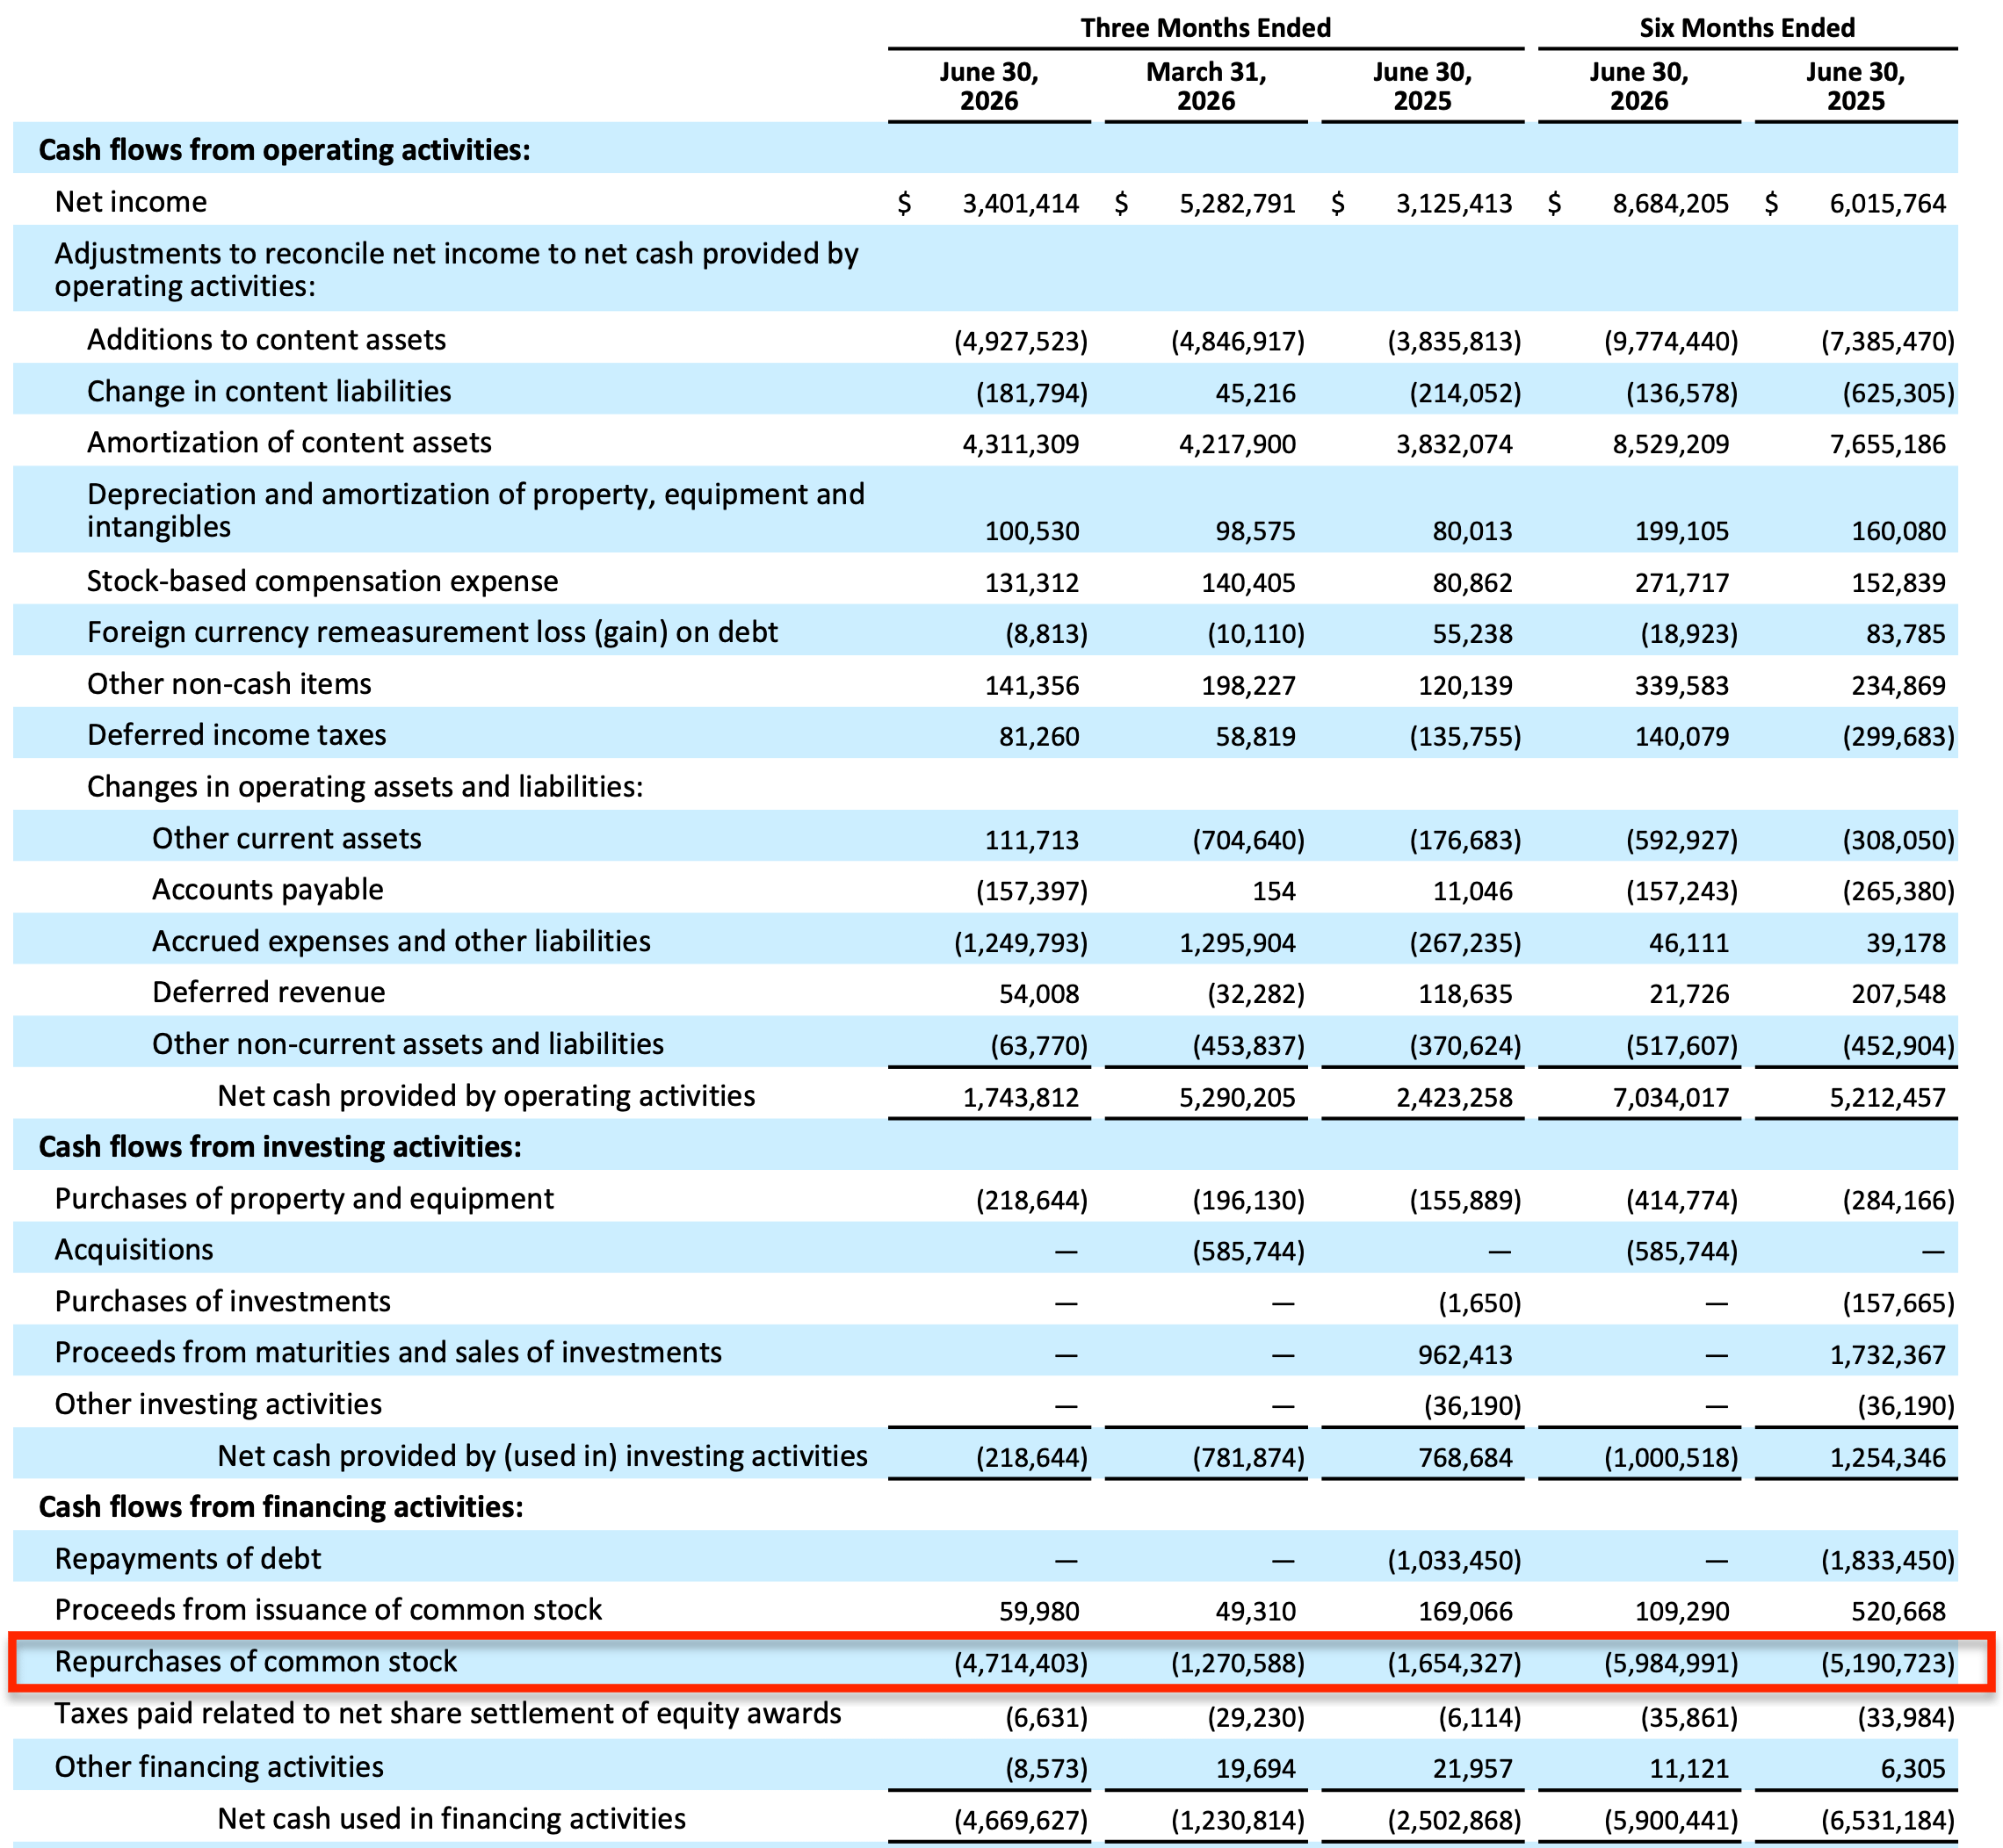
Sixth, while the market was busy selling the stock in recent months, Netflix repurchased $4.7 billion of its own stock in Q2, the largest buyback quarter in company history, with $27.1 billion of authorization still available. At the current market cap, that single quarter retired about one and a half percent of the company. Management is voting with the balance sheet.
2) TAM Analysis & the Size of the Prize
Before I discuss specific inputs of my valuation model, I want to know whether the runway is a runway or a cul-de-sac.
With Netflix trading around $69 after a drawdown that lopped roughly 50% off the June 2025 high and took the market cap down to about $290 billion, that question stopped being academic. The market has repriced this business. My job is to work out whether it repriced the growth story or just the sentiment attached to it.
Management’s own framing puts the addressable revenue market for the countries and categories Netflix currently operates in at roughly $670 billion as of 2026.
“It’s roughly 800 million addressable households. We’re capturing, we think, just 7% of addressable revenue market. It’s about $670 billion of addressable revenue in the countries and categories in which we operate today. And we estimate that we’re only about 5% of TV view share globally. So we’re delivering on our 2026 plan, and we believe we’ve got lots and lots of runway for solid growth ahead of us.“ - Q2 call
Against that, Netflix will do somewhere between $51.0 and $51.4 billion in revenue this year, per the narrowed full-year guidance issued alongside Q2 results.
Do the arithmetic, and you get a company capturing about seven percent of the pie it says it is competing for.
There is a top-down approach and a bottom-up approach to sizing a market, and Netflix conveniently gives you both.
The top-down version is the cited $670 billion figure. You take global consumer and advertising spend across the entertainment categories Netflix plays in, across the geographies where it operates, and you call that the ceiling. Top-down numbers are seductive and slippery. They flatter the company presenting them, because the definition of “category” is elastic. Treat any top-down TAM as an upper bound on ambition rather than a forecast.
The bottom-up version is more useful to me. Management identifies roughly 800 million addressable households worldwide with broadband internet and a smart TV. That is a physical, countable constraint. Build the model from there and you can multiply households by realistic penetration by realistic ARPU, and you end up with a revenue number you can actually defend in front of someone who disagrees with you.
Against that 800 million, Netflix, with its 325 million paid members, sits at less than 45% penetration.
“Perhaps I can kick this one off and just sort of step back and do a little bit of high-level framing. […] Now we ended last year with more than 325 million paid members. And as that number continues to grow, we are entertaining an audience that is approaching 1 billion people, which is an exciting milestone to strive for, and it will be an exciting milestone to achieve.
But even given that number, we still have plenty of room to grow into our addressable market. So if you look at it from an addressable household perspective that have good data, that have a smart TV, all those things that we think are enabling, we’re still under 45% penetrated in terms of that number. We think that number is roughly 800 million, and it grows every year, obviously. We’ve captured about 7% of addressable revenue. This is countries and categories that we currently directly participate in.“ - Q1 call
The TAM Is Growing!
But that TAM is growing. Underneath all of this sits one secular trend that has been running for fifteen years and shows no sign of exhausting itself: consumer time and money are migrating from linear and broadcast television to internet-delivered, on-demand streaming.
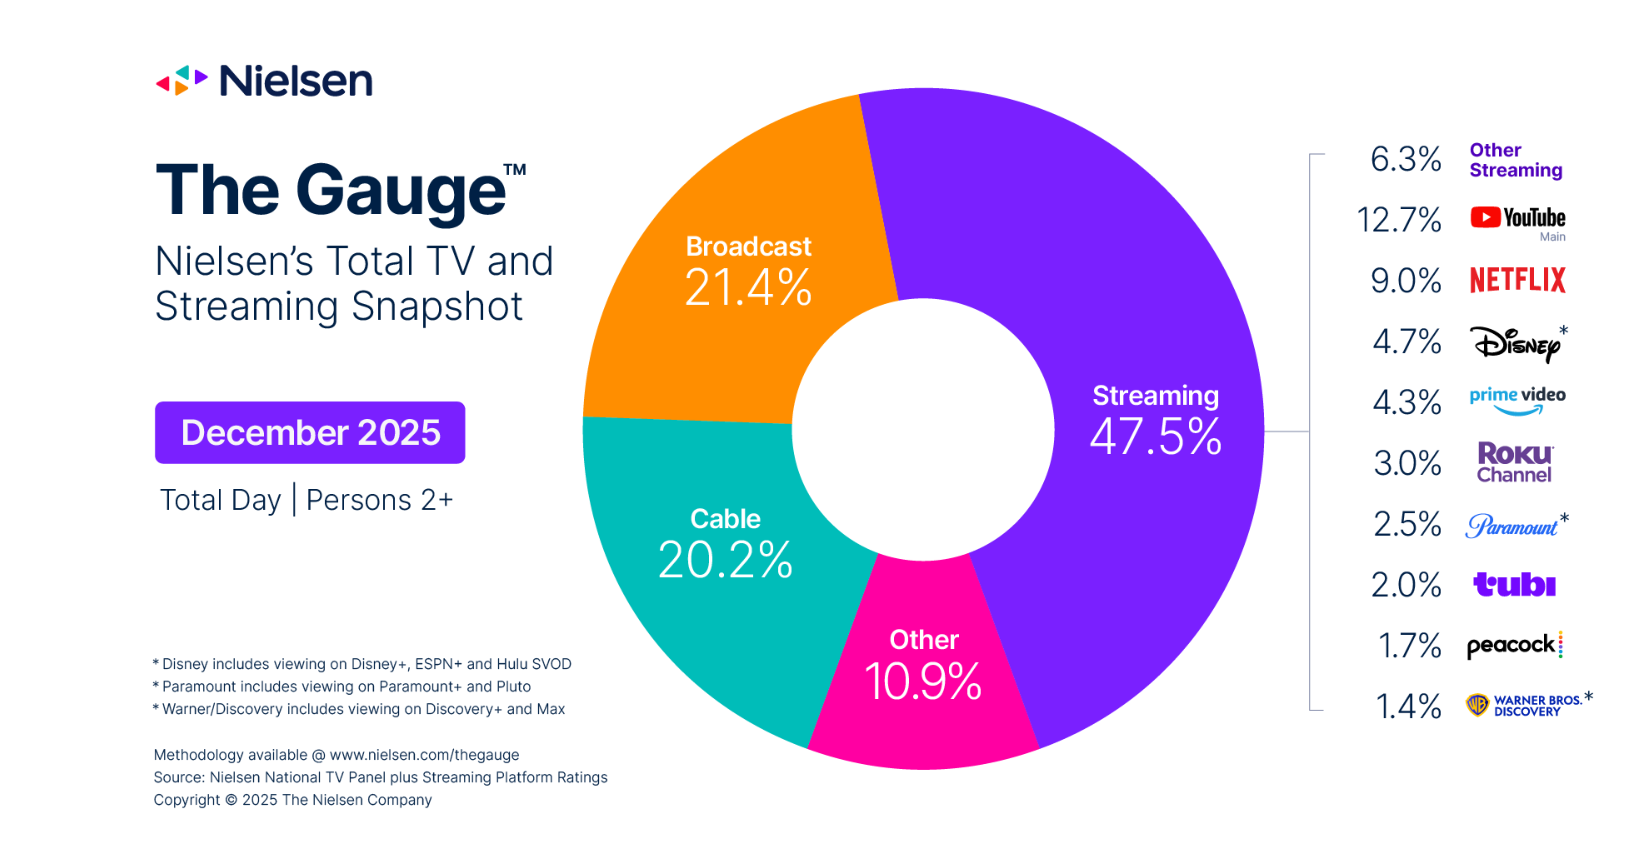
Nielsen’s Gauge had total streaming above 47% of US TV viewing through the first months of 2026, setting records along the way. Linear keeps bleeding. Streaming keeps taking share.
That is the tide Netflix has been swimming with since 2007, and it is the single most important reason the pie itself keeps growing rather than merely being redistributed.
Netflix accounts for an estimated 5% of total TV view share globally, and even in its strongest markets it holds under 10% of TV time. In the US, Nielsen had Netflix hovering around 8 to 9% of total TV viewing while YouTube sat at 12.7% and pushed to 13.5% by March.
TAM is a fantasy number until you subtract the parts of the world Netflix cannot reach, which is what the serviceable available market is for.
Start with geographic constraints: Netflix operates in over 190 countries, which sounds like everywhere until you notice the absence of China. That single exclusion removes several hundred million broadband households and an enormous pool of entertainment spend from anything Netflix can realistically address, and there is no scenario I find credible in which that changes on an investable time horizon.
Then come the regulatory constraints, which are less dramatic and more corrosive. Under the European Union's updated Audiovisual Media Services Directive (AVMSD), video-on-demand and streaming platforms operating within the EU are legally required to ensure that at least 30% of their content catalogue consists of European works, and several member states layer investment obligations on top, effectively taxing revenue back into local production. France, Italy and Spain have all pushed in this direction. These rules don’t block Netflix from operating. But they make operating more expensive, and they compress the margin the company can extract from a given euro of European subscription revenue.
What defines the SAM on the positive side is capability. Netflix produces content in over 50 countries, which is not marketing fluff but the operational reason a Korean thriller or a Spanish heist series can become a global hit and amortize across the entire subscriber base.
And the Open Connect content delivery network, the proprietary infrastructure Netflix embeds inside ISPs around the world, is why the service streams acceptably in markets where the broadband is mediocre.
Both of these are genuine structural advantages of the business. Both took a decade and billions of dollars to build. Neither is easily replicated by a competitor deciding tomorrow that it wants to go global.
In summary, Netflix CEO Ted Sarandos has said the goal is to get better faster than the competition. The TAM is large and growing, and depending on how you look at it, Netflix’s penetration is still quite low. The management track record is excellent. None of that guarantees Netflix captures more of the pie, but Netflix is certainly in a great spot to do so.
3) Growth Drivers & What Growth Rate Can You Actually Underwrite?
There was a version of Netflix that grew very quickly because more people signed up (20% YoY growth rates between 2015 and 2020). That version is gone.
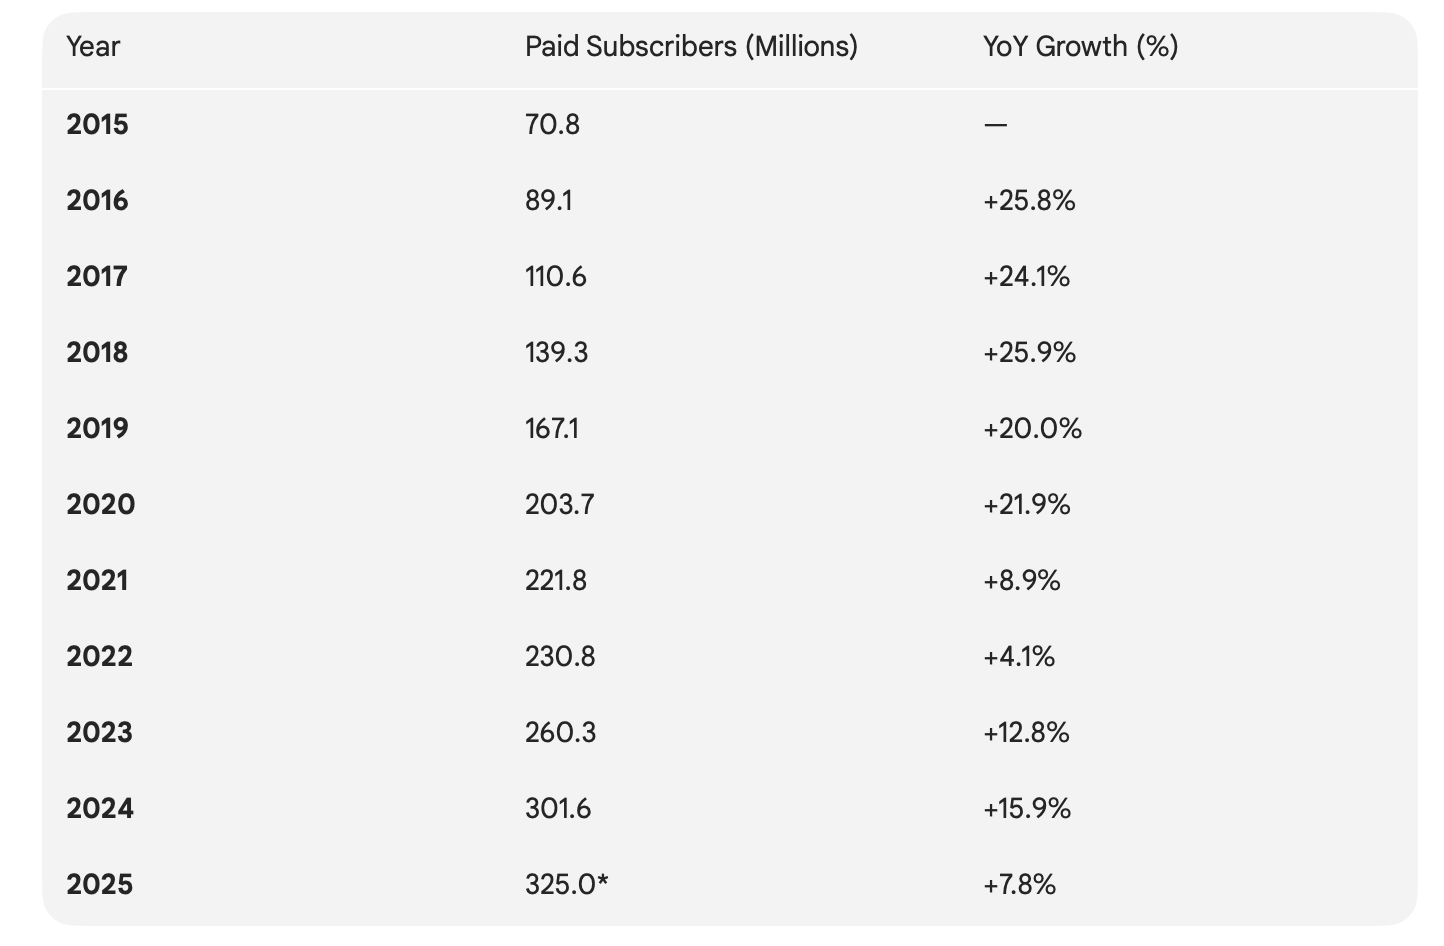
What replaced that key growth driver, what replaced a business growing primarily via subscriber growth, is a business that grows because it extracts more revenue from a base that is already enormous, and the two models have completely different risk profiles.
Subscriber-led growth is volatile and visible. Monetization-led growth is steadier and considerably harder to observe from the outside, particularly now that Netflix has stopped handing you quarterly membership numbers (Netflix announced that it would stop reporting quarterly paid subscriber counts and Average Revenue per Membership (ARM) starting in Q1 2025).
Management guided full-year 2026 revenue to $51.0 to $51.4 billion, which works out to 12 to 14% growth. Q2 landed at $12.6 billion, up 13%, and the Q3 guide of $12.86 billion implies 12%. Consensus has revenue compounding at roughly 10% annually through 2032.
Anyone modeling twenty is dreaming, and anyone modeling five is ignoring the ad business.
What I want to do here is take that growth apart, assign contribution ranges to each piece, and then stress-test whether the pieces actually add up.
Where Future Growth Is Going to Come From
I’ve identified four key growth drivers (assumed growth rate range over the next five years):
A) Membership Growth (4-5%):
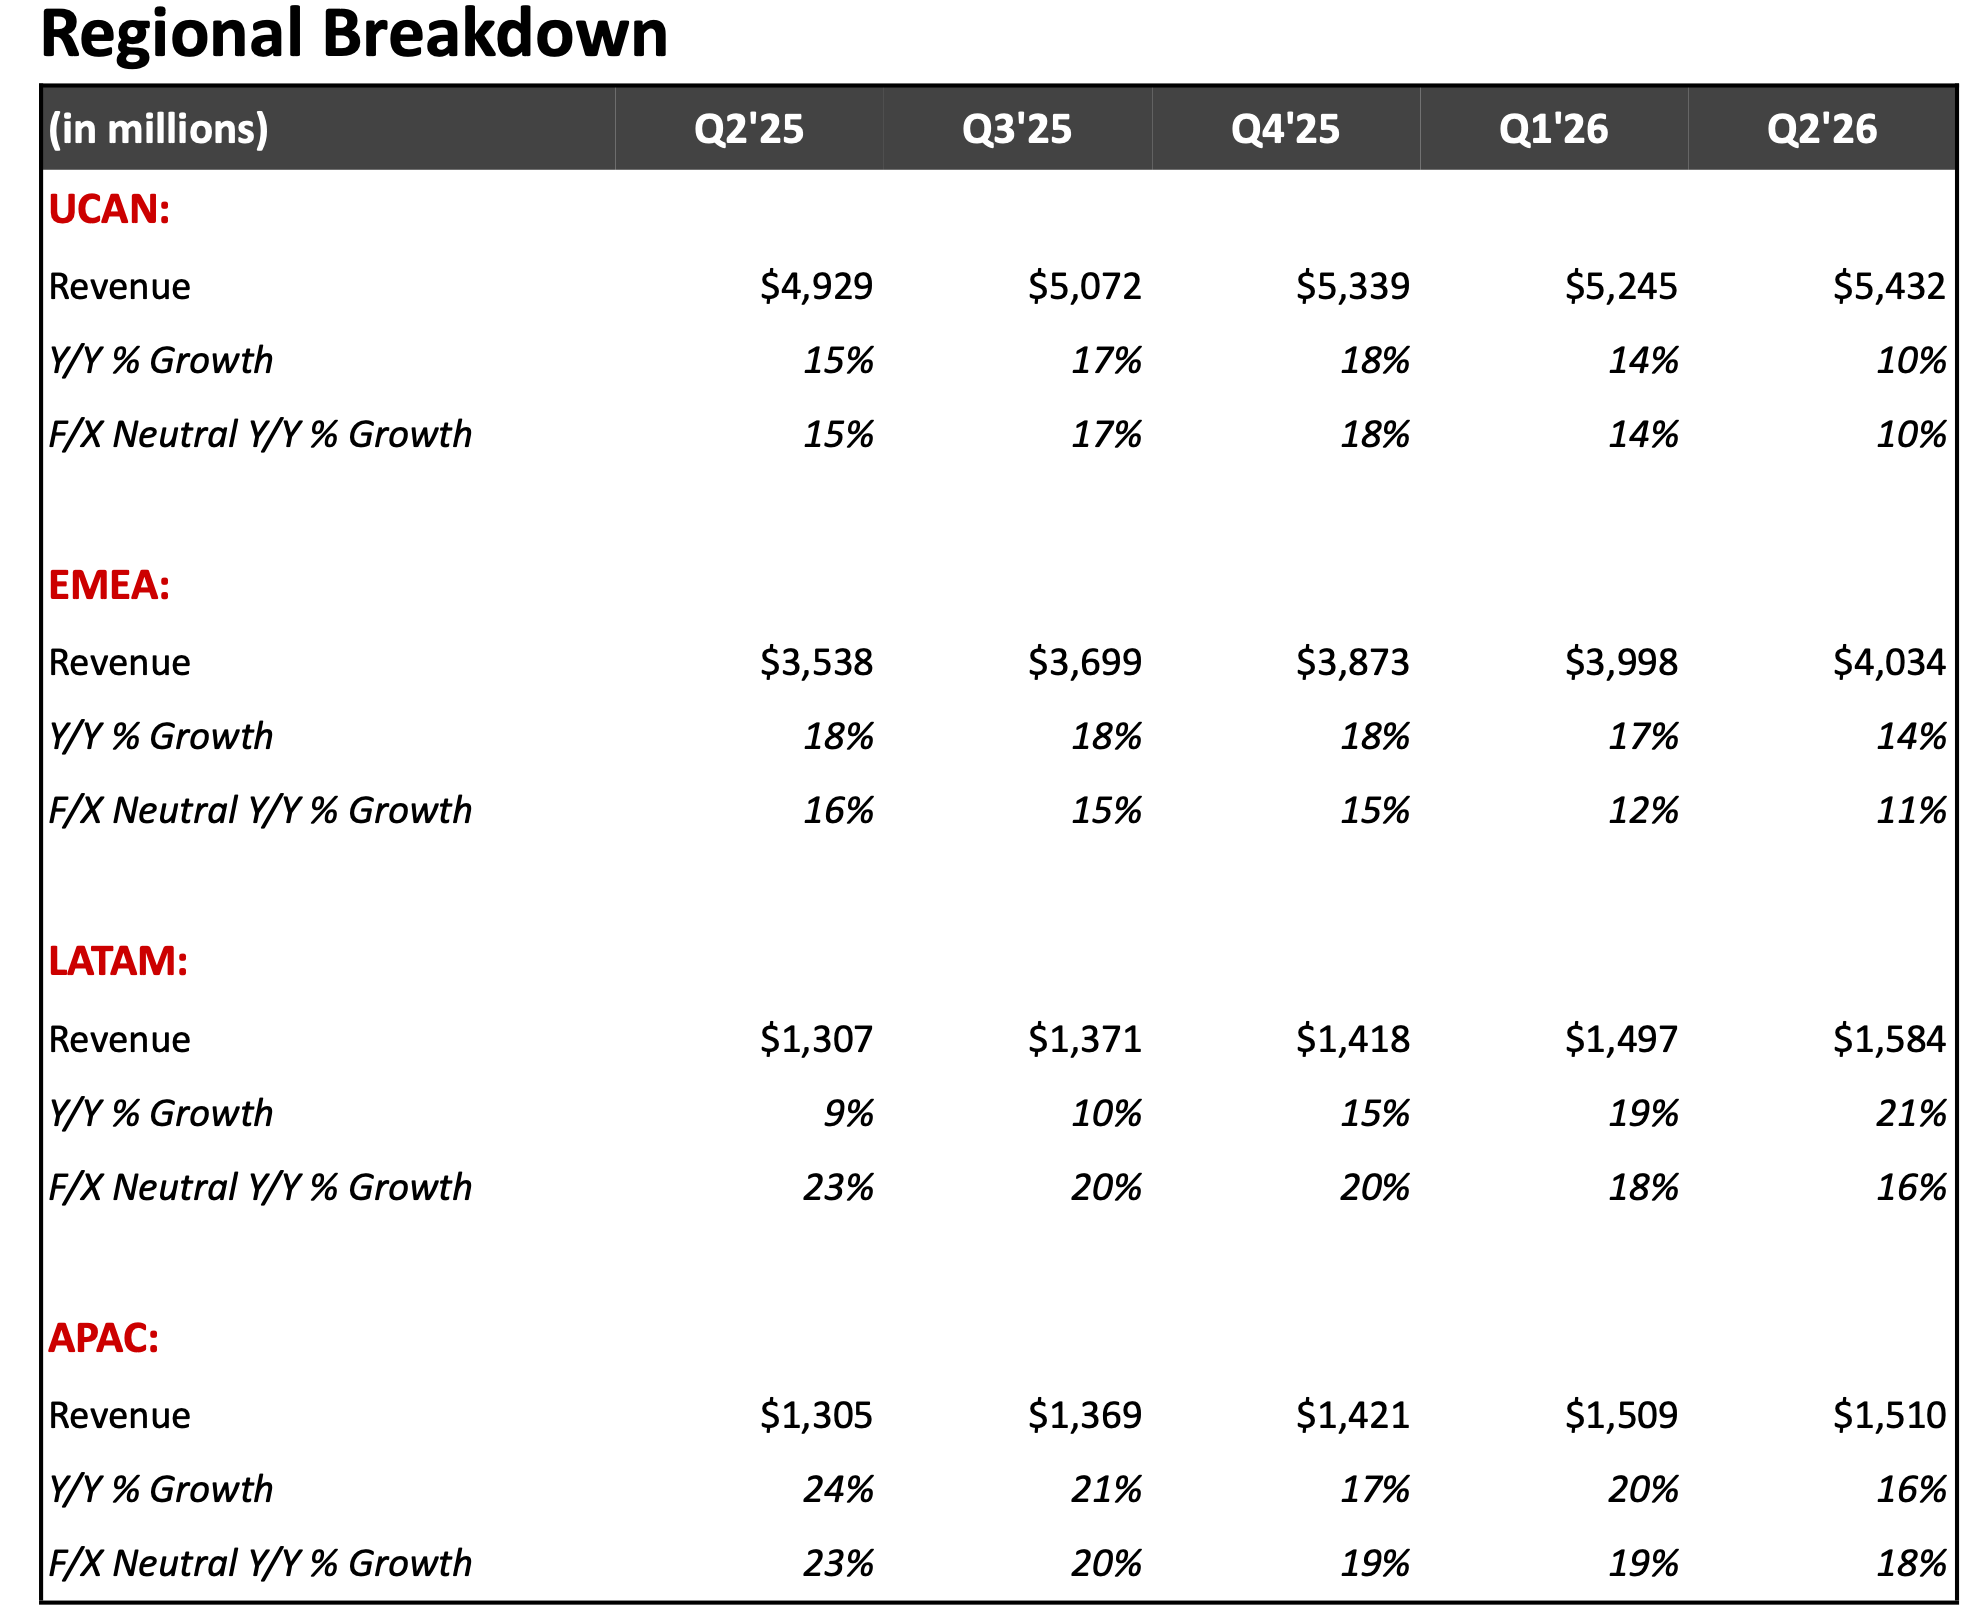
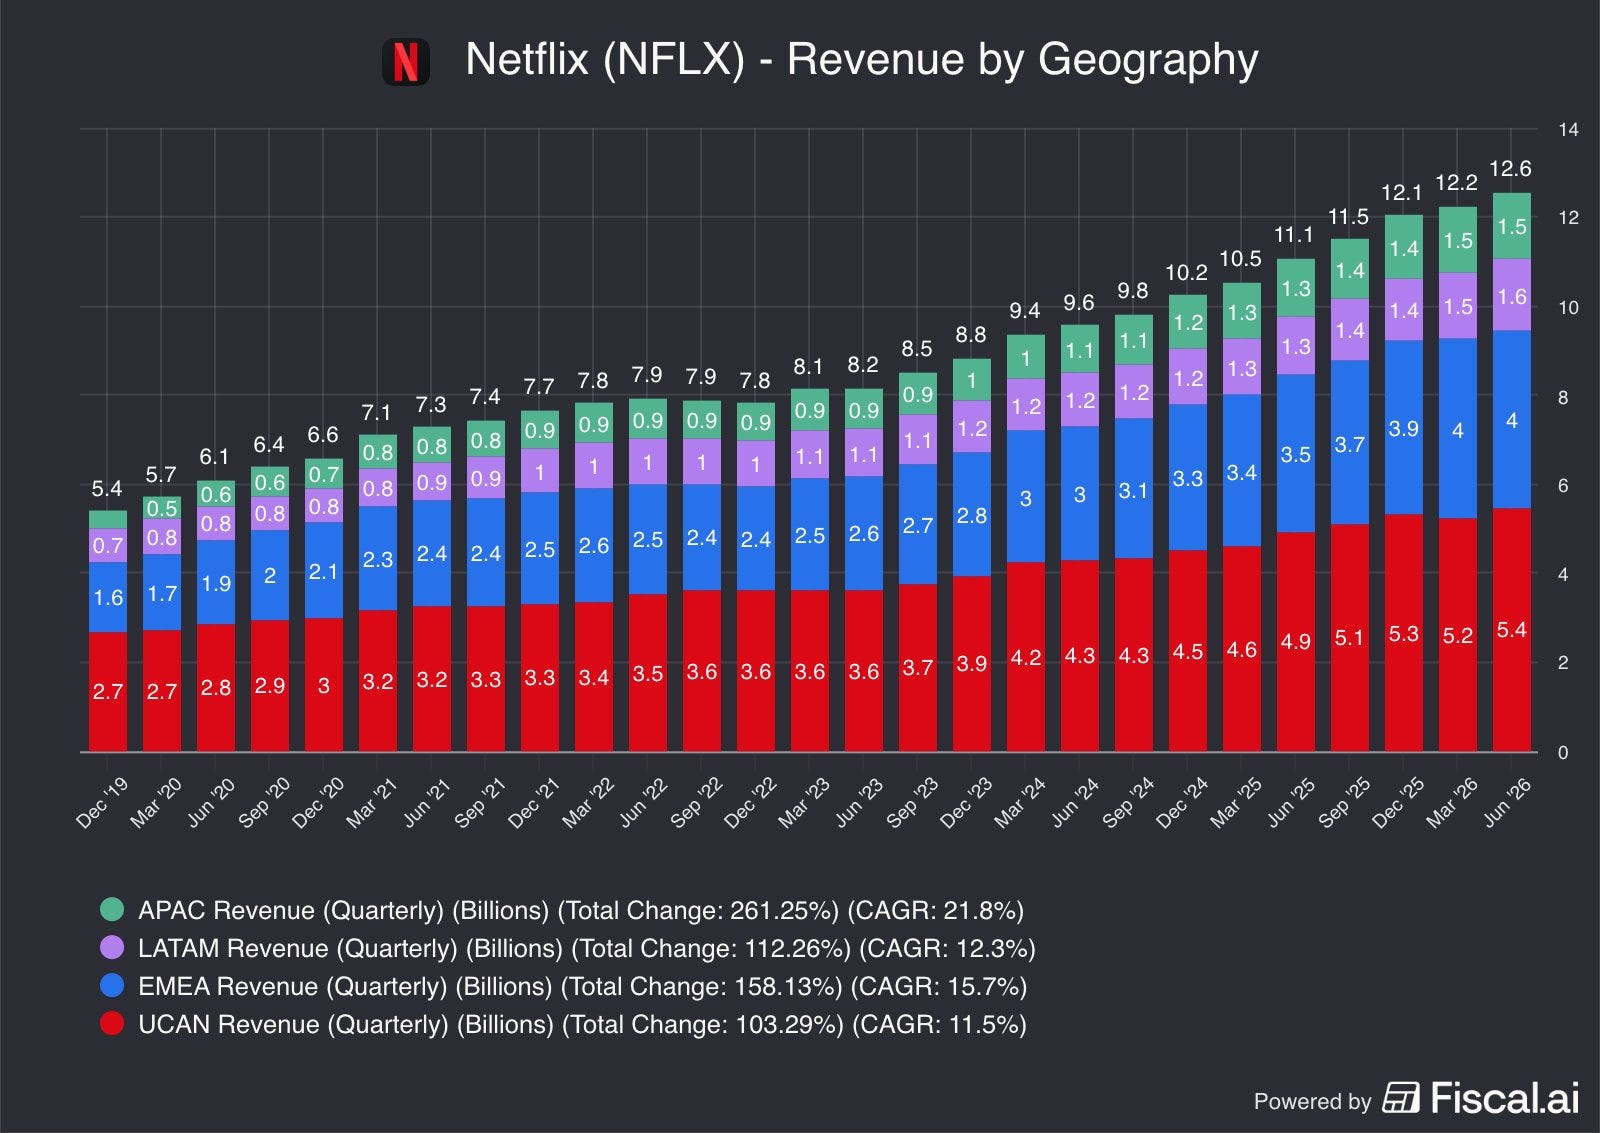
As discussed, Netflix remains under 45% penetrated against roughly 800 million addressable broadband households, and while the US and Canada are close to saturated, Japan and the wider APAC region still have meaningful headroom.
Now you might want to push back on my conservative 4-6% estimate. Afer all, the 2015-2025 CAGR was 16.5%.
But that decade contains two non-repeatable events. Look at the sequence in the table above: growth collapses to 8.9% in 2021 and 4.1% in 2022, then jumps back to 12.8% and 15.9% in 2023-24. That reacceleration was the paid-sharing crackdown, and it was a harvest rather than an acquisition. Netflix converted people who were already watching. You can only drain that inventory once, and 2025’s 7.8% is what the business looks like afterward.
Then there’s base arithmetic. In 2016, +25.8% meant 18M adds. Today 5% means 16M adds, so Netflix has to do more absolute work for a far smaller percentage. Sustaining 8% for five years takes the base from 325M to 477M, which is 60% of the entire 800M addressable household universe.
So maybe Netflix can grow members at 4-6% for the next two to three years, decaying to 2-4% by 2030-31, averaging roughly 4-5%.