

I recently came across a chart that Tiho Brkan shared with me, and it’s one of those charts that makes you stop and stare at in a state of genuine confusion. It is the kind of data visualization that creates an immediate sense of cognitive dissonance.
You know the feeling. It’s that mental grinding sound when two contradictory facts refuse to occupy the same space in your brain. Tiho sent me the charts already 2-3 weeks ago, and it stuck with me, and today I decided to write about it.
The chart in question is the ratio of Leading Economic Indicators (LEI) to Coincident Economic Indicators (CEI). It is a classic tool used by macro analysts to gauge where the economy is headed relative to where it actually is right now.
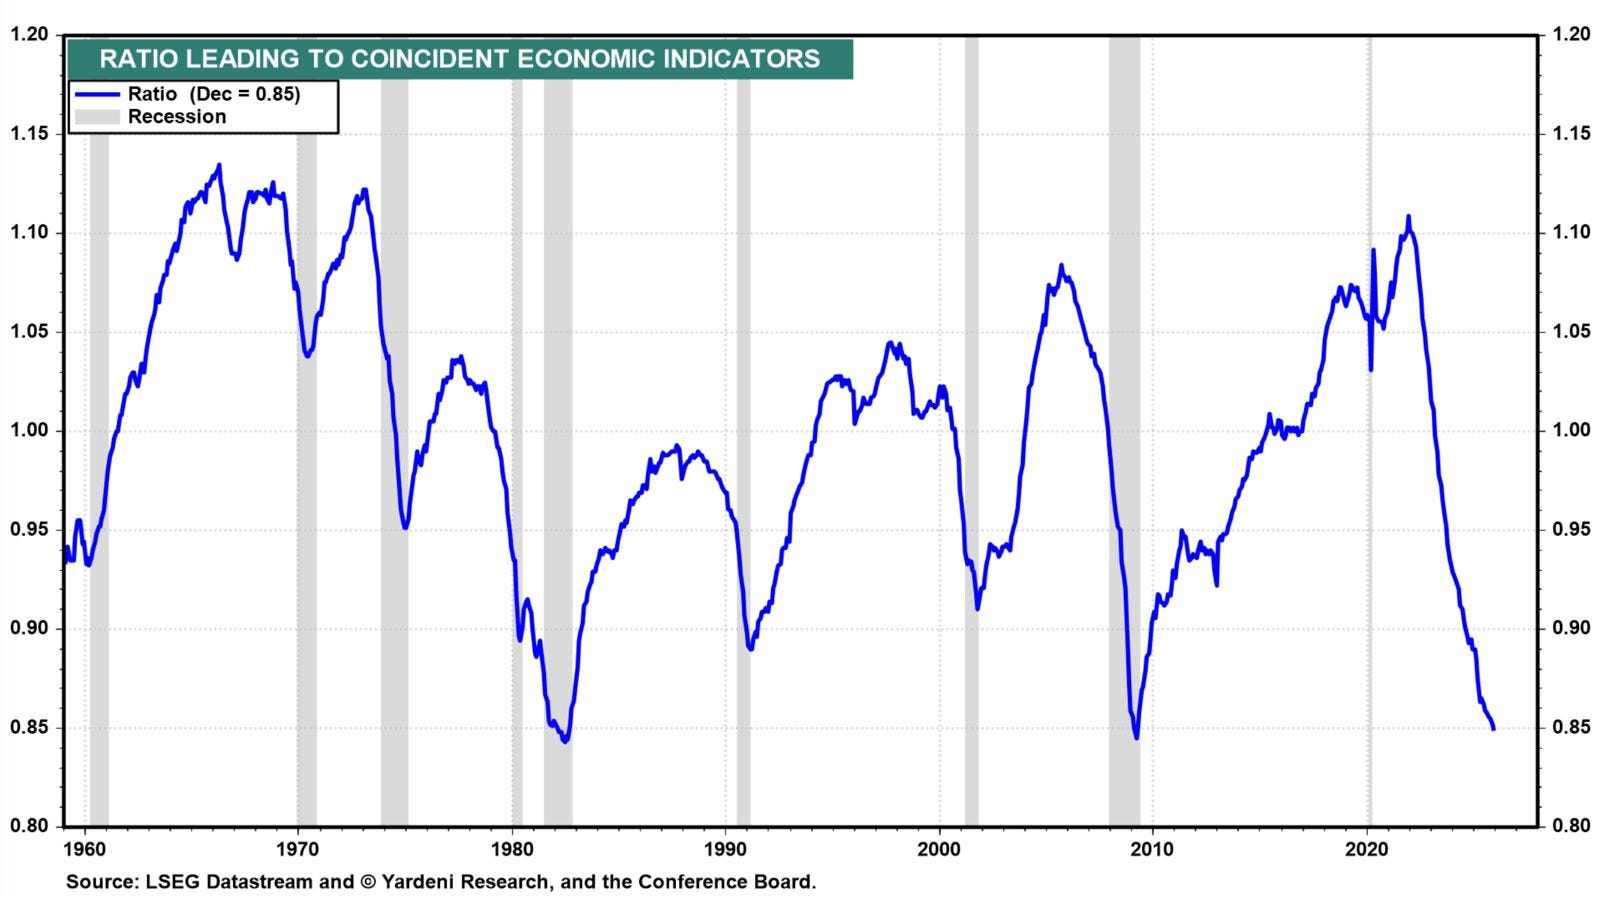
On a historical scale, the blue line representing this ratio is currently doing something that should, by all accounts, mean we are in the middle of a total economic collapse. The ratio has plummeted to levels not seen since 1982 and the depths of the 2009 Global Financial Crisis.
Those were not just regular market pullbacks. They were the absolute nadir of secular bear markets. They were moments when the financial world felt like it was ending.
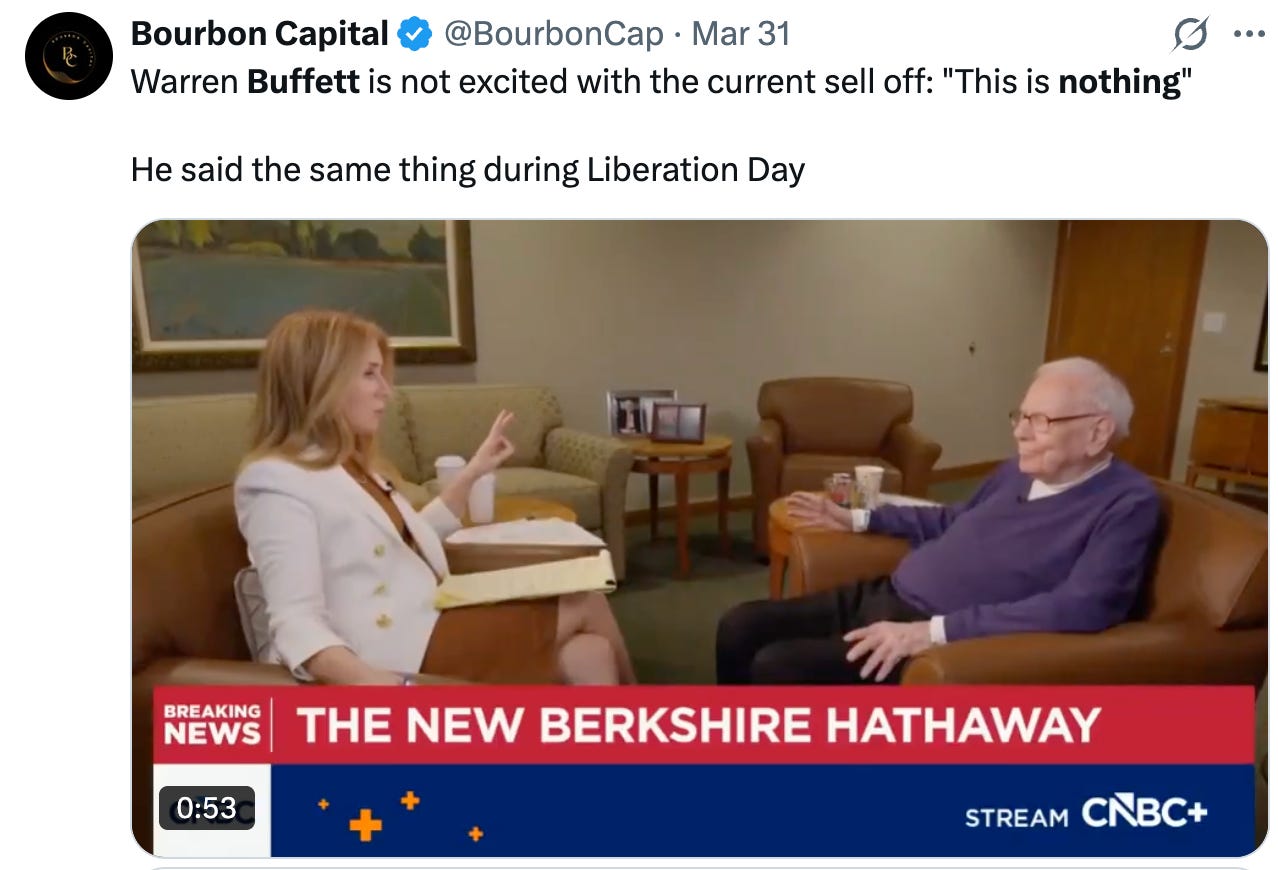
The current environment does feel like this at all. And when you start looking at cold, hard data, that hunch is confirmed. As I write this, the S&P 500 is not in a state of collapse. Far from it. Sure, we’re experiencing some serious geopolitical turmoil, but as Buffett just said in yesterday’s CNBC interview, “this is really nothing.”
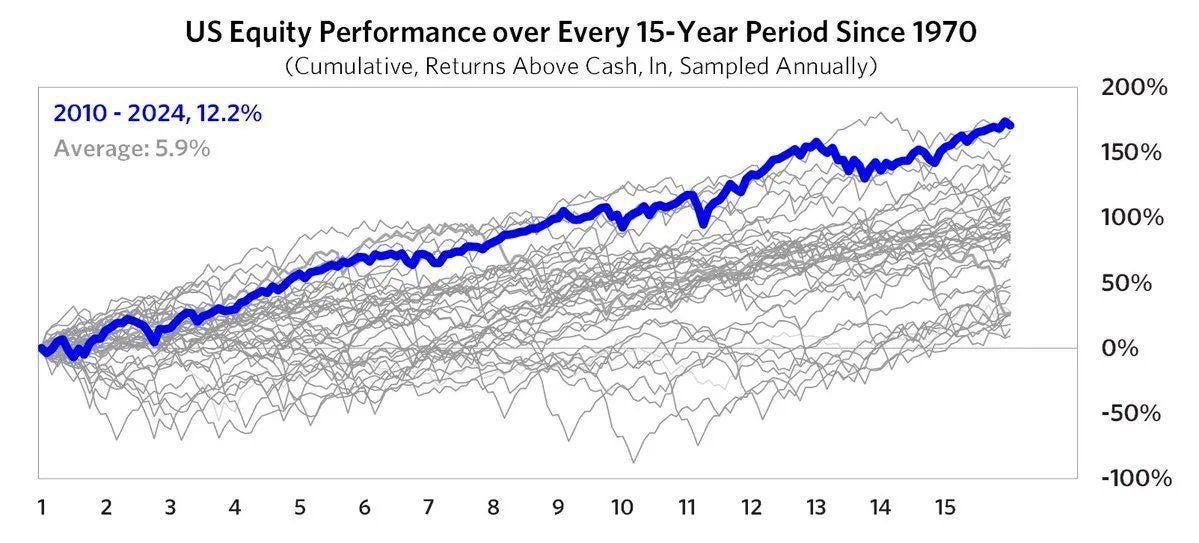
We have just witnessed a seventeen-year period of equity performance (with a few minor bumps in 2011, 2018, 2020, 2022, and 2025) that ranks among the most lucrative in history. Consider this slightly dated chart below:
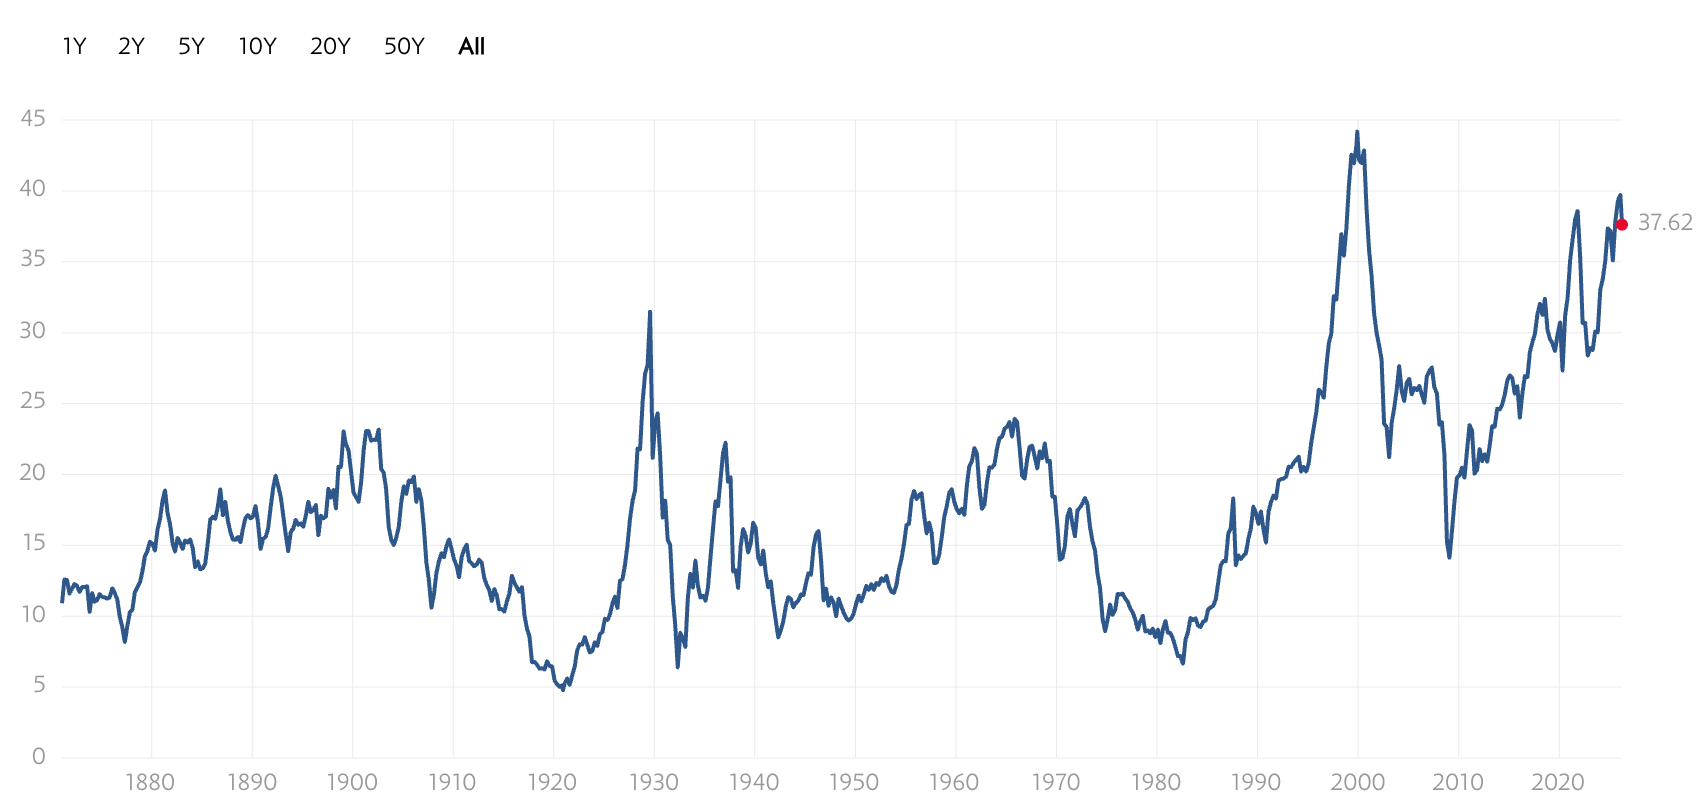
Prices are (still) high. Multiples are stretched. The contrast is jarring.
If we were to follow the “map” provided by this indicator (the Leading to Coincident ratio), we should be buying with both hands because we are at or close to a generational bottom. The scouts – the forward-looking data points like manufacturing orders, nonfarm payrolls (employment), and consumer sentiment – have already retreated to the bunkers. They are shouting that the bridge is out. Meanwhile, the main army – the actual earnings and productivity of the corporate world – is marching forward as if the sun will never set. This isn’t just a minor divergence.
It forces a difficult question. Is the economy actually a disaster that the stock market is simply refusing to acknowledge, or is the barometer itself broken?
Big shoutout again to Tiho here again who shared most of the ideas expressed in the post and I’m merely digesting his input.
The Historical Perspective
To understand why the current chart feels so urgent, we have to look back at the moments when this ratio hit the floor in previous decades. It is a rare occurrence. When you look at a forty-year timeframe, you quickly realize that the Leading to Coincident ratio does not just “dip” for no reason. It collapses when the forward-looking indicators – the scouts – see a canyon that the current economy – the main army – is about to march right into.
Historically, the most famous instances of this were in August 1982 and March 2009. In both cases, the ratio reached levels of absolute exhaustion.
In 1982, the American economy was being choked by Volcker’s interest rate medicine to kill inflation. The manufacturing sector was in shambles, and the leading indicators were screaming for mercy. But as the ratio bottomed, the S&P 500 embarked on a multi-decade expansion that changed the face of global finance. It was the “generational buy” of a lifetime, with the S&P doubling over the next few years.
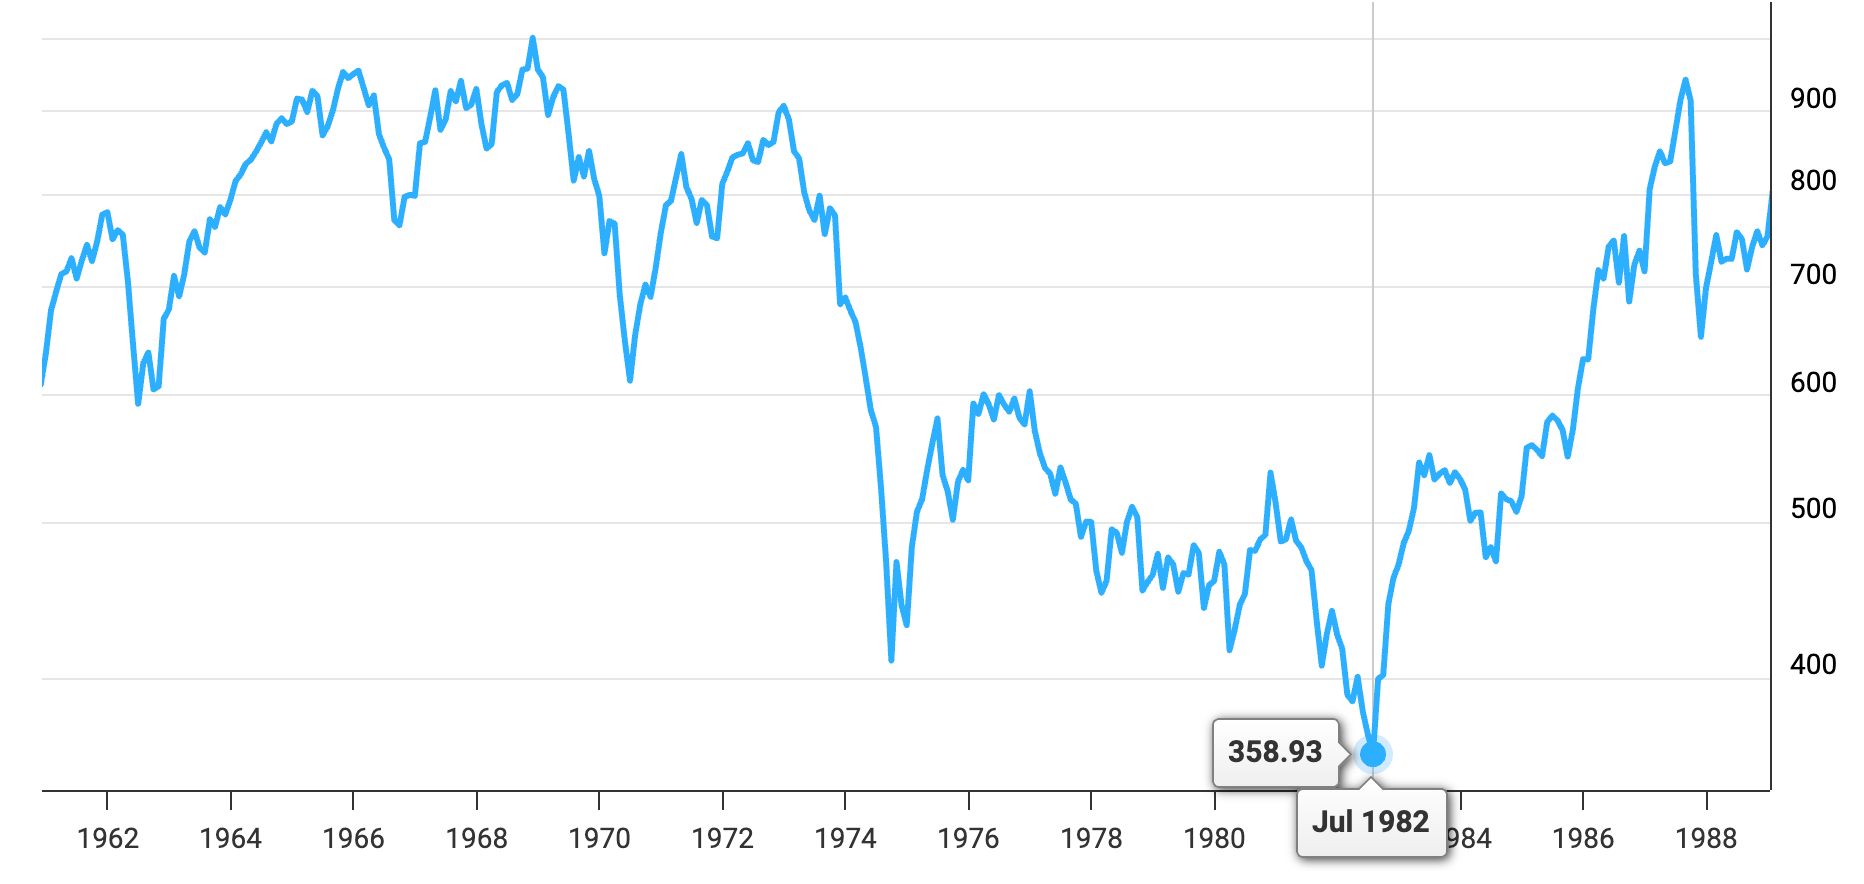
The story was nearly identical in 2009. The global financial system was literally being held together by duct tape and government liquidity. The ratio of leading to coincident indicators fell through the floor as orders vanished and credit froze. Yet, at that moment of maximum economic pain, the market stopped falling. It was a perfect signal.
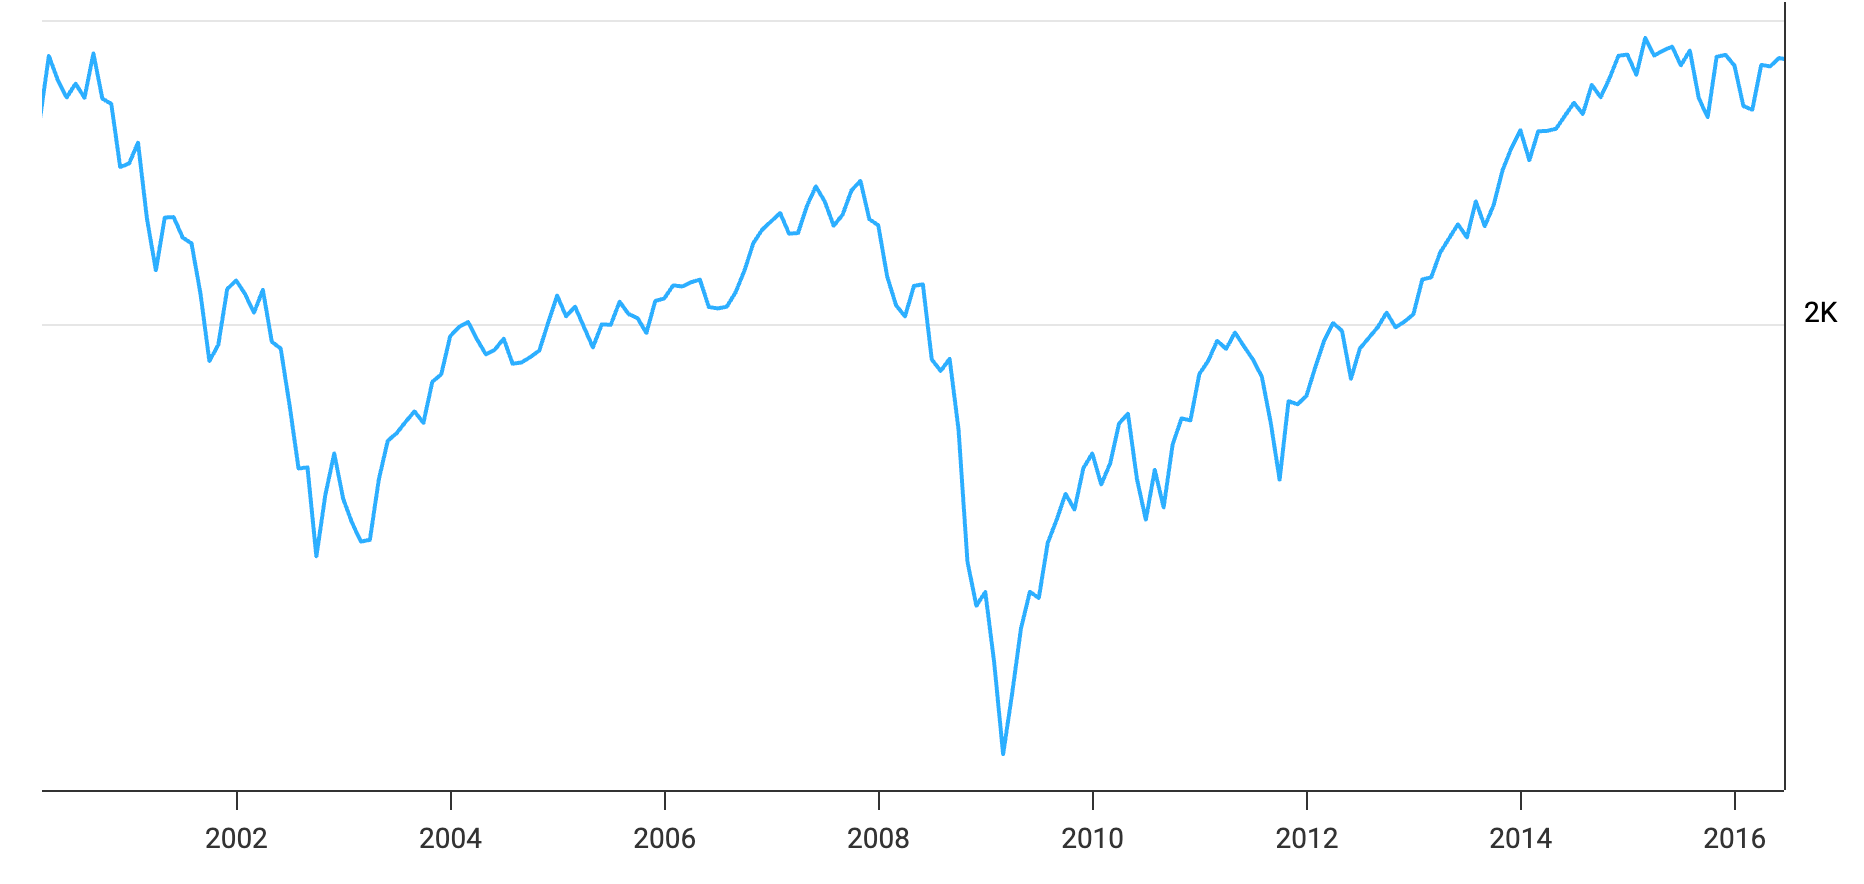
The indicators were telling us that the “badness” had been “priced in” and that any incremental change from that point forward would likely be positive.
When you look at those two dates and then look at the metric of the chart we discuss, you see an indicator that has worked with almost surgical precision in these two instances. Every time the scouts were this pessimistic relative to the current reality, it was time to back up the truck.
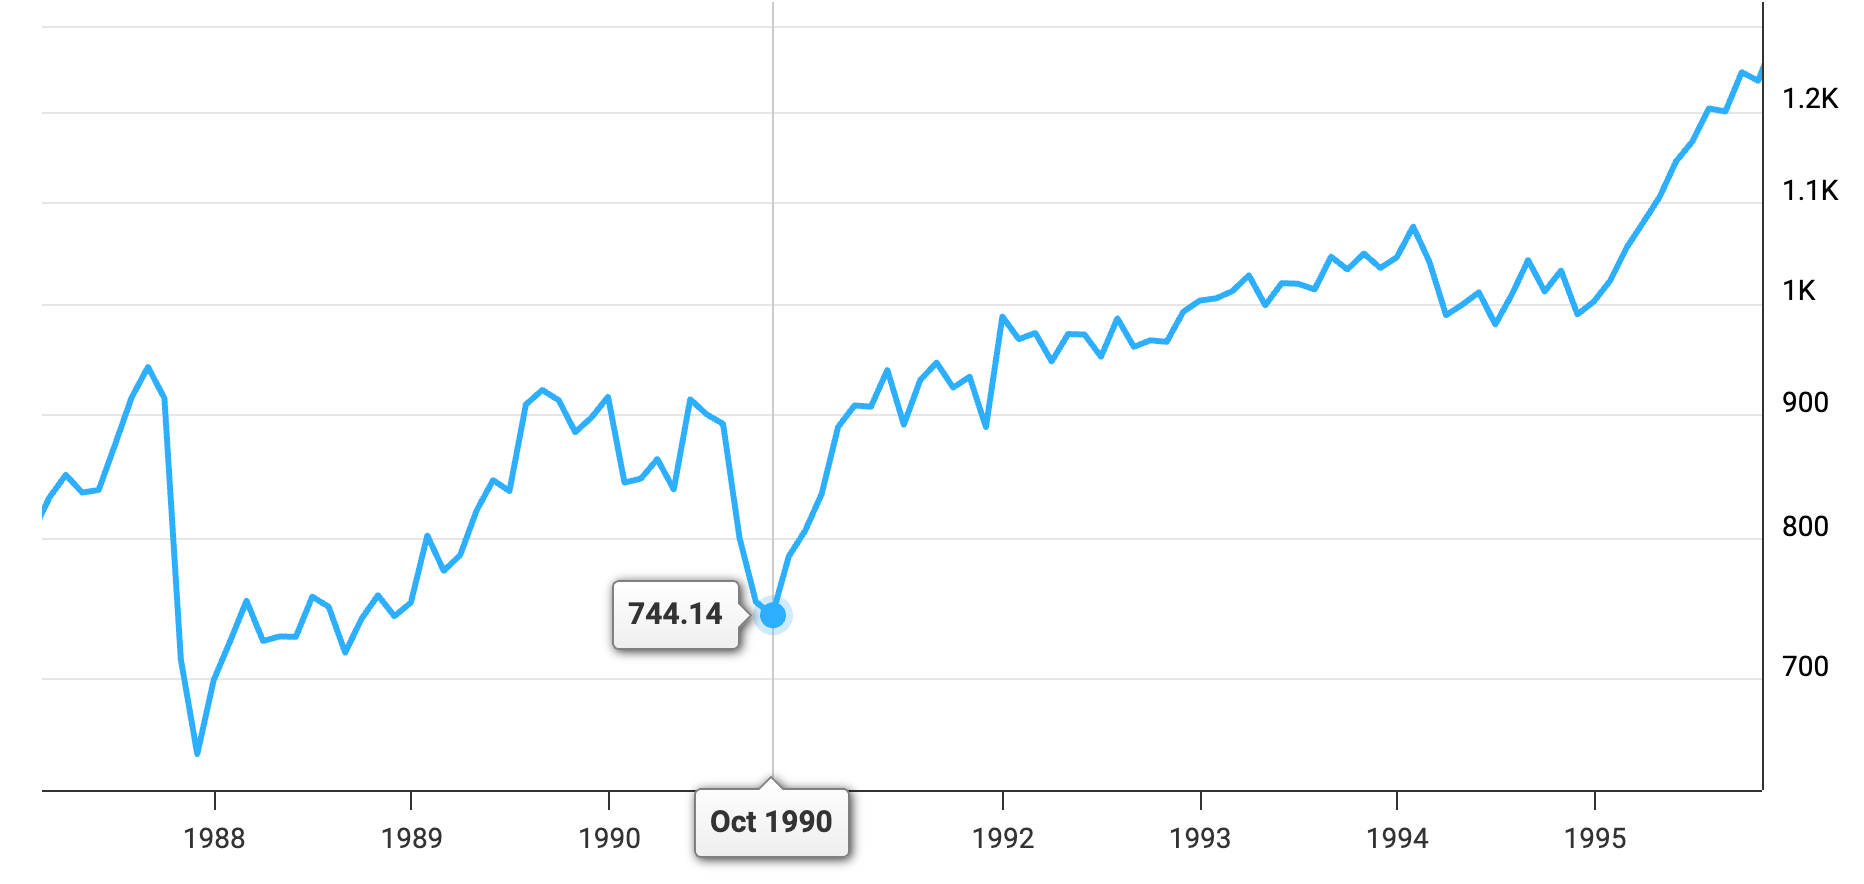
But we cannot just look at the secular bottoms. We have to examine the cyclical “growth scares” like 1990, 1998, 2011, and 2018, for instance. In 1990, the invasion of Kuwait and the subsequent spike in oil prices sent leading indicators into a tailspin, while employment (a coincident indicator) remained relatively sturdy for a while. The ratio dipped, signaled a recession, but the market bottomed a little earlier.
In 2011 and 2018, the ratio flinched, but it did not reach anywhere close to a “generational low” territory as we see today. These were periods where the market fell 20% or so, the ratio dipped, but the “army” of the economy never actually fell into a trench to stick with our metaphor.
Then there is the more recent history: 2020, 2022, and the “tariff bottom” of April 2025. In 2020, the lockdowns created a total disconnect because the “leading” data stopped existing overnight. But that was an exogenous shock. 2022 was more traditional. Inflation was rampant, and the Fed was aggressive. The ratio declined steadily as the market sold off. And just last year, in April 2025, when the first waves of the new administration’s tariff policies hit the wires, we saw another sharp contraction in the LEI components. Overall, we’re seeing more of a structural long-term decline in the indicator than major “dips” though.
This is where the history starts to get uncomfortable. If the ratio is at 1982 and 2009 levels, the “historical precedent” says the S&P 500 should be fifty percent lower than it is right now.
It says we could (or should?) be seeing mass layoffs, bankruptcies, and a total lack of hope. Instead, we are seeing still decent GDP growth (in the US at least) …
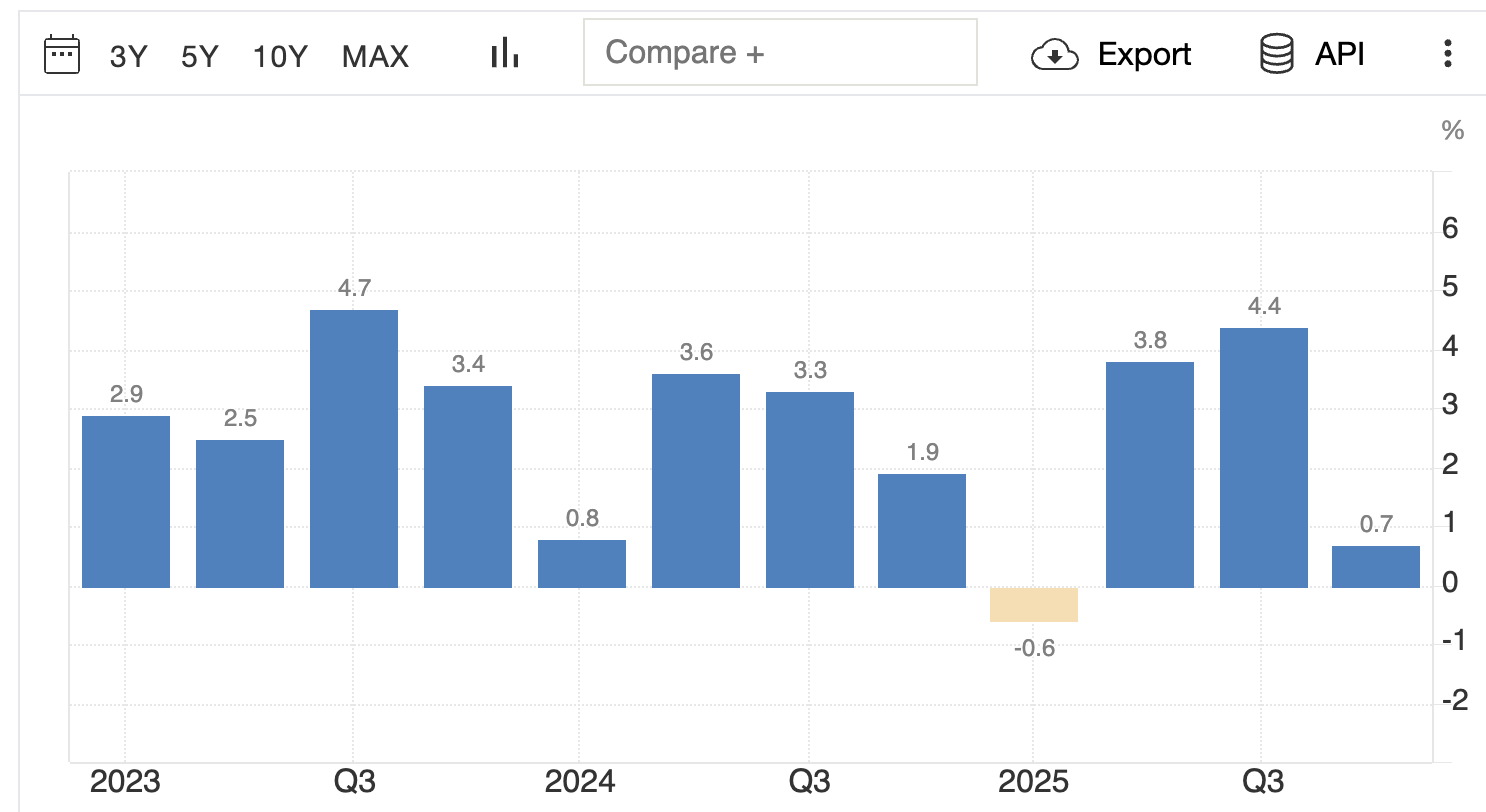
… and a stock market that looks like it is on a one-way trip to the moon. Sure, we’re down a bit this year, but if you look at the drawdown, Buffett’s right, this really is nothing!
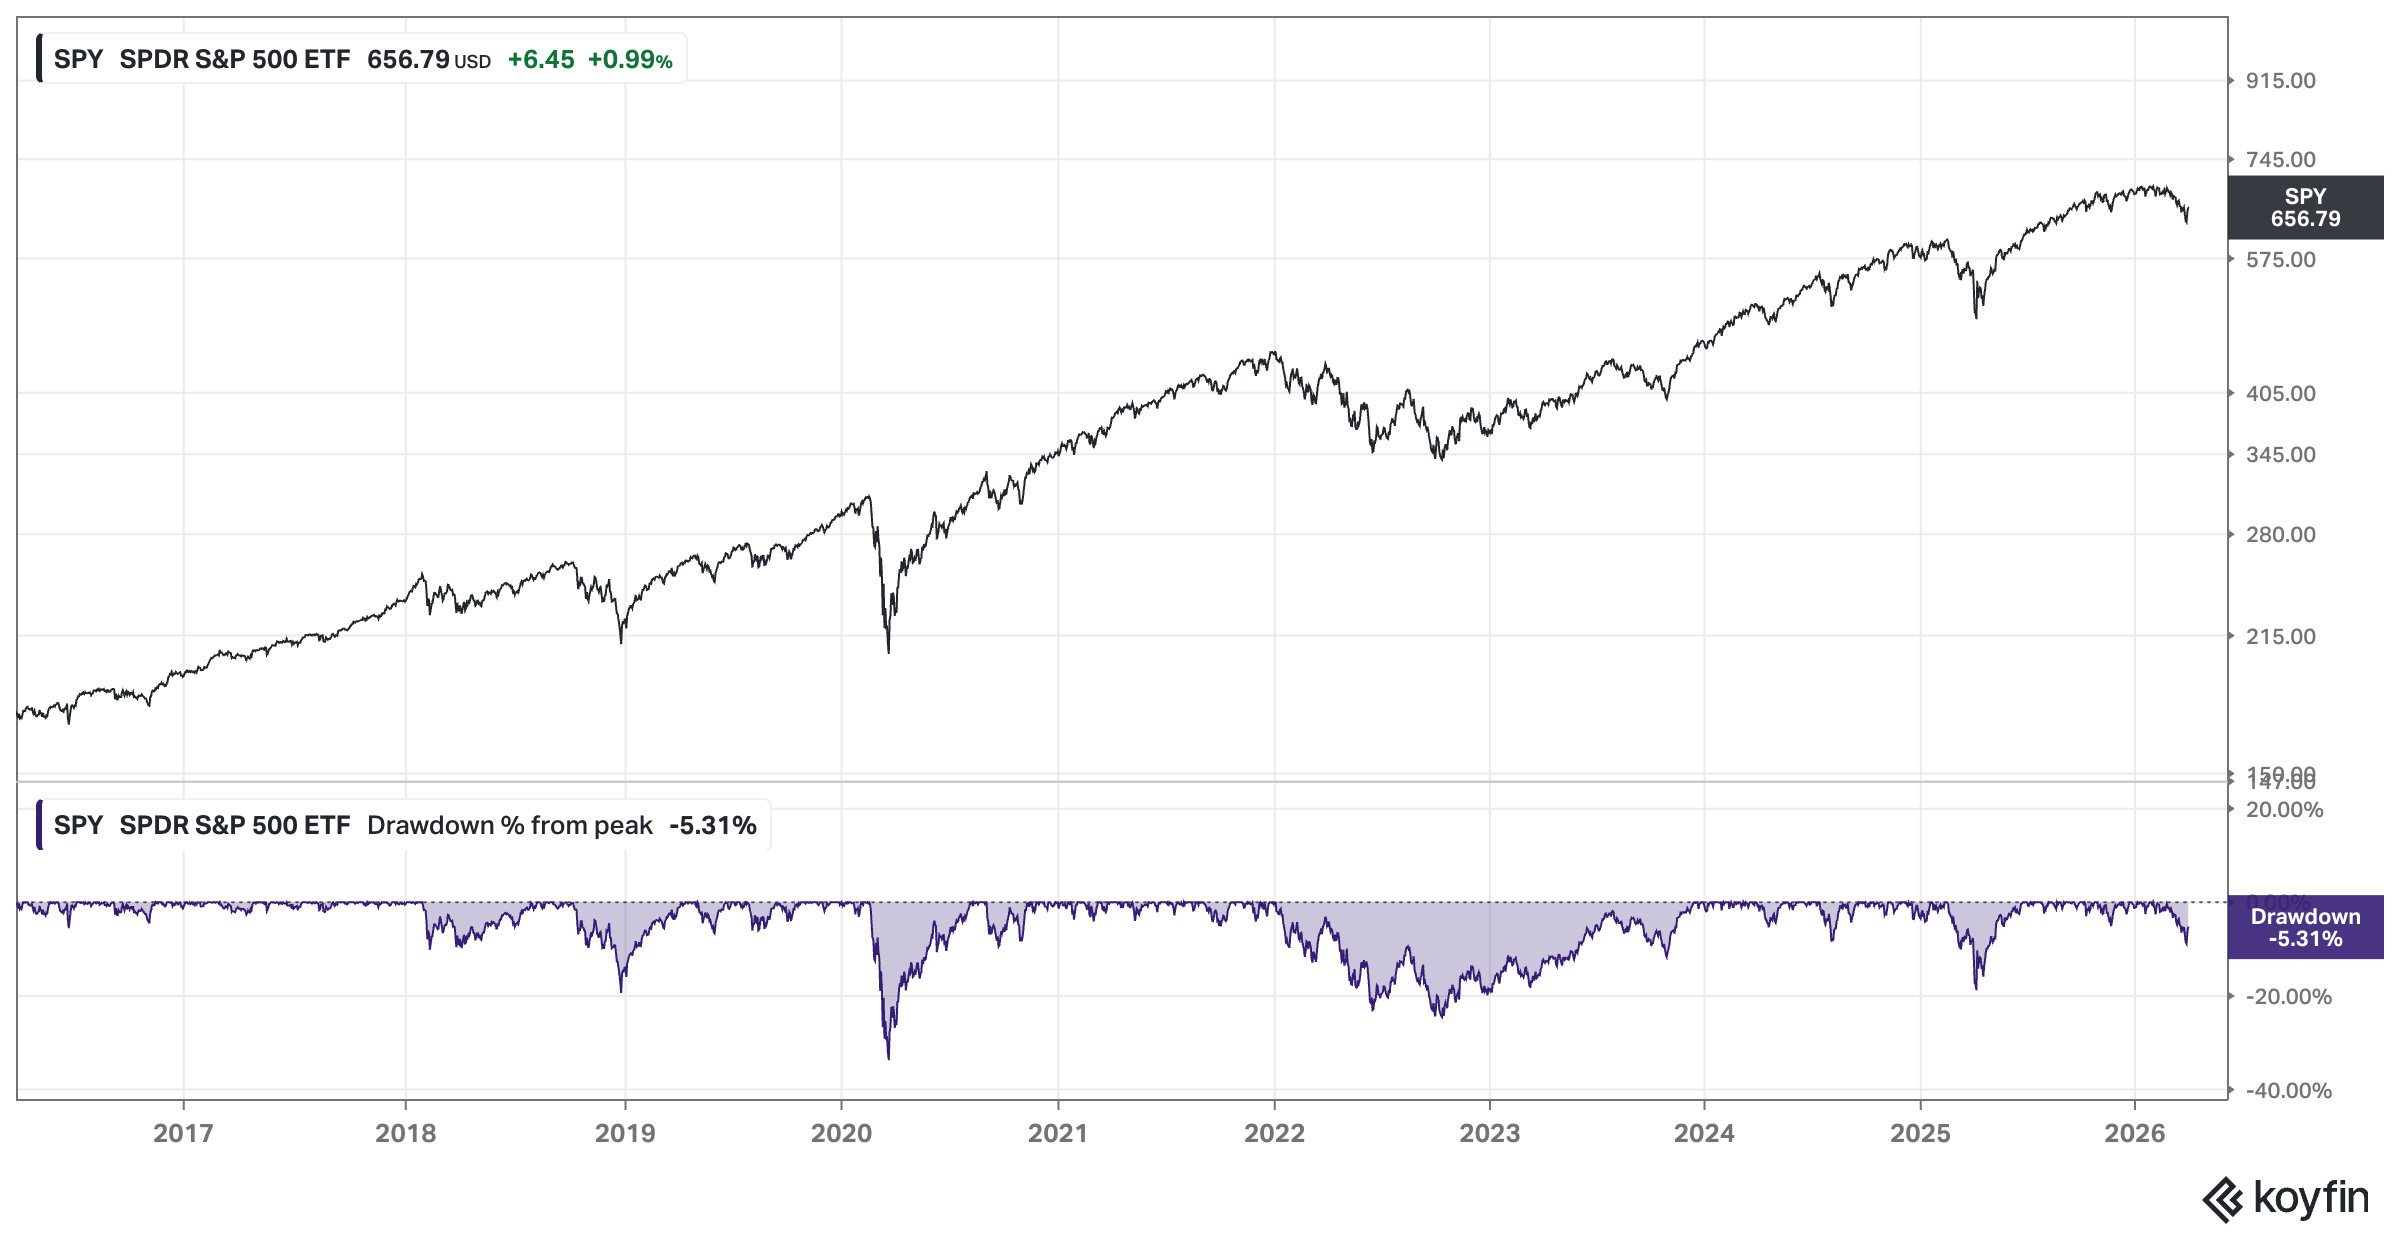
So as the indicator is signaling the “end of the world” (we might be exaggerating a little – I’m the first one to admit that), but the market is still in the midst of the longest party the US stock market has ever seen, you have to wonder if the ghosts of 1982 and 2009 are trying to tell us something that we are simply too “sophisticated” to hear, or if the very nature of economic indicators has shifted so far that we are looking at a compass that no longer has any signal value?
Join the private WhatsApp community!
Discuss stock ideas, ask questions, and get behind-the-scenes thoughts in real-time.
Available exclusively for paid subscribers. Want in? Choose the annual subscription plan + reply with your number (more details in the welcome email).PS: Using the app on iOS? Apple doesn’t allow in-app subscriptions without a big fee. To keep things fair and pay a lower subscription price, I recommend just heading to the site in your browser (desktop or mobile) to subscribe.
The Signal Isn’t Showing Up Anywhere Else
If we were truly standing at a generational bottom like 1982 or 2009, the air would be thick with the smell of capitulation. Panic is never a subtle affair. Especially to an experienced investor, but even for beginners, it is a rather loud, messy, and undeniable event that leaves its fingerprints all over the quantitative and qualitative indicators you can use to read the market’s mind.
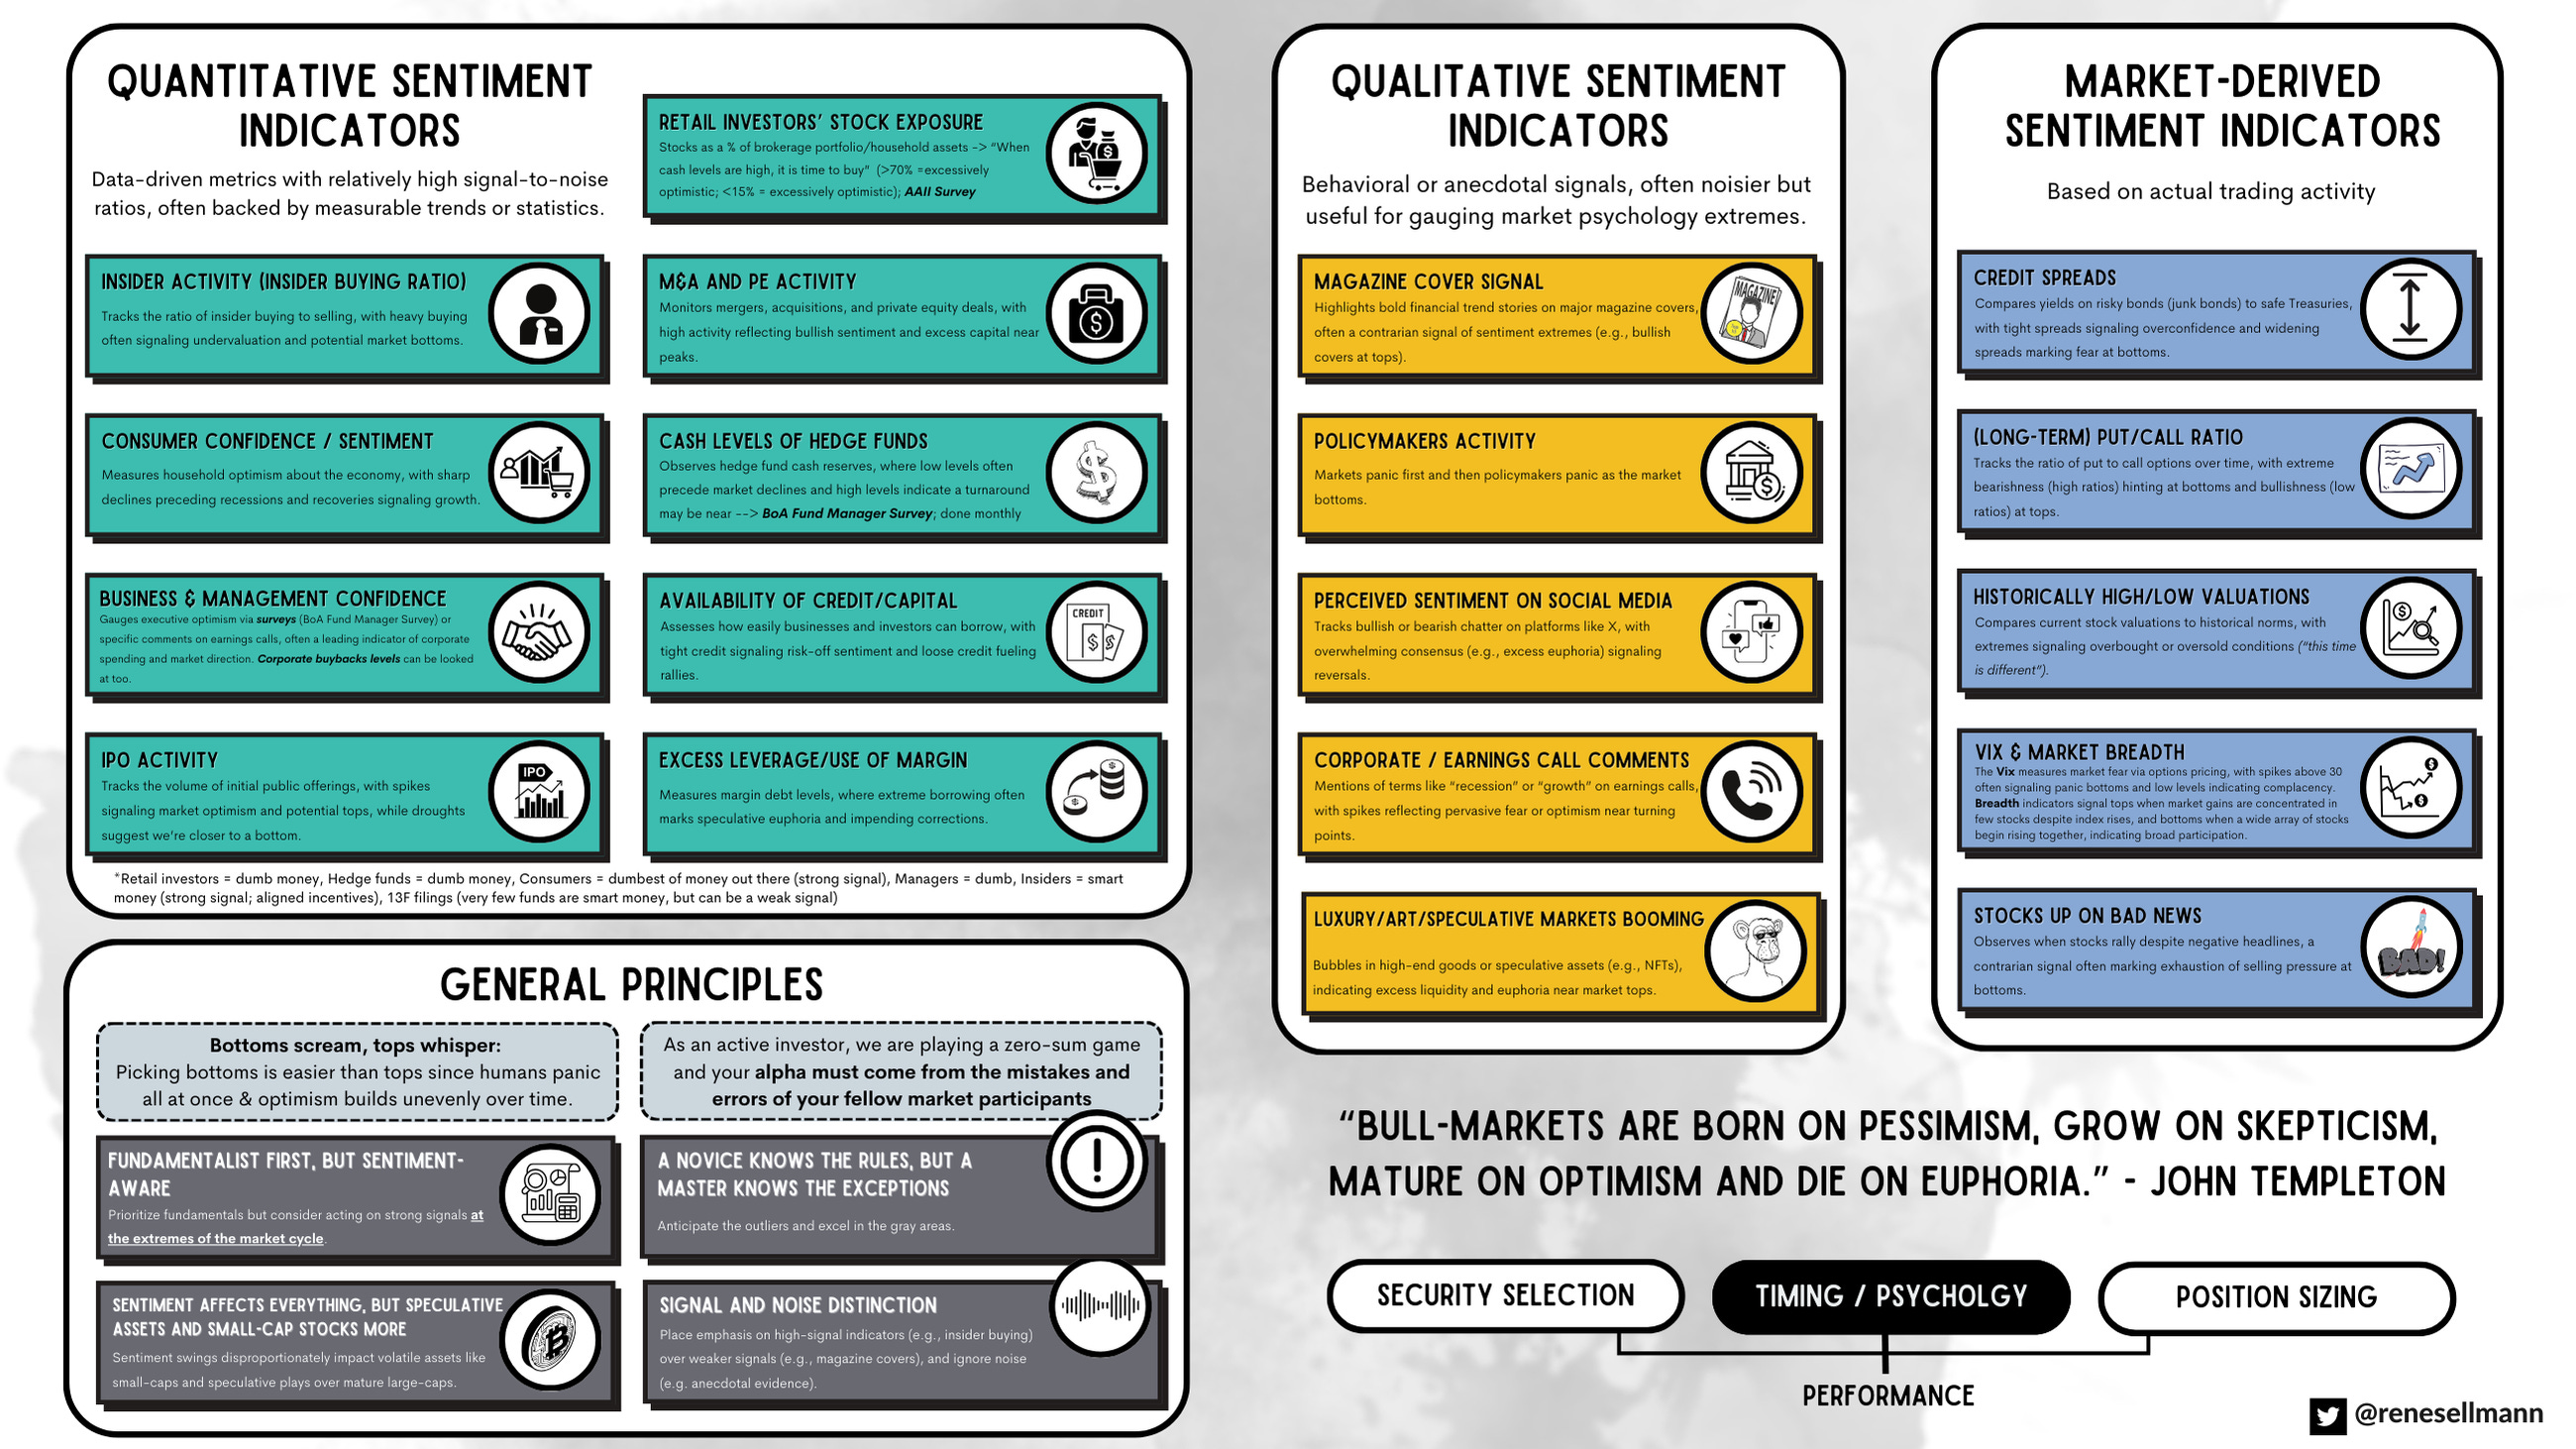
When I look at the sentiment “cheat sheet” I keep on my desktop, I see a checklist of what a bottom should look like. In a real crisis, the Quantitative Sentiment Indicators – the data-driven metrics with high signal-to-noise ratios – should be screaming.
We should see the Insider Buying Ratio spiking as executives grab their own shares at fire-sale prices. Not happening. When the people who actually run these companies aren’t putting their own money to work at these levels, it suggests they don’t see the current price action as a “once-in-a-career” bargain.
We should see credit spreads blowing out as the bond market prices in a wave of corporate defaults. Not happening. The bond market is usually the first to sniff out a real crisis. In a true economic disaster, the “risk-free” rate and the yield on corporate junk bonds tend to diverge violently as lenders demand a massive premium for the risk of a total wipeout. But right now, credit spreads remain remarkably tight. Lenders are effectively saying they don’t see any systemic threat on the horizon.
When I look at the professional class of market participants, the lack of fear is palpable. Advisor bears are at levels that are historically low. Today, the mood is one of quiet confidence, or one reflecting fear of missing out.
Even consumer pessimism – which has been elevated due to the cost of living – hasn’t translated into the kind of defensive, survivalist behavior that defines an economic collapse. People are still spending, still traveling, and still fully invested.
Retail cash levels tell a similar story. They are low. If we were truly at a generational bottom, we would see a mountain of “dry powder” sitting on the sidelines, too terrified to enter the fray. Instead, everyone is already in the pool.
Then there is the internal mechanics of the price action itself. The VIX – that famous “fear gauge” – is perhaps the most obvious missing piece of the puzzle. It spiked a little in light of the geopolitical events, but we haven’t seen any major spikes above 40, the traditional threshold for true market capitulation.
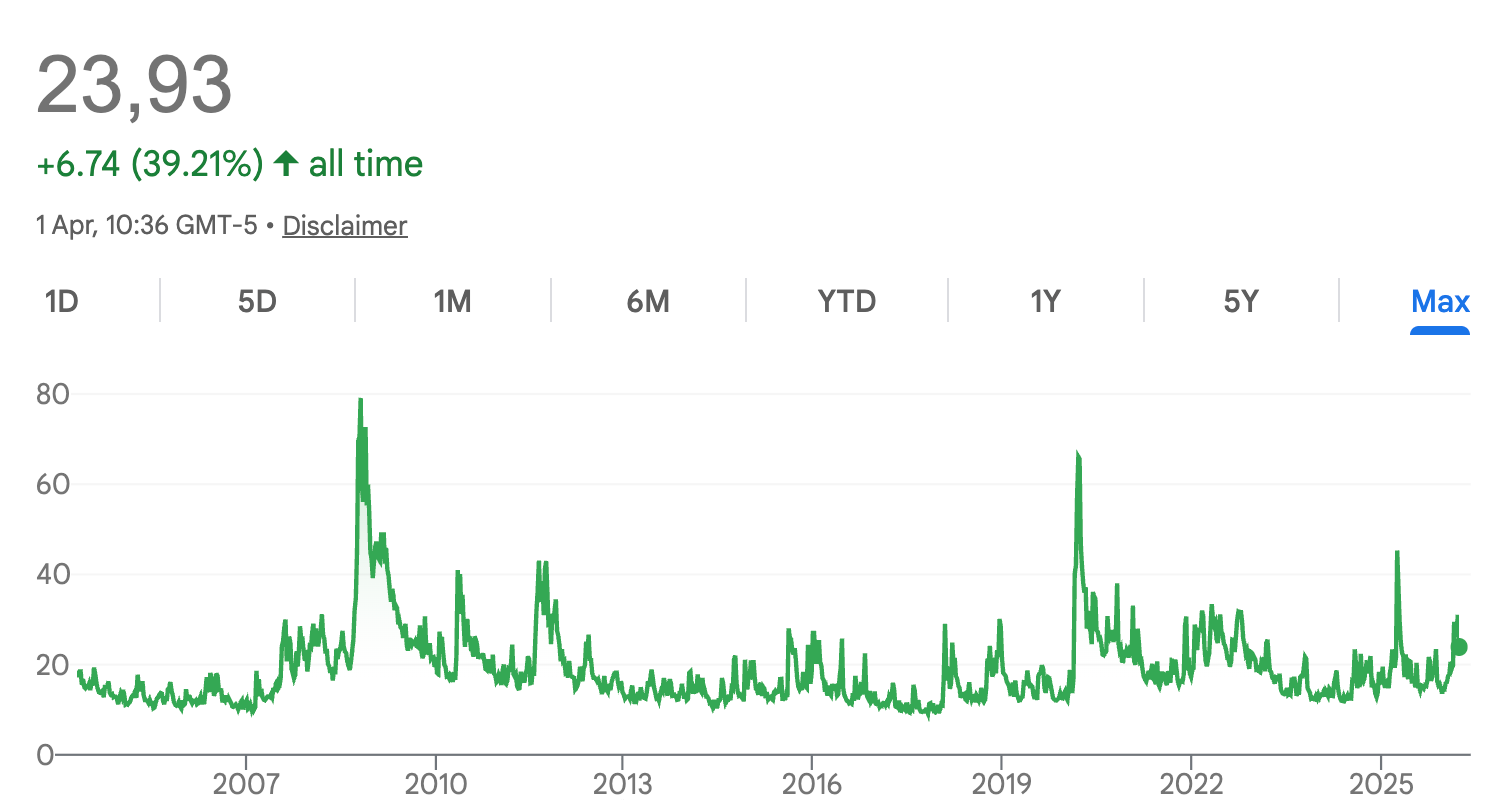
A real bottom needs a “washout” where the last of the weak hands are forced to sell. Without that spike in volatility, it is hard to argue that we have seen the kind of maximum pessimism required to fuel a new secular bull run.
Furthermore, stock market breadth remains decent. It isn’t just a handful of tech giants holding up the index; a decently broad range of stocks are still participating in the rally.
The cognitive dissonance is complete. The leading indicators say we are at a multi-decade-year bottom, but the sentiment indicators say we haven’t even begun to feel the pain.
It’s a dangerous divergence. Truly.
What If the Indicator Is Right and the Index Wrong?
The rest of this post is FREE to read. I only ask that you subscribe, which costs nothing and can be undone with a single click whenever you like.
The wall also helps keep my writing from being freely scraped by AI crawlers, so I hope you understand the small extra step.
In return, you get every deep dive, earnings review, and process piece I publish, straight to your inbox.