
How to Play the Coming Oil Supply Crunch: A Simple Mental Model for a Complicated Commodity Cycle
A practical way to spot multi-year opportunities without playing the macro guessing game

Every market cycle produces a group of stocks that investors would rather ignore. Sometimes it’s banks. Sometimes it’s “value.” Sometimes it’s China. Sometimes it’s anything with a small-cap label on it.
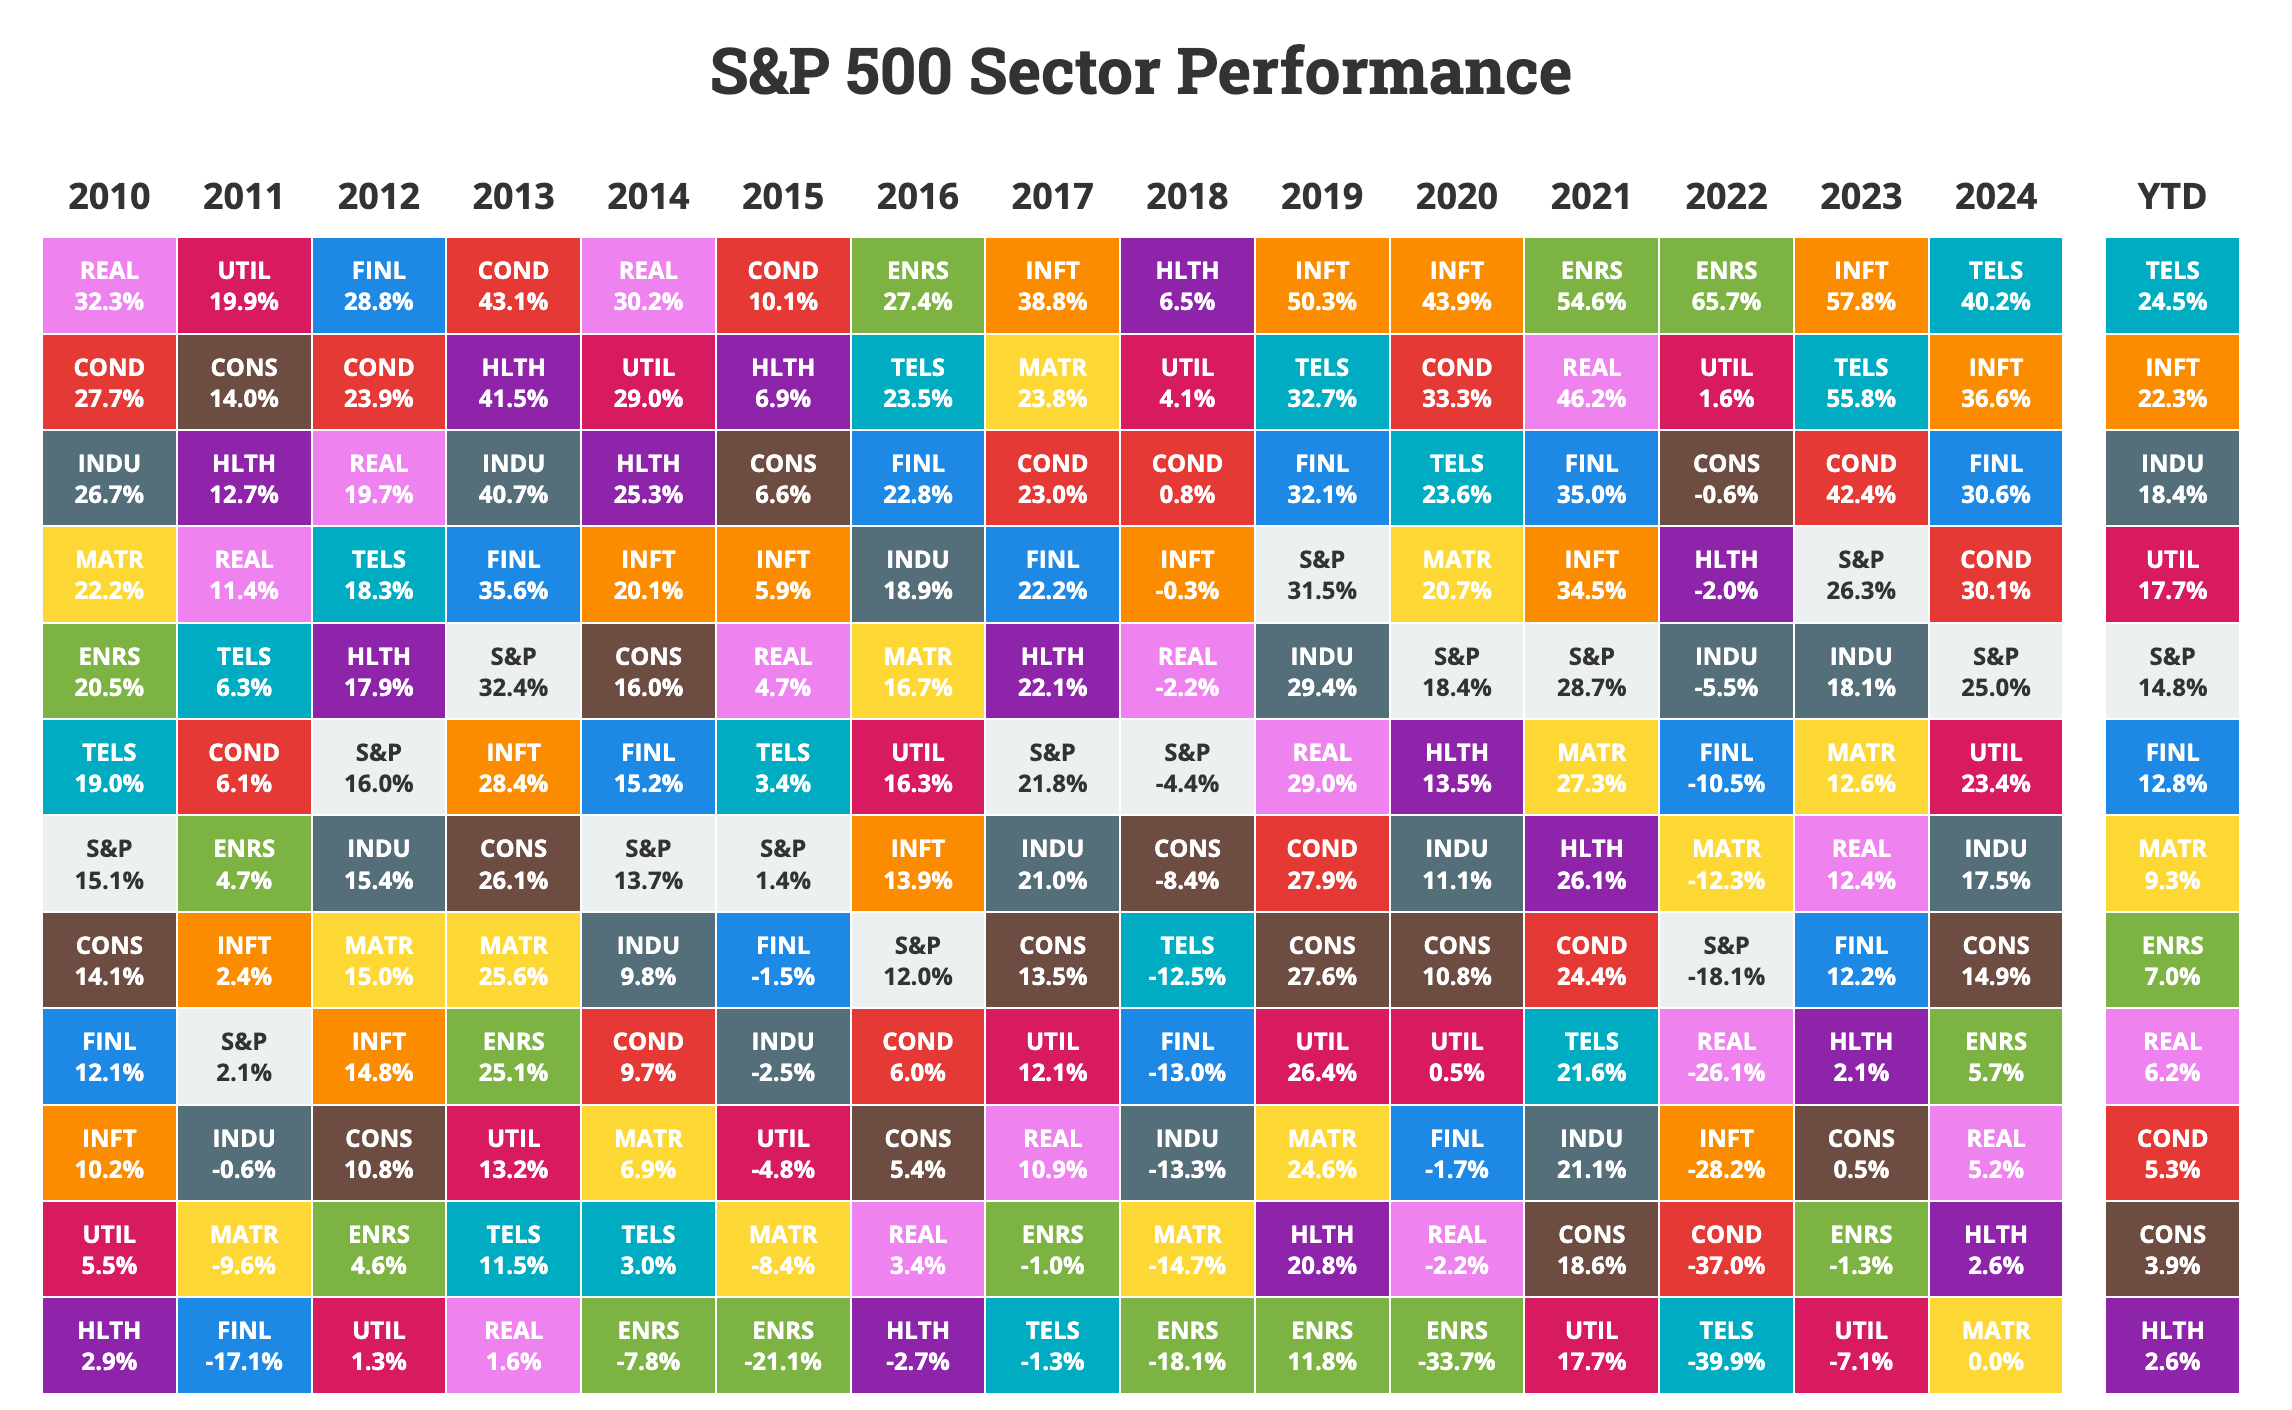
I love this chart from the Novel Investor, which illustrates short-term sector performance cyclicality quite well. It highlights how, over shorter time frames, the performance of S&P sectors is all over the place, depending on which year you look at – for instance, in 2016, Healthcare was the worst-performing sector, two years later, it was the best-performing one.
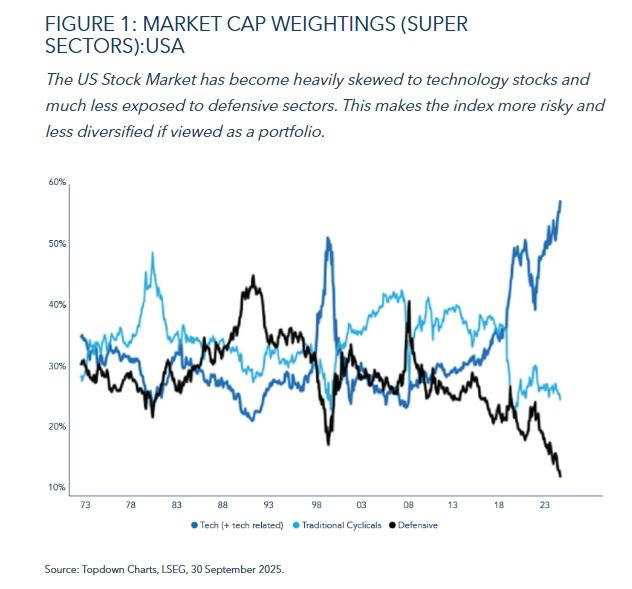
Today, the sectors the masses would rather ignore may very well be the broad energy complex, along with the healthcare sector. When you look at sector weightings, investor surveys, and fund flows, it’s hard not to notice how far out of favor they have fallen. Technology keeps absorbing more and more market cap, while defensive and cyclical sectors shrink quietly in the background, as illustrated by the chart below.
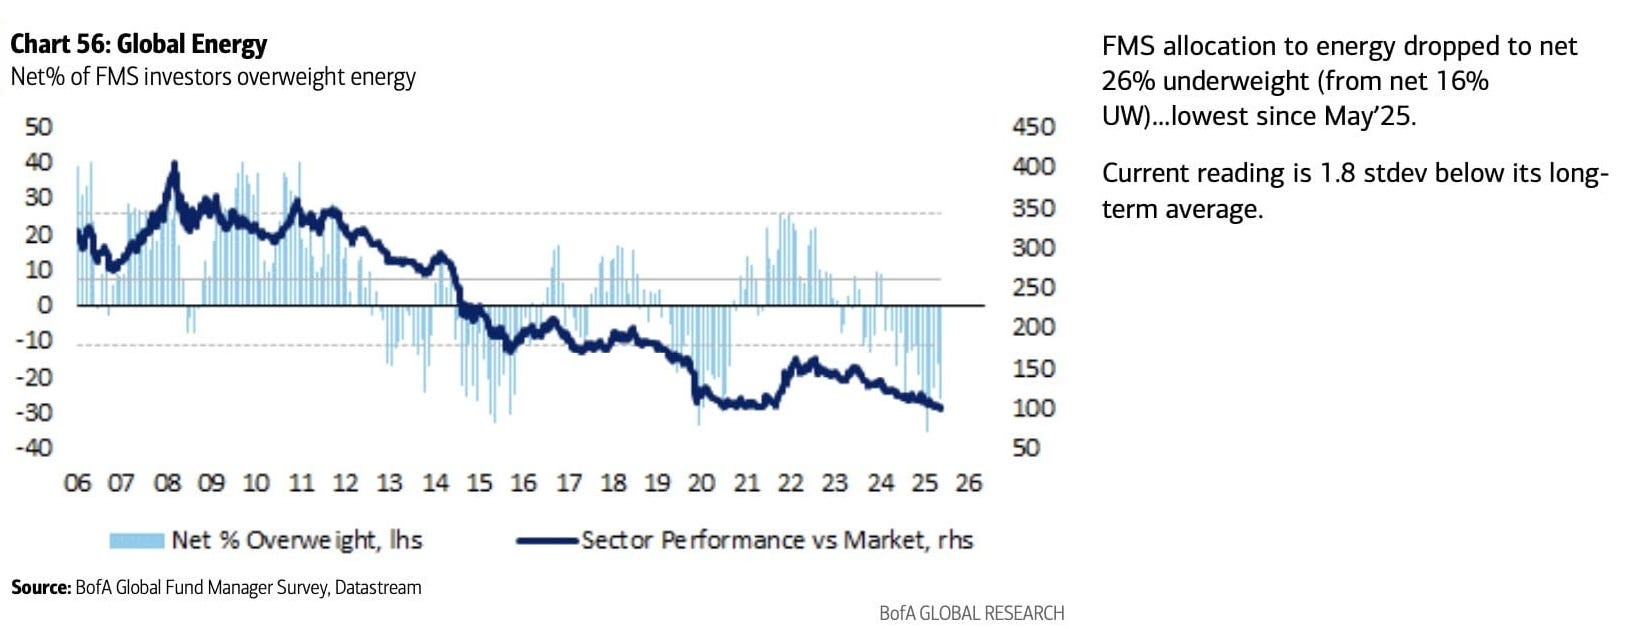
On the flow and positioning side, professional investors have moved from mild indifference to outright avoidance. The energy industry has slipped back into a familiar spot on the market’s emotional spectrum: boredom bordering on disdain.
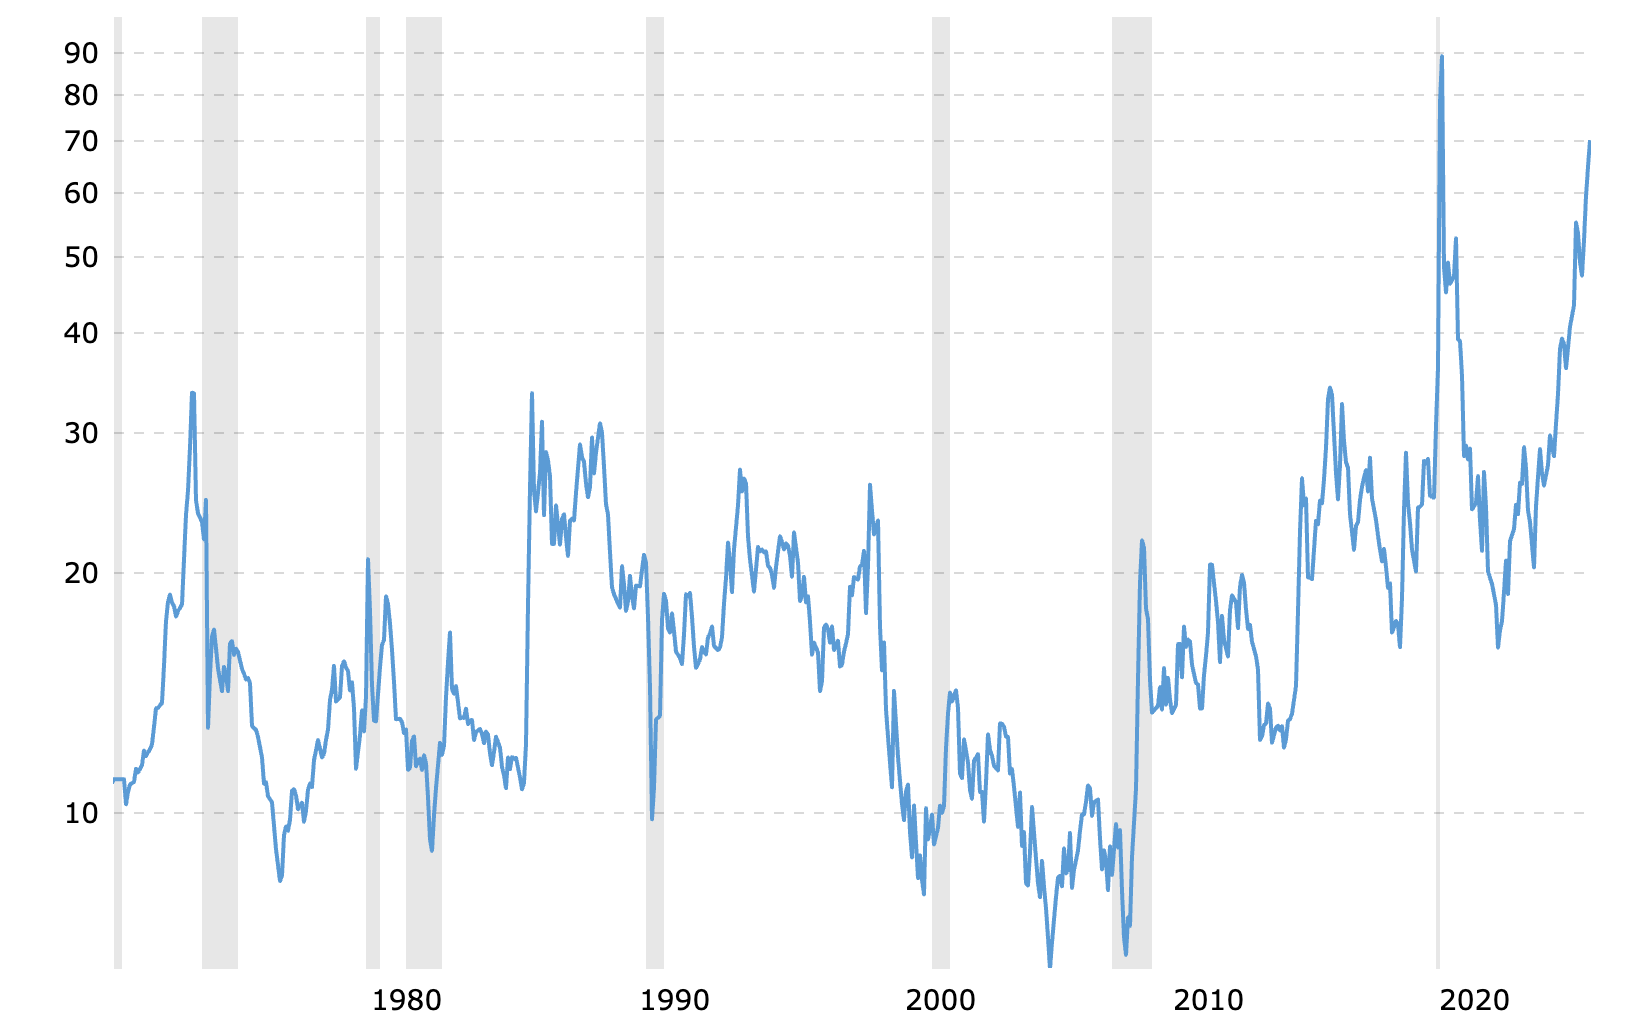
In fact, relative to the current money supply, oil “is currently near its cheapest levels in history“:
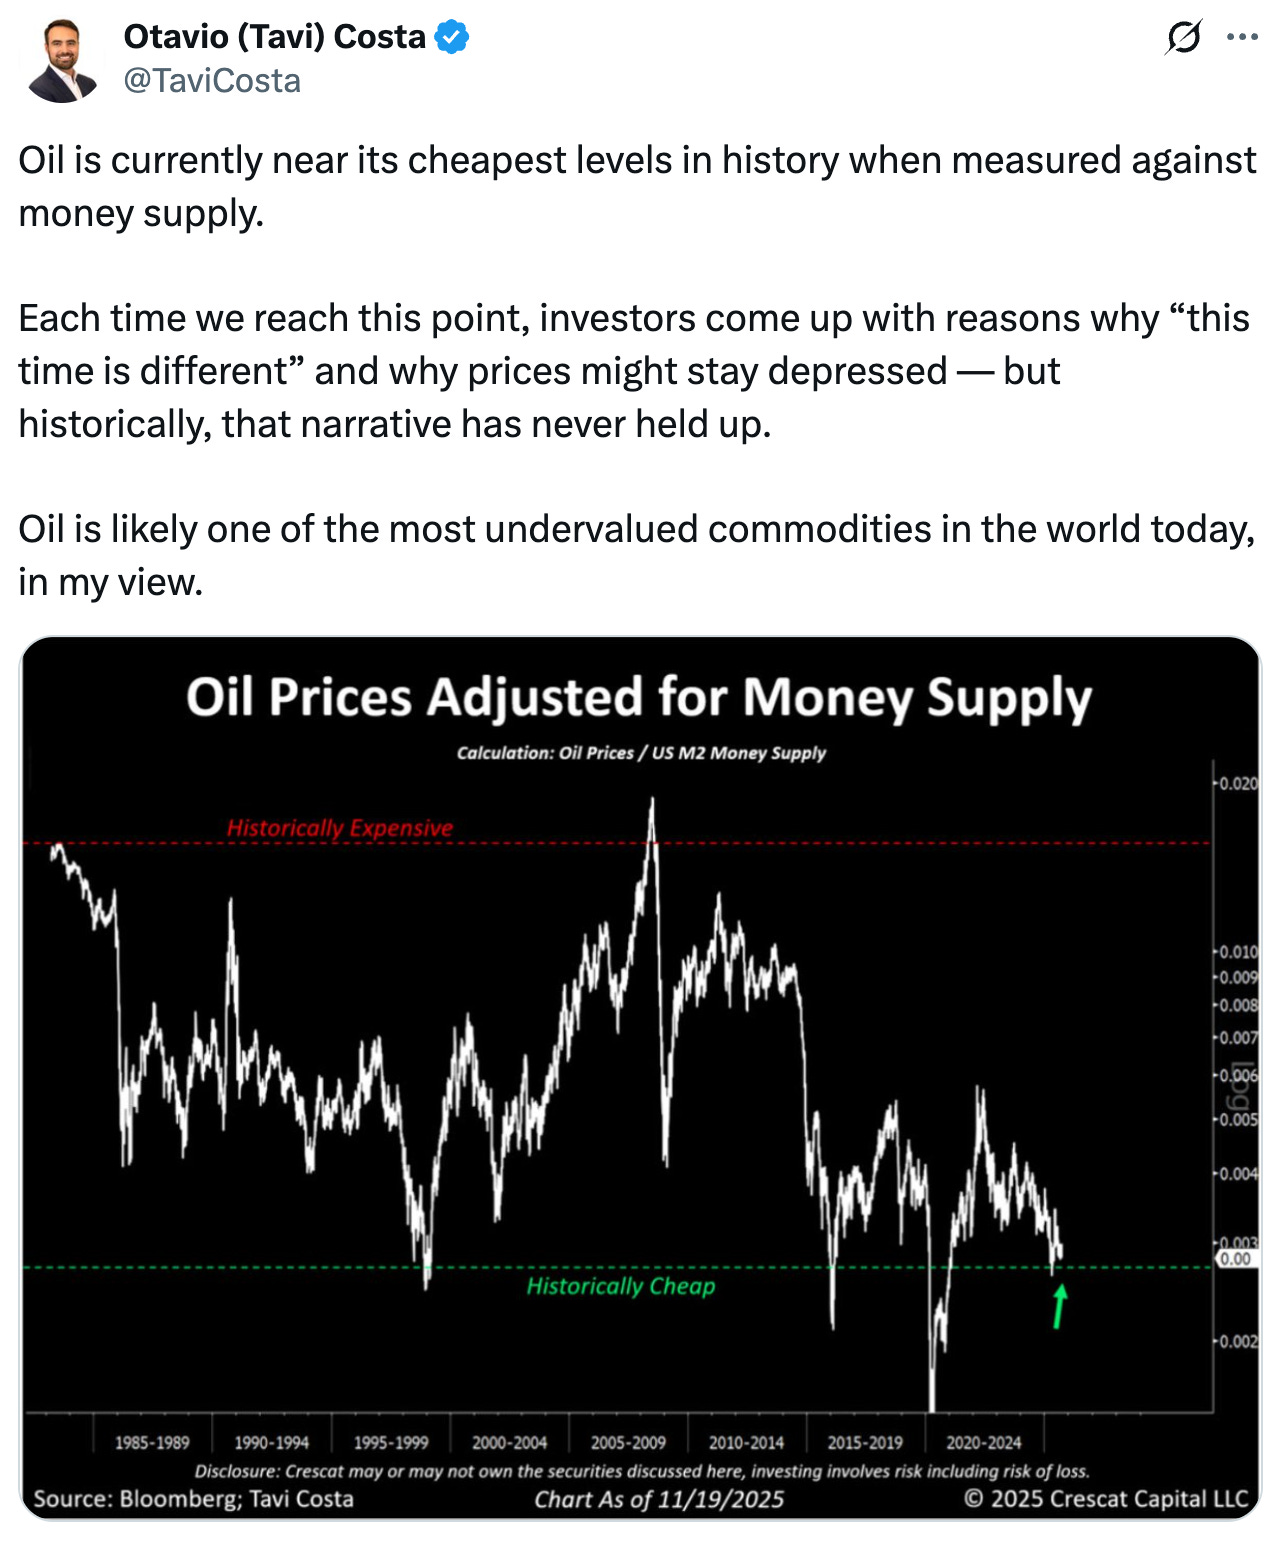
“The oil price today is about as bad as I’ve seen it. It’s not low. It’s not an all-time low in nominal dollars. As of today, we’re talking about a WTI price. It’s up today a little bit. So 58 bucks. But in real dollars compared to kind of the monthly lows during Covid […], it’s not far off from that.” - Adam Rozencwajg
Additionally, oil also looks cheap, measured against gold:
Here’s a Preview of What’s Inside the Paywalled Sections (6,500-word deep dive):
Why and how hated sectors are fertile hunting grounds
The one mental model that simplifies commodity investing: How a single framework coupled with common sense cuts through the noise of macro predictions and offers a surprisingly powerful lens on the oil cycle.
What the global cost curve actually looks like today: A detailed exploration of production economics across shale, offshore, conventional, and high-cost barrels
The hidden story inside reinvestment and supply data: What capital discipline, service-cost inflation, and shifting marginal economics tell us about the next few years of global supply.
Why the cycle may tighten long before prices signal it
A differentiated way to play the cycle without relying on oil prices: An in-depth look at ecosystem businesses with dual-cycle characteristics
How to think about implementation, risk, and timing
An appendix with a NotebookLM-generated infographic on the current state of the oil market, a couple of videos I found interesting on the topic of commodity investing (and the opportunity in oil specifically), and a bunch of charts on oil stocks’ recent 3-year performance (categorized by their role in the oil ecosystem).
This is where it gets interesting.
Become a paying subscriber to read the rest of this post and get access to all of my other research, including valuation spreadsheets, deep dives (e.g. well-known mid- and large caps such as LVMH, Duolingo, Meta, Edenred as well as more hidden gems such as Tiger Brokers, Digital Ocean, Ashtead Technologies, InPost, Timee, and MANY more), and powerful investing frameworks.
Annual members also get access to my private WhatsApp groups – daily discussions with like-minded investors, analysis feedback, and direct access to me.
PS: Using the app on iOS? Apple doesn’t allow in-app subscriptions without a big fee. To keep things fair and pay a lower subscription price, I recommend just heading to the site in your browser (desktop or mobile) to subscribe.