
From Reported to Real: The Hidden Economics of Novo Nordisk’s Cash Flow
A Deep Dive into “True” FCF

Free cash flow (FCF) has long been the go-to metric for assessing the cash-generating power of a business – especially among value (i.e. intelligent) investors.
It’s clean, it’s supposedly straightforward, and it’s splashed across valuation models like gospel.
But here’s the uncomfortable truth: reported FCF – especially when looking at a single year – often tells us very little about what a company could actually return to shareholders without compromising its long-term competitive edge.
That’s especially true in today’s economy – one that is increasingly driven by intangible investment. Think about it: R&D, brand-building, proprietary software, customer acquisition. These are the real engines of value creation in many modern businesses.
Yet under current accounting rules, these investments are (usually) simply expensed. They're treated no differently than rent or office supplies. They drag down earnings and depress FCF, even when they’re fueling the next decade of growth.
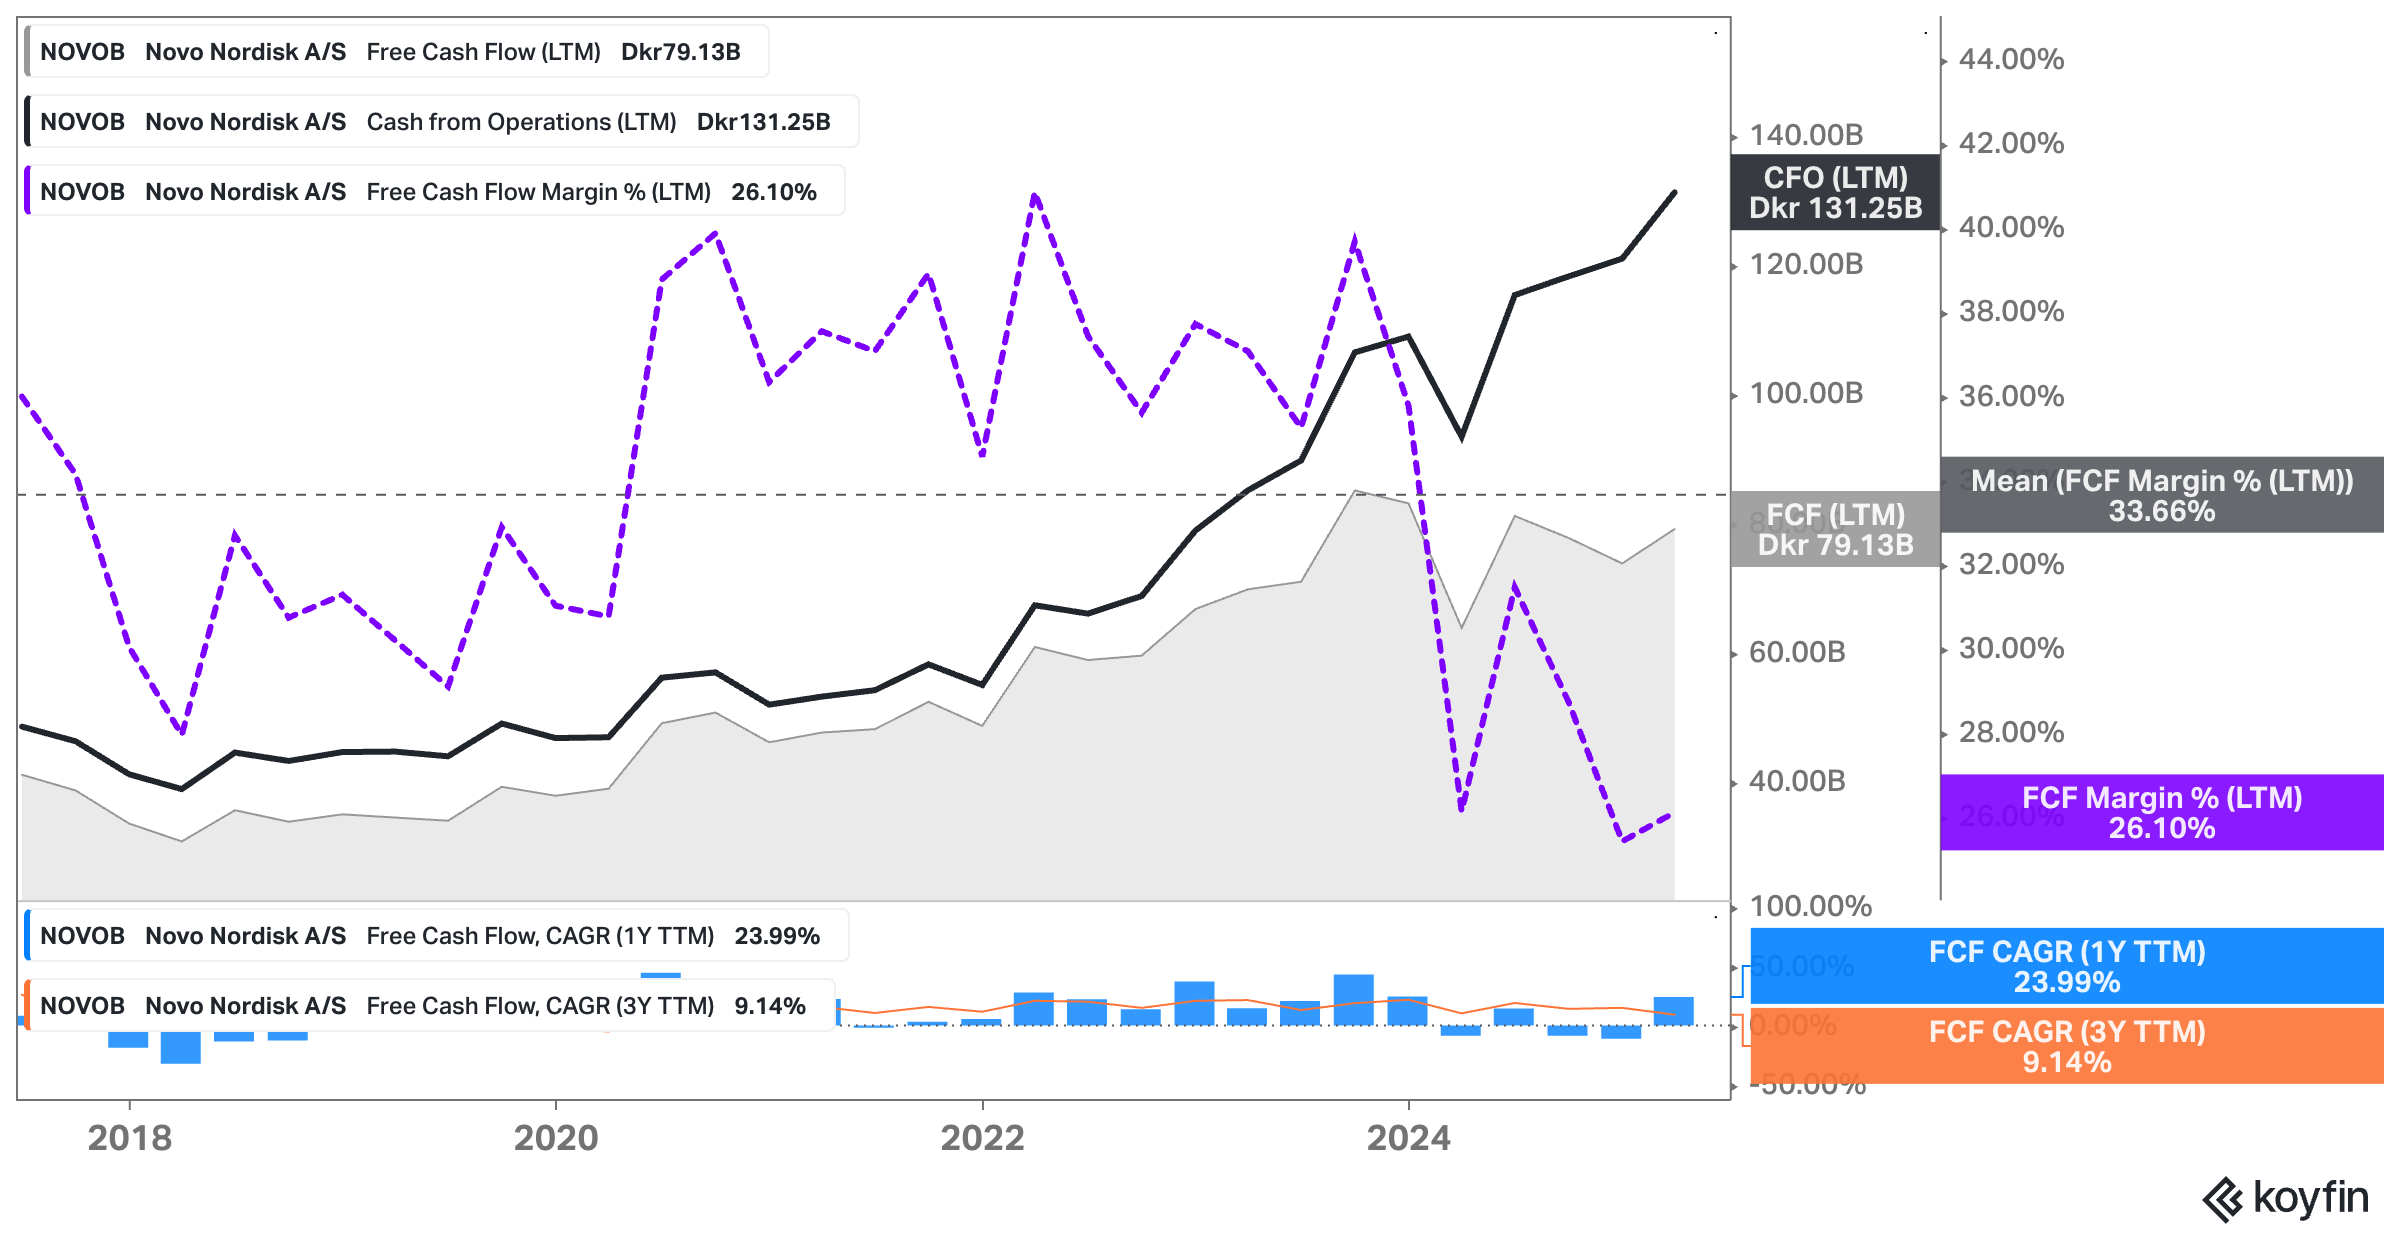
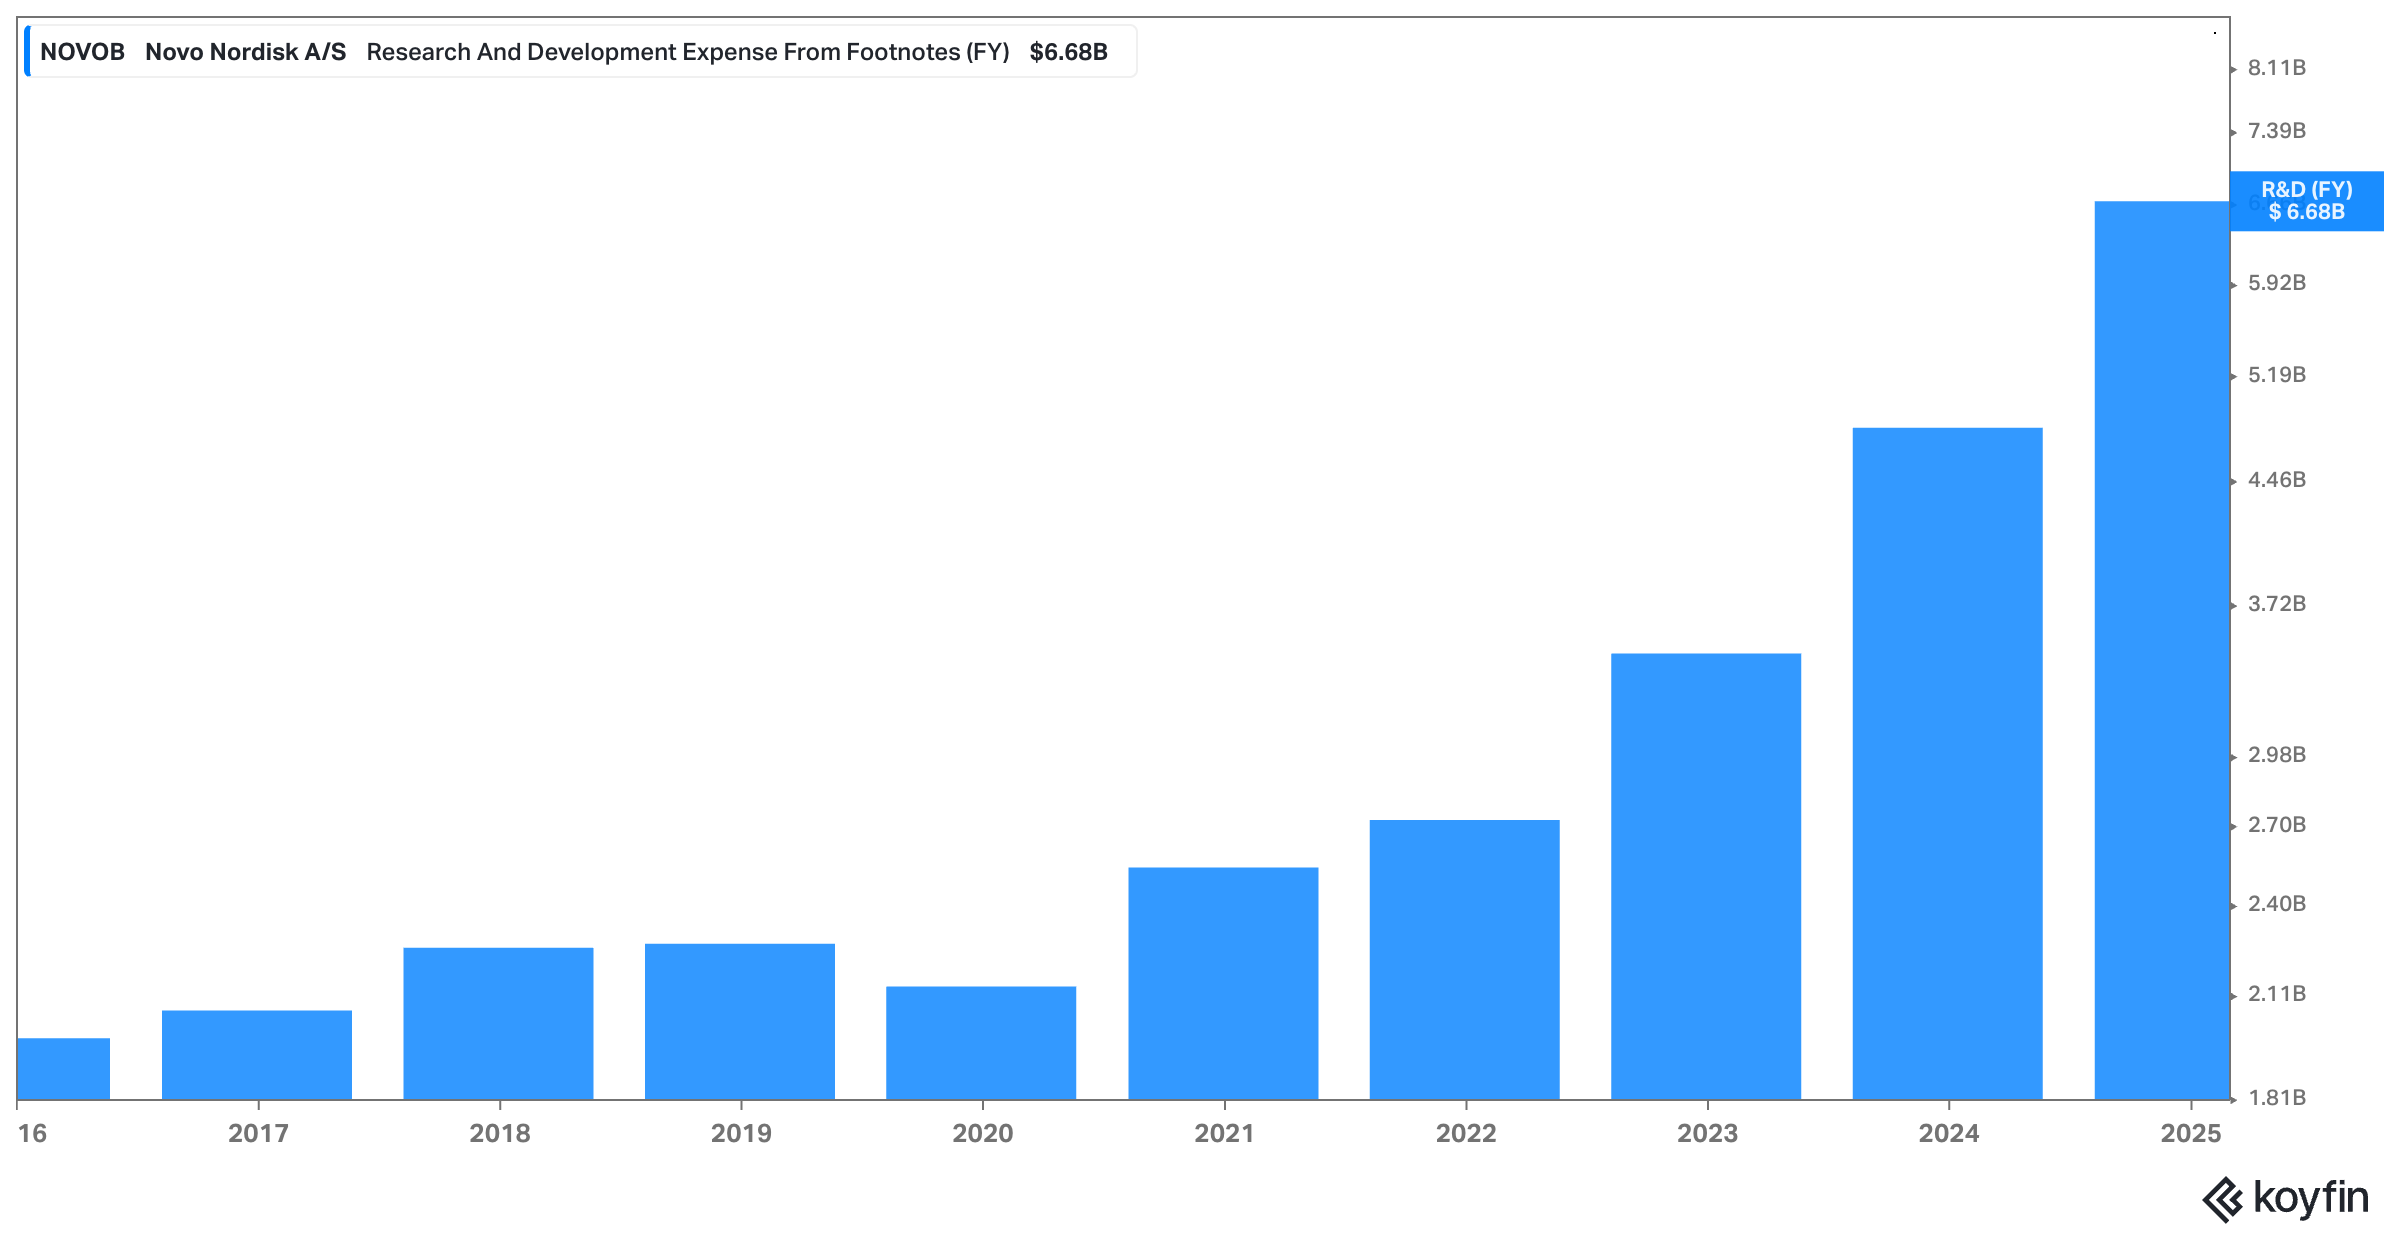
Novo Nordisk is a perfect case in point. On paper, it’s already a cash machine. Reported FCF has more than doubled between 2018 and 2024, driven by the explosive success of its GLP-1 franchise.
But if you want to understand the business more deeply – and especially if you care about valuation, capital allocation, or what Buffett once called “owner earnings” – you need to go a level deeper.
This post is about going that level deeper.
I’ve gone back to Novo’s 2018 and 2024 financials and rebuilt its “true FCF” from the ground up. I looked at these two years as I will calculate the return on incremental invested capital (ROIIC) for the investment made during this period in a follow-up post (make sure to subscribe to not miss it!).
The exercise requires judgment, yes. But I believe it’s rooted in a clear and consistent framework:
First, treating stock-based compensation (SBC) as a real cost.
Second, distinguishing between maintenance and growth capital expenditures.
And third – most crucially – recognizing that R&D should be treated like CapEx, and not just a one-time hit to the income statement.
This isn’t just an academic exercise. It changes how we think about distributable earnings. It affects how we model valuation. And most importantly, it forces us to be honest about what cash is truly “free” – and what’s being reinvested for future growth.
In the sections that follow, I’ll walk you through each adjustment I made. Along the way, we’ll look at why traditional accounting distorts FCF in intangible-heavy businesses, how Mauboussin’s work on economic earnings can sharpen our understanding, and what this all means for long-term investors trying to make sense of Novo’s current trajectory.
Let’s start with the most straightforward piece: stock-based compensation.
Disclaimer: The analysis presented in this blog may be flawed and/or critical information may have been overlooked. The content provided should be considered an educational resource and should not be construed as individualized investment advice, nor as a recommendation to buy or sell specific securities. I may own some of the securities discussed. The stocks, funds, and assets discussed are examples only and may not be appropriate for your individual circumstances. It is the responsibility of the reader to do their own due diligence before investing in any index fund, ETF, asset, or stock mentioned or before making any sell decisions. Also double-check if the comments made are accurate. You should always consult with a financial advisor before purchasing a specific stock and making decisions regarding your portfolio.
Stock-Based Compensation: A Real Expense, Not Just a Footnote
Let’s begin with the obvious – stock-based compensation (SBC). It’s the cleanest adjustment to make and arguably the least controversial. And yet, in practice, it’s often swept aside with the tired argument that it’s a “non-cash” expense. That line of reasoning, while technically correct, misses the economic reality.
Stock-based compensation may not drain cash from the company today, but it absolutely extracts value from shareholders. It dilutes existing owners, transfers economic rights to insiders, and – most importantly – represents a real cost of doing business. If you’re trying to get to true owner earnings, it needs to be treated as such.
Think of it this way: if a company paid an engineer a $300,000 salary entirely in stock, would that mean the engineer worked for free? Of course not. That equity has real economic value – and so should the expense.
So how material is SBC at Novo Nordisk?
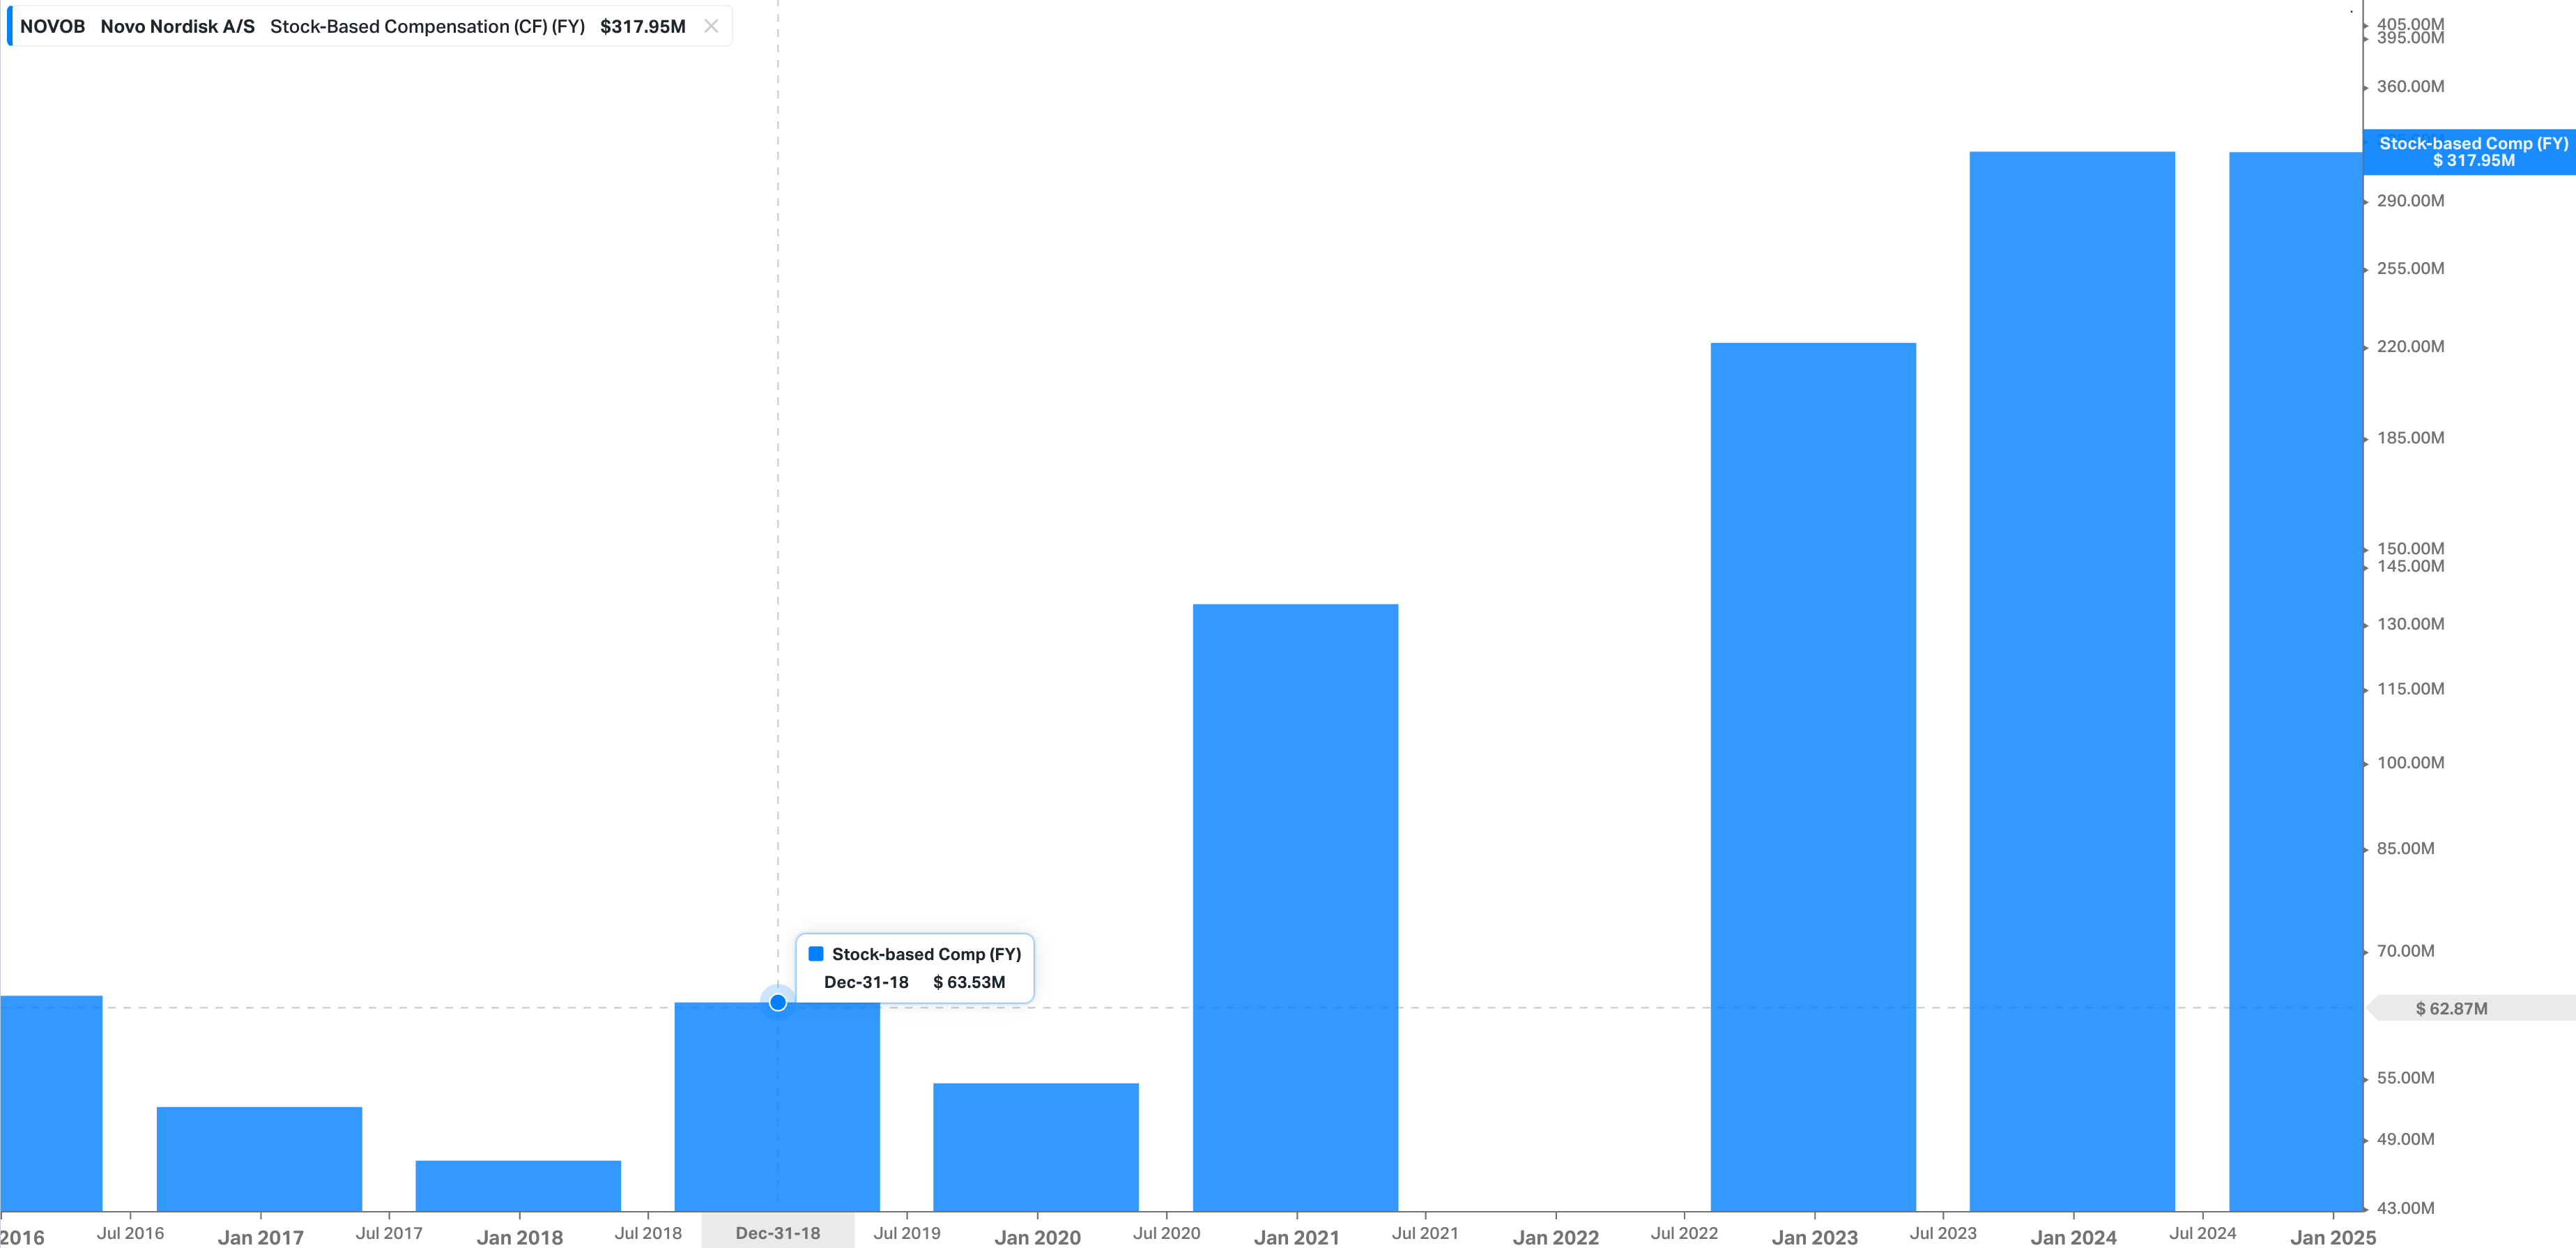
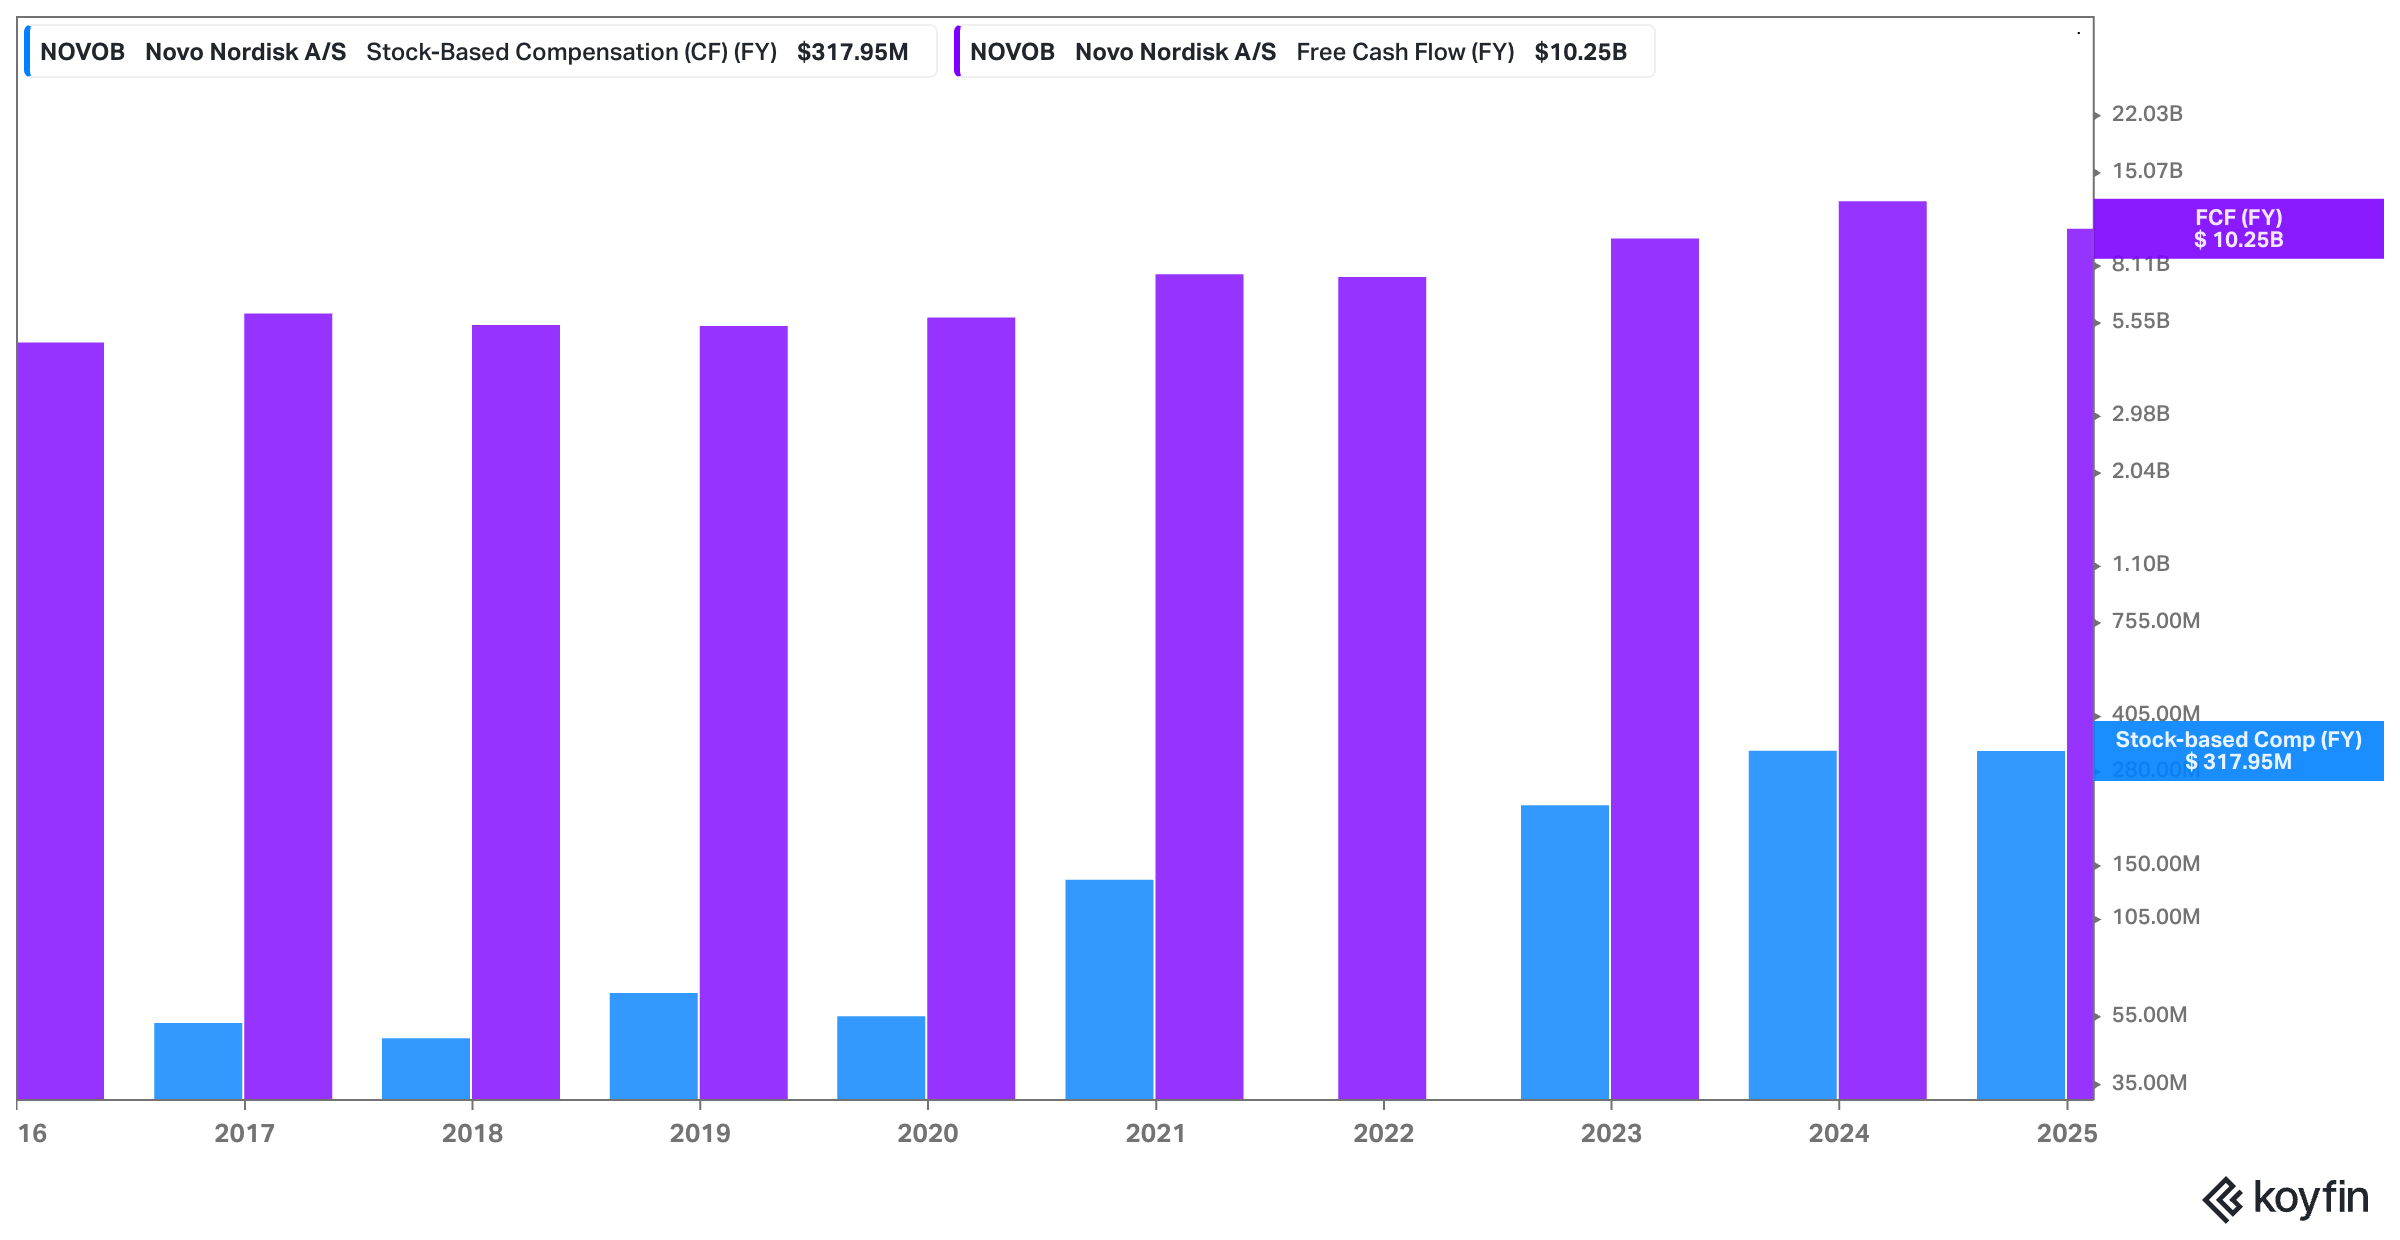
In Novo’s case, it’s not a massive line item – but it’s not zero either. In 2018, SBC came in at $64 million. By 2024, it had grown to $318 million. Relative to revenue, that’s roughly:
2018: 64 / 17,160 = 0.37%
2024: 318 / 40,338 = 0.79%
These aren’t earth-shattering figures. SBC remains under 1% of revenue in both years. But in absolute dollar terms, the increase is significant – and ignoring it would still mean overstating distributable cash.
So I simply adjust for it directly. I subtract SBC from reported free cash flow to get an SBC-adjusted figure – a cleaner measure of what’s left over after compensating employees with real economic value. Here’s what that looks like:
2018 Reported FCF: $5,368 million
→ SBC-adjusted FCF: $5,304 million2024 Reported FCF: $10,252 million
→ SBC-adjusted FCF: $9,934 million
Not a huge swing, but we’re sharpening the lens. This adjustment gives us a more accurate baseline from which to evaluate subsequent layers – namely, CapEx and R&D.
And those, as you’ll see, have a much more meaningful impact on how we should interpret Novo’s cash-generating ability.
But before we go there, one final note: this adjustment also sends a useful signal about incentives. A company paying meaningful compensation in stock rather than cash is implicitly betting that the long-term equity value will rise. That’s fine – as long as you’re honest about the cost. But you can’t double-count it as both a growth investment and a free lunch.
For valuation purposes, SBC is compensation. And compensation is a cost.
With that cleaned up, let’s move to the more nuanced part of the equation – capital expenditures, and the challenge of separating what’s truly needed from what’s being spent to drive growth.
Not All CapEx Is Created Equal: Breaking Out Growth vs. Maintenance
If stock-based compensation is the low-hanging fruit of cash flow adjustments, CapEx is where things start to get more nuanced – and far more interesting.
By definition, free cash flow subtracts capital expenditures. That makes sense if you assume all CapEx is necessary just to keep the lights on. But that’s rarely the case.
Much of what companies spend on CapEx is discretionary – aimed at expanding production, entering new markets, or upgrading infrastructure for future returns. Treating all of it as a hit to FCF understates the true earnings power of the business.
This distinction – between maintenance CapEx and growth CapEx – is essential if you want to get to the Buffett-style notion of “owner earnings”:
the amount of cash a business can distribute without impairing its competitive position.

The CapEx Context at Novo Nordisk
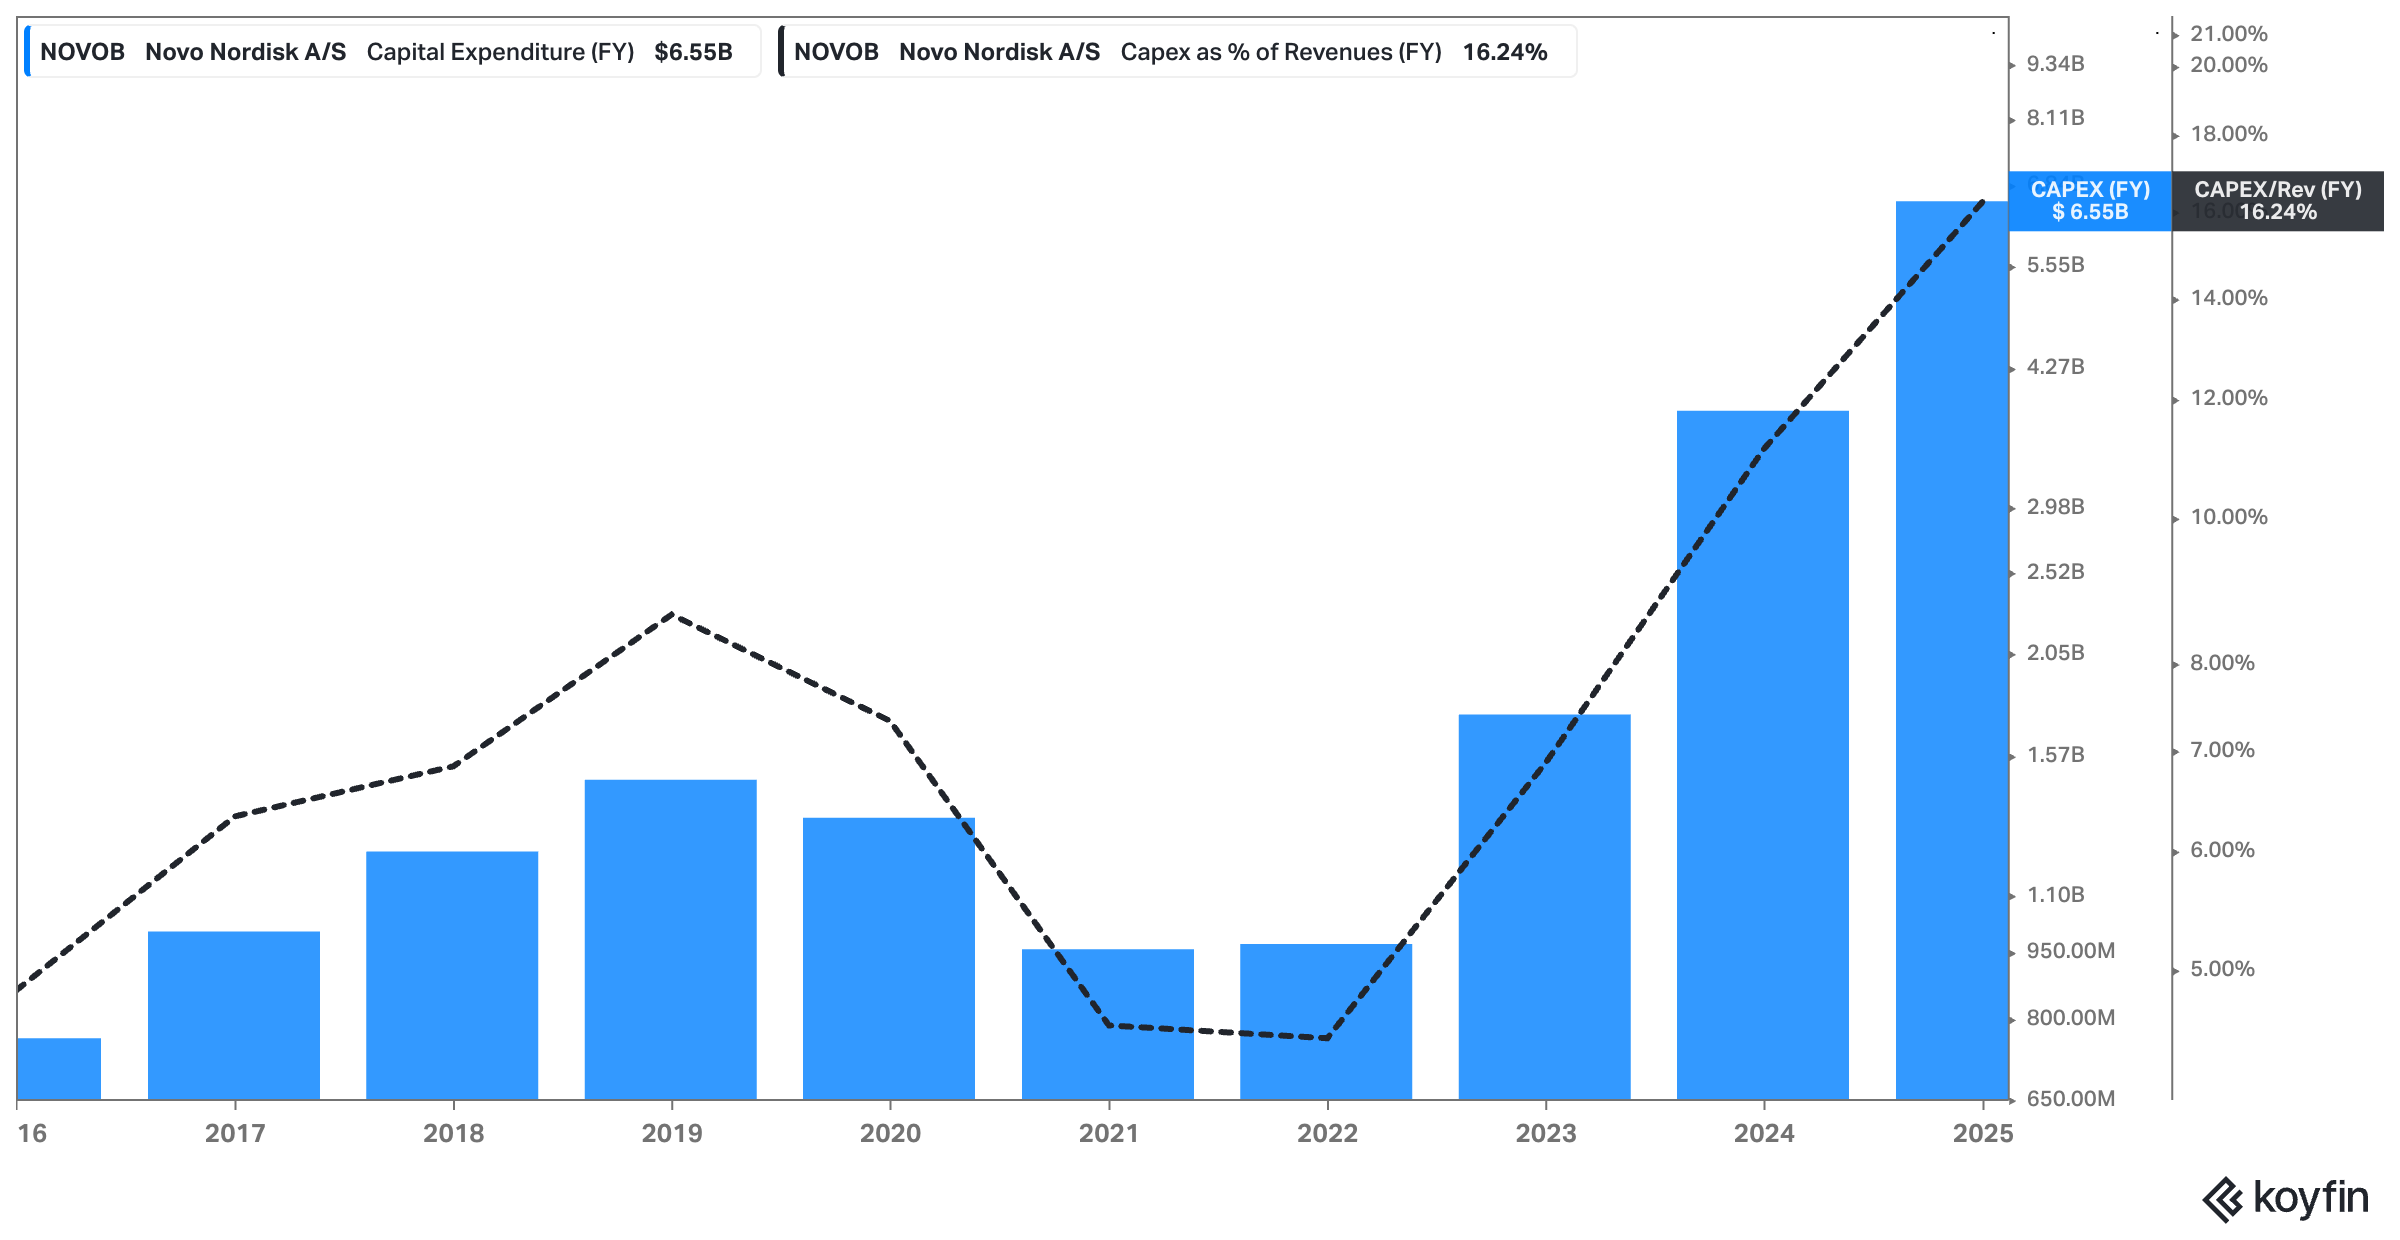
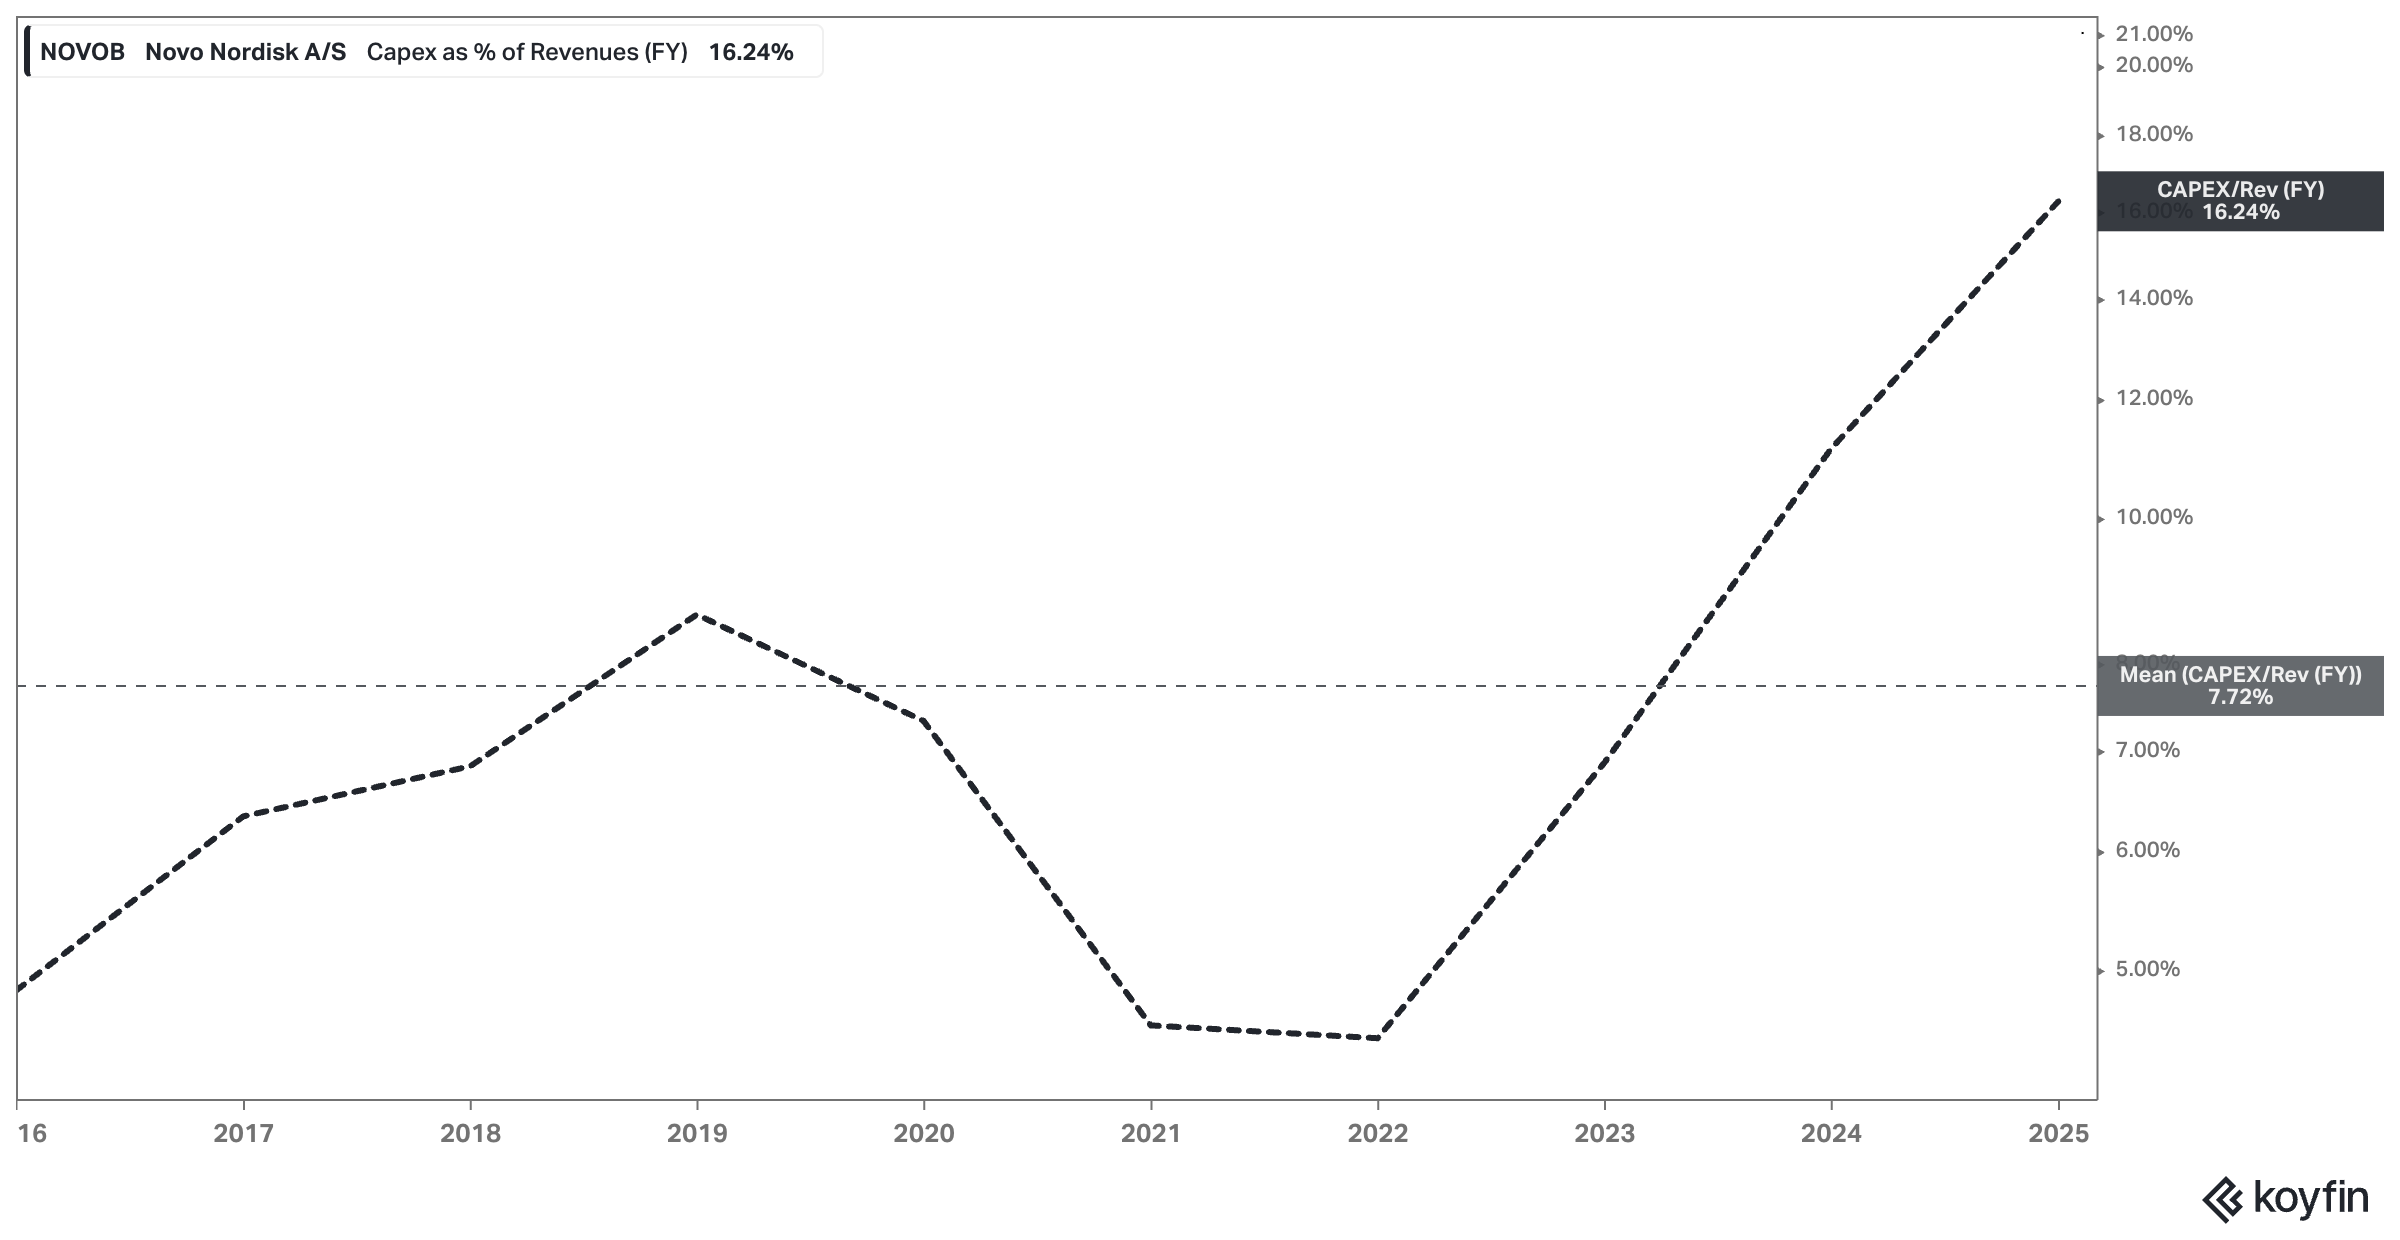
Take Novo Nordisk. Reported CapEx jumped from $1.48 billion in 2018 to a whopping $6.55 billion in 2024 – more than 4x in nominal terms. In percentage of revenue, that’s a leap from 8.6% to 16.2%.
But this spike didn’t happen in a vacuum. Novo is aggressively scaling up its production footprint, particularly in response to booming demand for GLP-1 drugs like Ozempic and Wegovy. In the past couple of years, the company has announced major facility expansions in the U.S., including:
A new manufacturing site in Clayton, North Carolina
Further capacity buildouts in Fremont, California
Likely expansions in Europe to support global distribution

Arguably, this isn’t about patching up old equipment or maintaining compliance. It’s growth CapEx. It’s a bet on future scale.
Estimating Maintenance CapEx
So how do we separate the wheat from the chaff?
Looking at Novo’s long-term CapEx as a percentage of revenue gives us some clues. Over the last decade, the average sits around 7%.
That’s already on the higher side, reflecting:
The high complexity of biologics manufacturing
Regulatory requirements and GMP standards
Novo’s vertically integrated production model
But within that 7%, it’s fair to assume not all is maintenance. Based on industry comparisons and Novo’s own expansion pace, I estimate maintenance CapEx at roughly 4% of revenue, leaving the rest as growth investment.
Using that, here’s how the CapEx split shakes out:
2018
CapEx: $1,479 million
Maintenance CapEx (4% of revenue): $686.4 million
Growth CapEx: $792.6 million
2024
CapEx: $6,551 million
Maintenance CapEx (4% of revenue): $1,613.5 million
Growth CapEx: $4,937.5 million
That’s a staggering difference. And it shows just how much of Novo’s current CapEx load is aimed at expanding its future earnings base – not just preserving the current one.
Keep in mind that that’s just an estimate (!), and I may be wildly off. I’m assuming that of the R&D spend in 2024 (16.2% of revenue), the majority is growth spend (12.2% of revenue). Maybe I’m too generous here. The industry is getting much more competitive and the larger CapEx may reflect exactly that; Novo NEEDS to spend more to keeep its current leading position in the space, and even then they may lose market share.
I’ll leave it to you to assess the exact % that is discretionary.
Why This Matters
If you subtract the full $6.5 billion in CapEx from cash flow, you’re effectively assuming Novo would still be spending that much even if it had zero interest in growth. But that’s clearly not the case.
Instead, by subtracting only the maintenance CapEx, we get a clearer picture of Novo’s underlying cash-generation engine – the cash the company could return to shareholders in a steady-state world.
And it’s not just theoretical. This distinction becomes critical in DCF (and other cash-based valuation) models, in terminal value assumptions, and in any situation where you need to estimate normalized margins or capital intensity. Failing to make this distinction risks underestimating free cash flow, overestimating capital intensity, and – worst of all – undervaluing businesses that are actually more efficient than they look.
Novo’s “true FCF” rises sharply once we stop penalizing it for investing in its own growth. But that’s only half the story…
Treating R&D Like CapEx: The Hidden Engine of Value Creation
If you're serious about understanding Novo Nordisk – or any pharmaceutical company, really – you can't just glance at R&D and move on. You need to interrogate it.
Because in pharma, R&D isn’t just an expense. It’s the economic equivalent of CapEx.
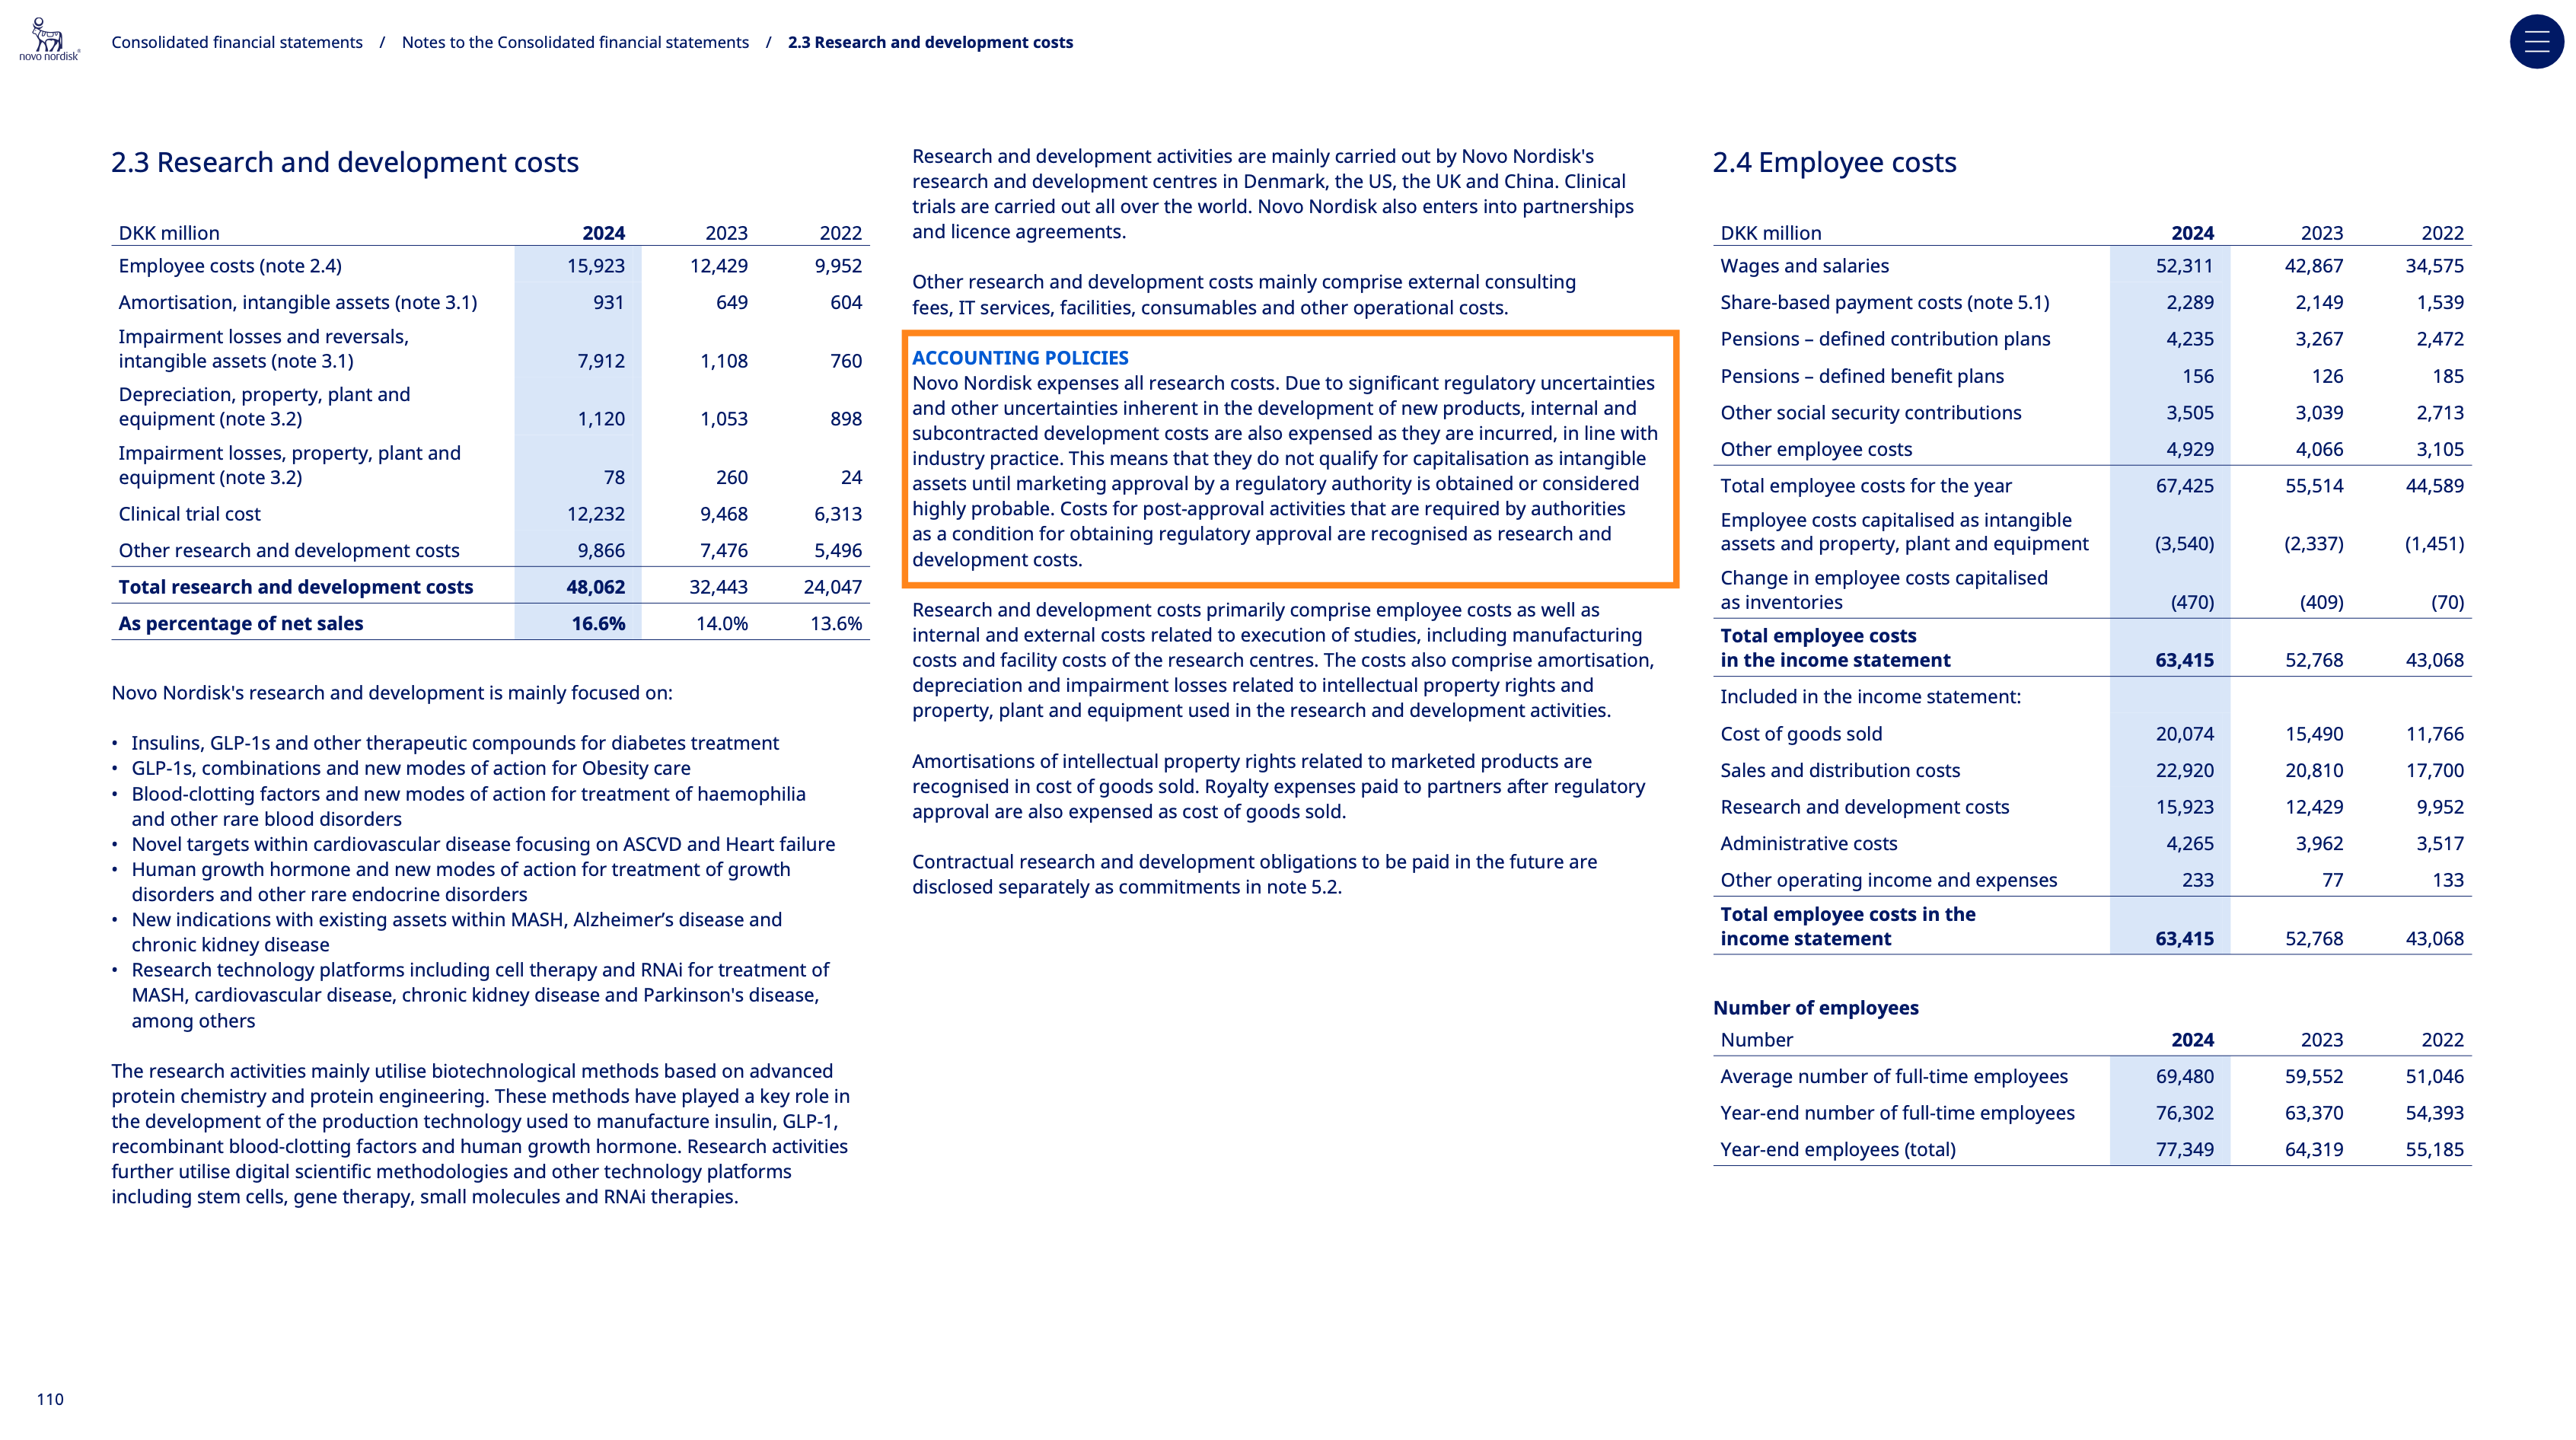
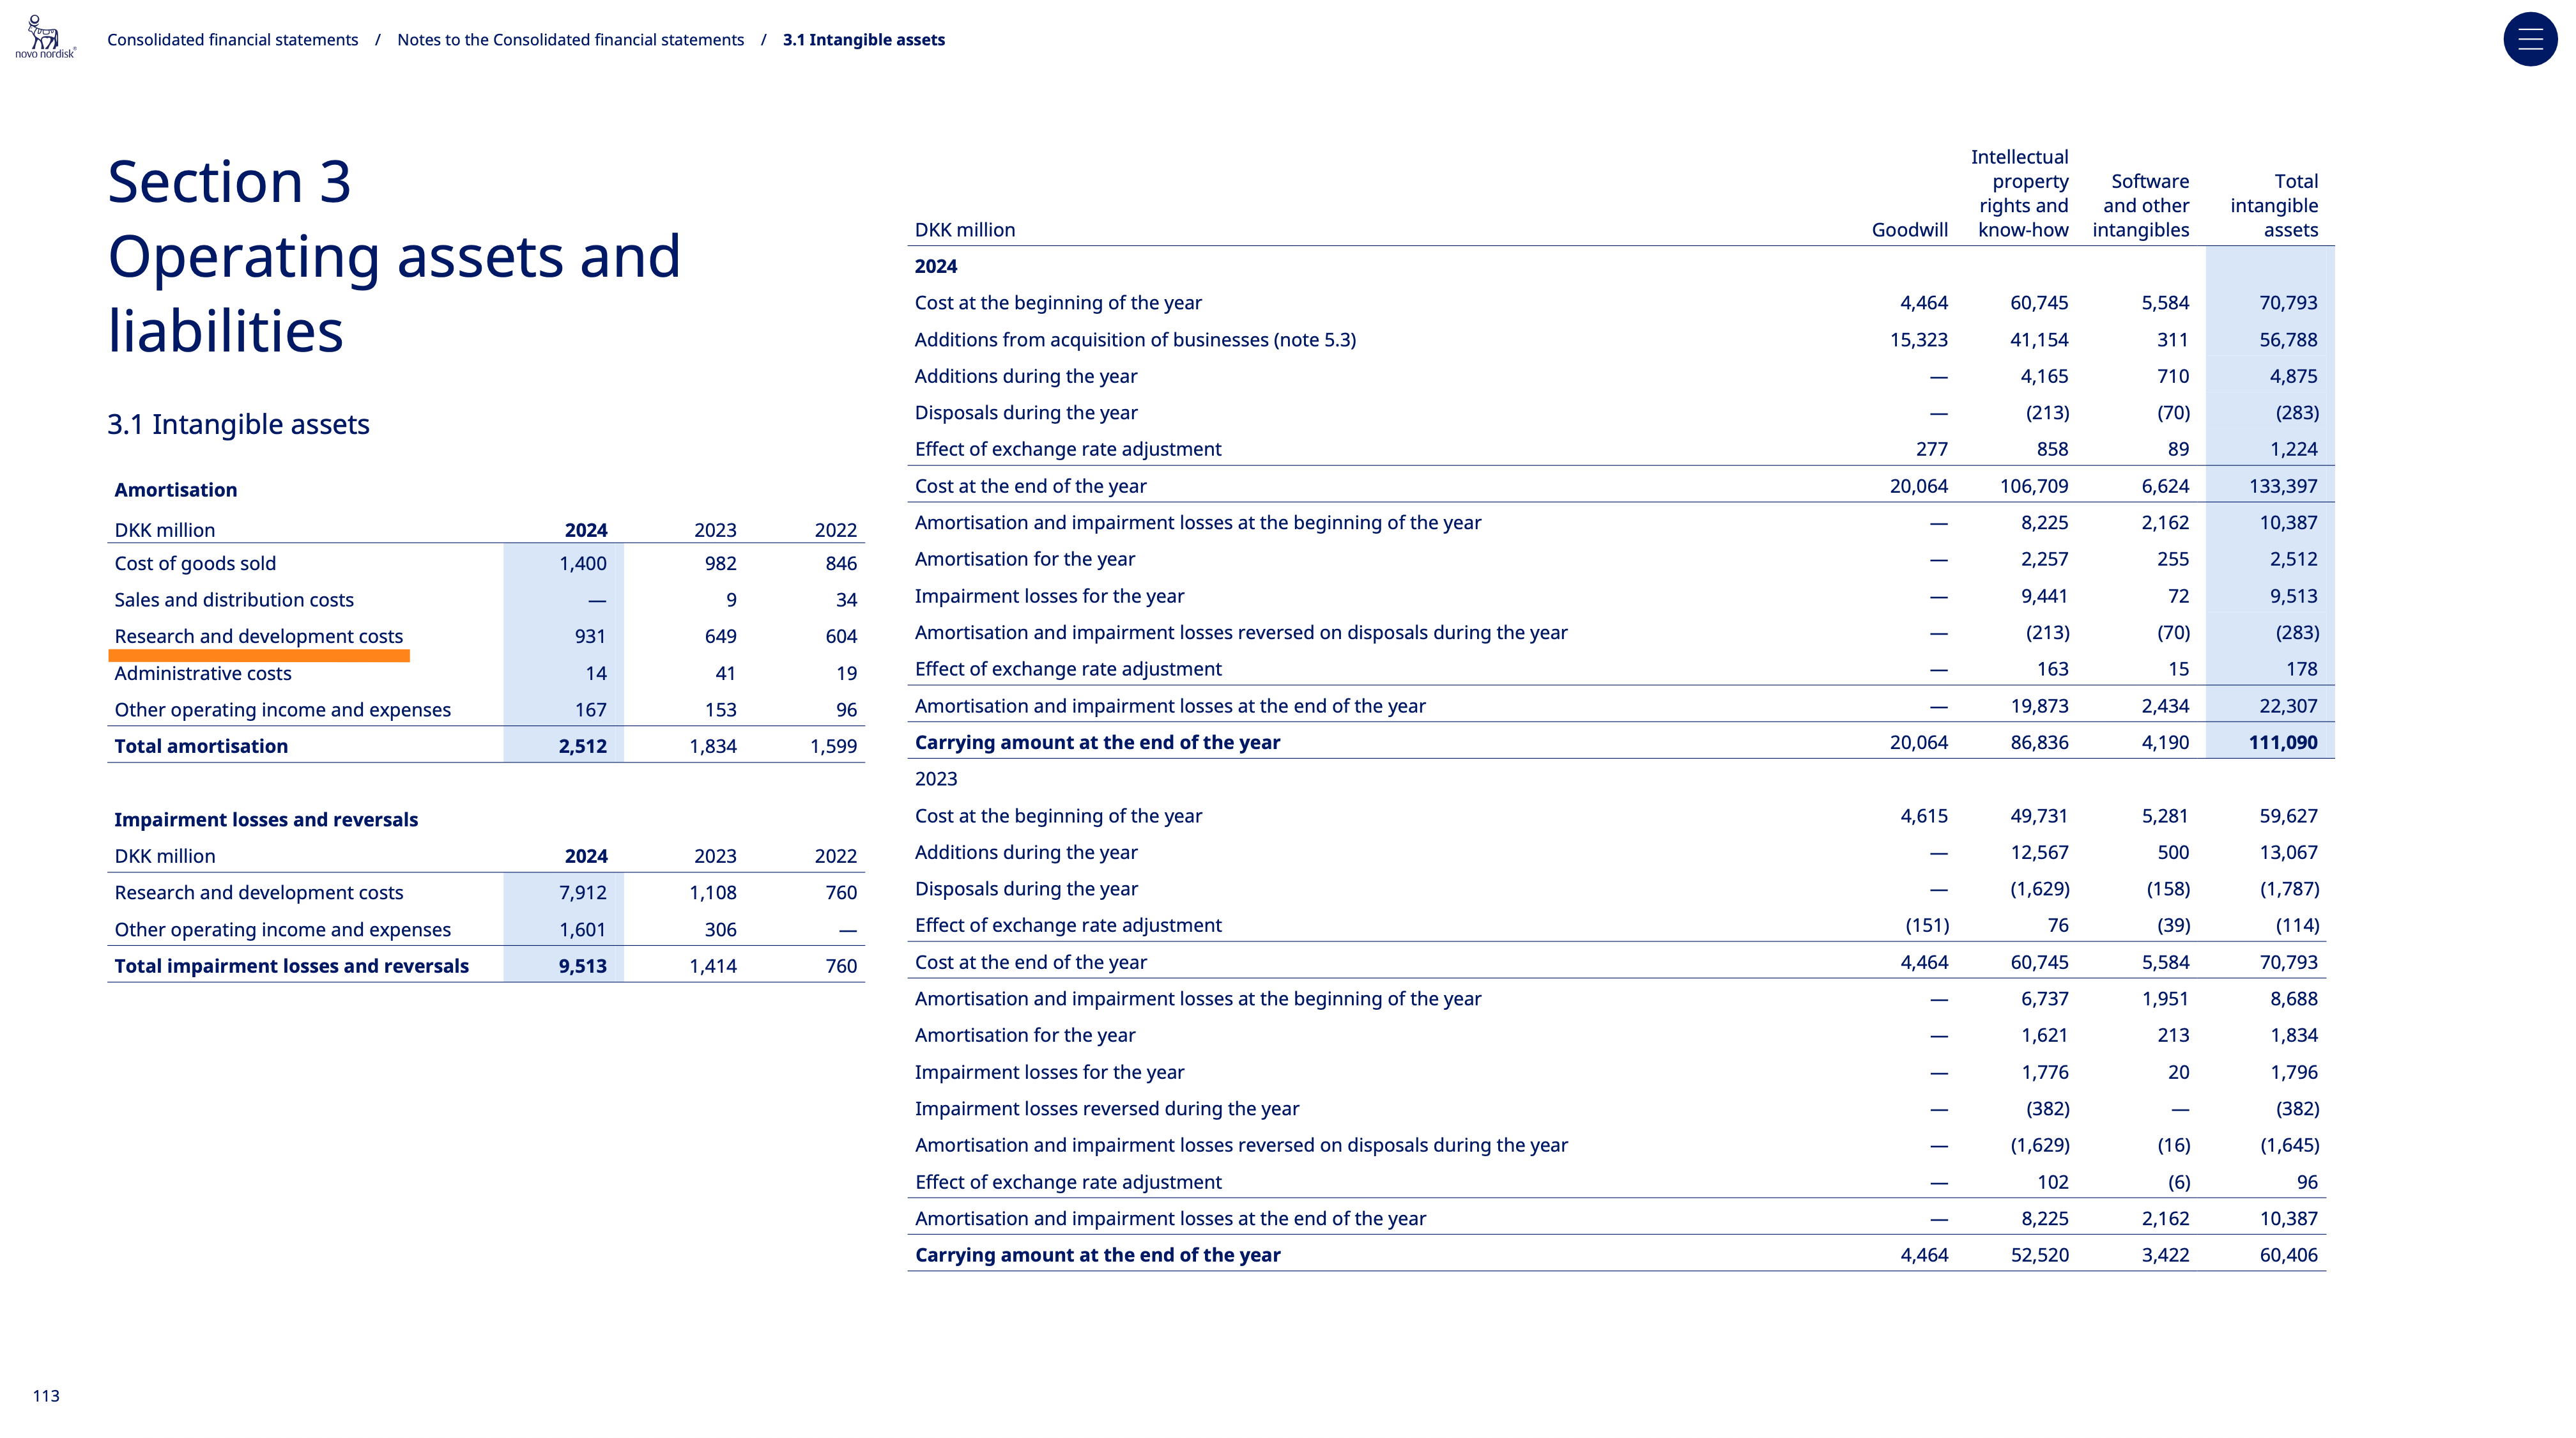
In fact, I'd argue that for Novo, R&D is the primary form of capital investment. It just doesn’t show up on the balance sheet (mostly). Instead, it’s expensed immediately “Novo Nordisk expenses all research costs”), hammering earnings and compressing reported FCF – even though the actual benefit might stretch out over 10 or 15 years.
This is one of the core accounting mismatches in today’s intangible-heavy economy – a theme that thinkers like Michael Mauboussin have hammered on for years. When you invest in a factory, it gets capitalized and depreciated slowly. But when you invest in a new drug, a machine learning model, or a customer base, it gets expensed. That’s not economics – that’s accounting convention.
R&D as CapEx: A Mauboussin-Inspired Adjustment
Let’s zoom in on Novo’s numbers:
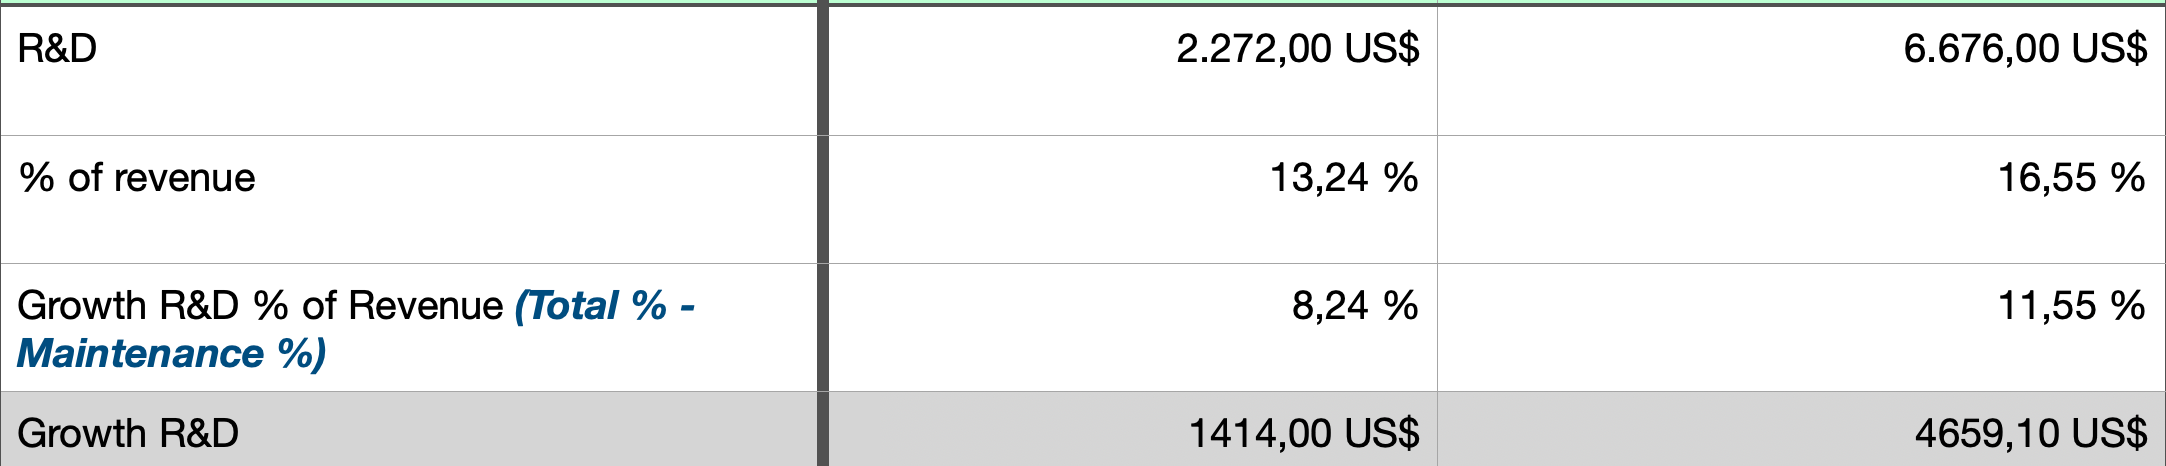
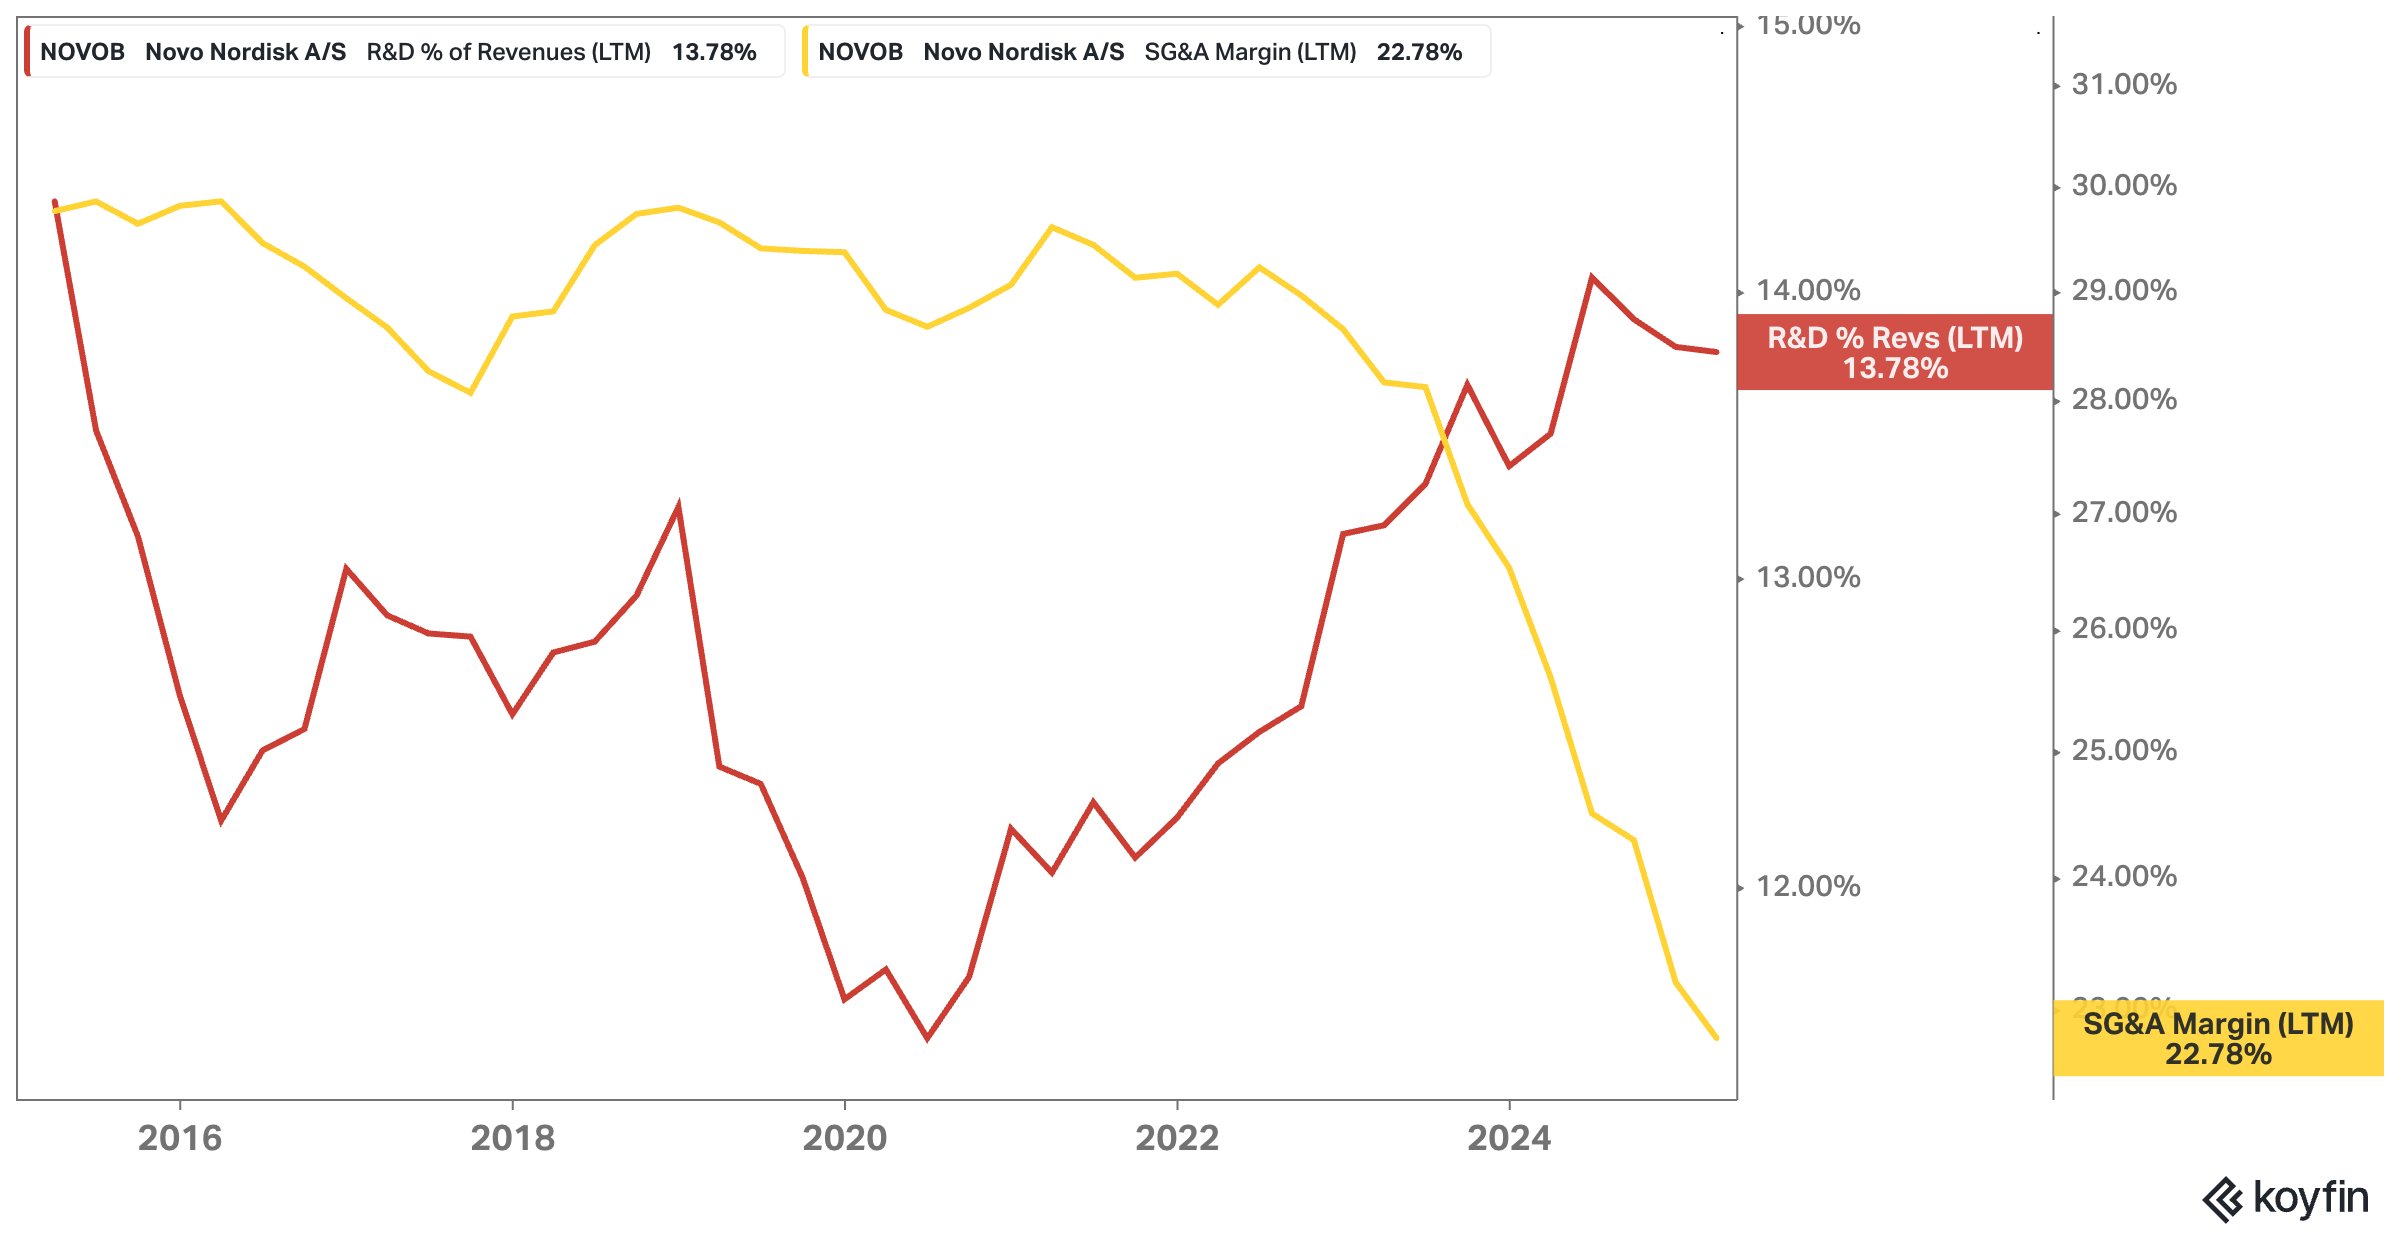
2018 R&D Spend: $2,272 million (13.2% of revenue)
2024 R&D Spend: $6,676 million (16.6% of revenue)
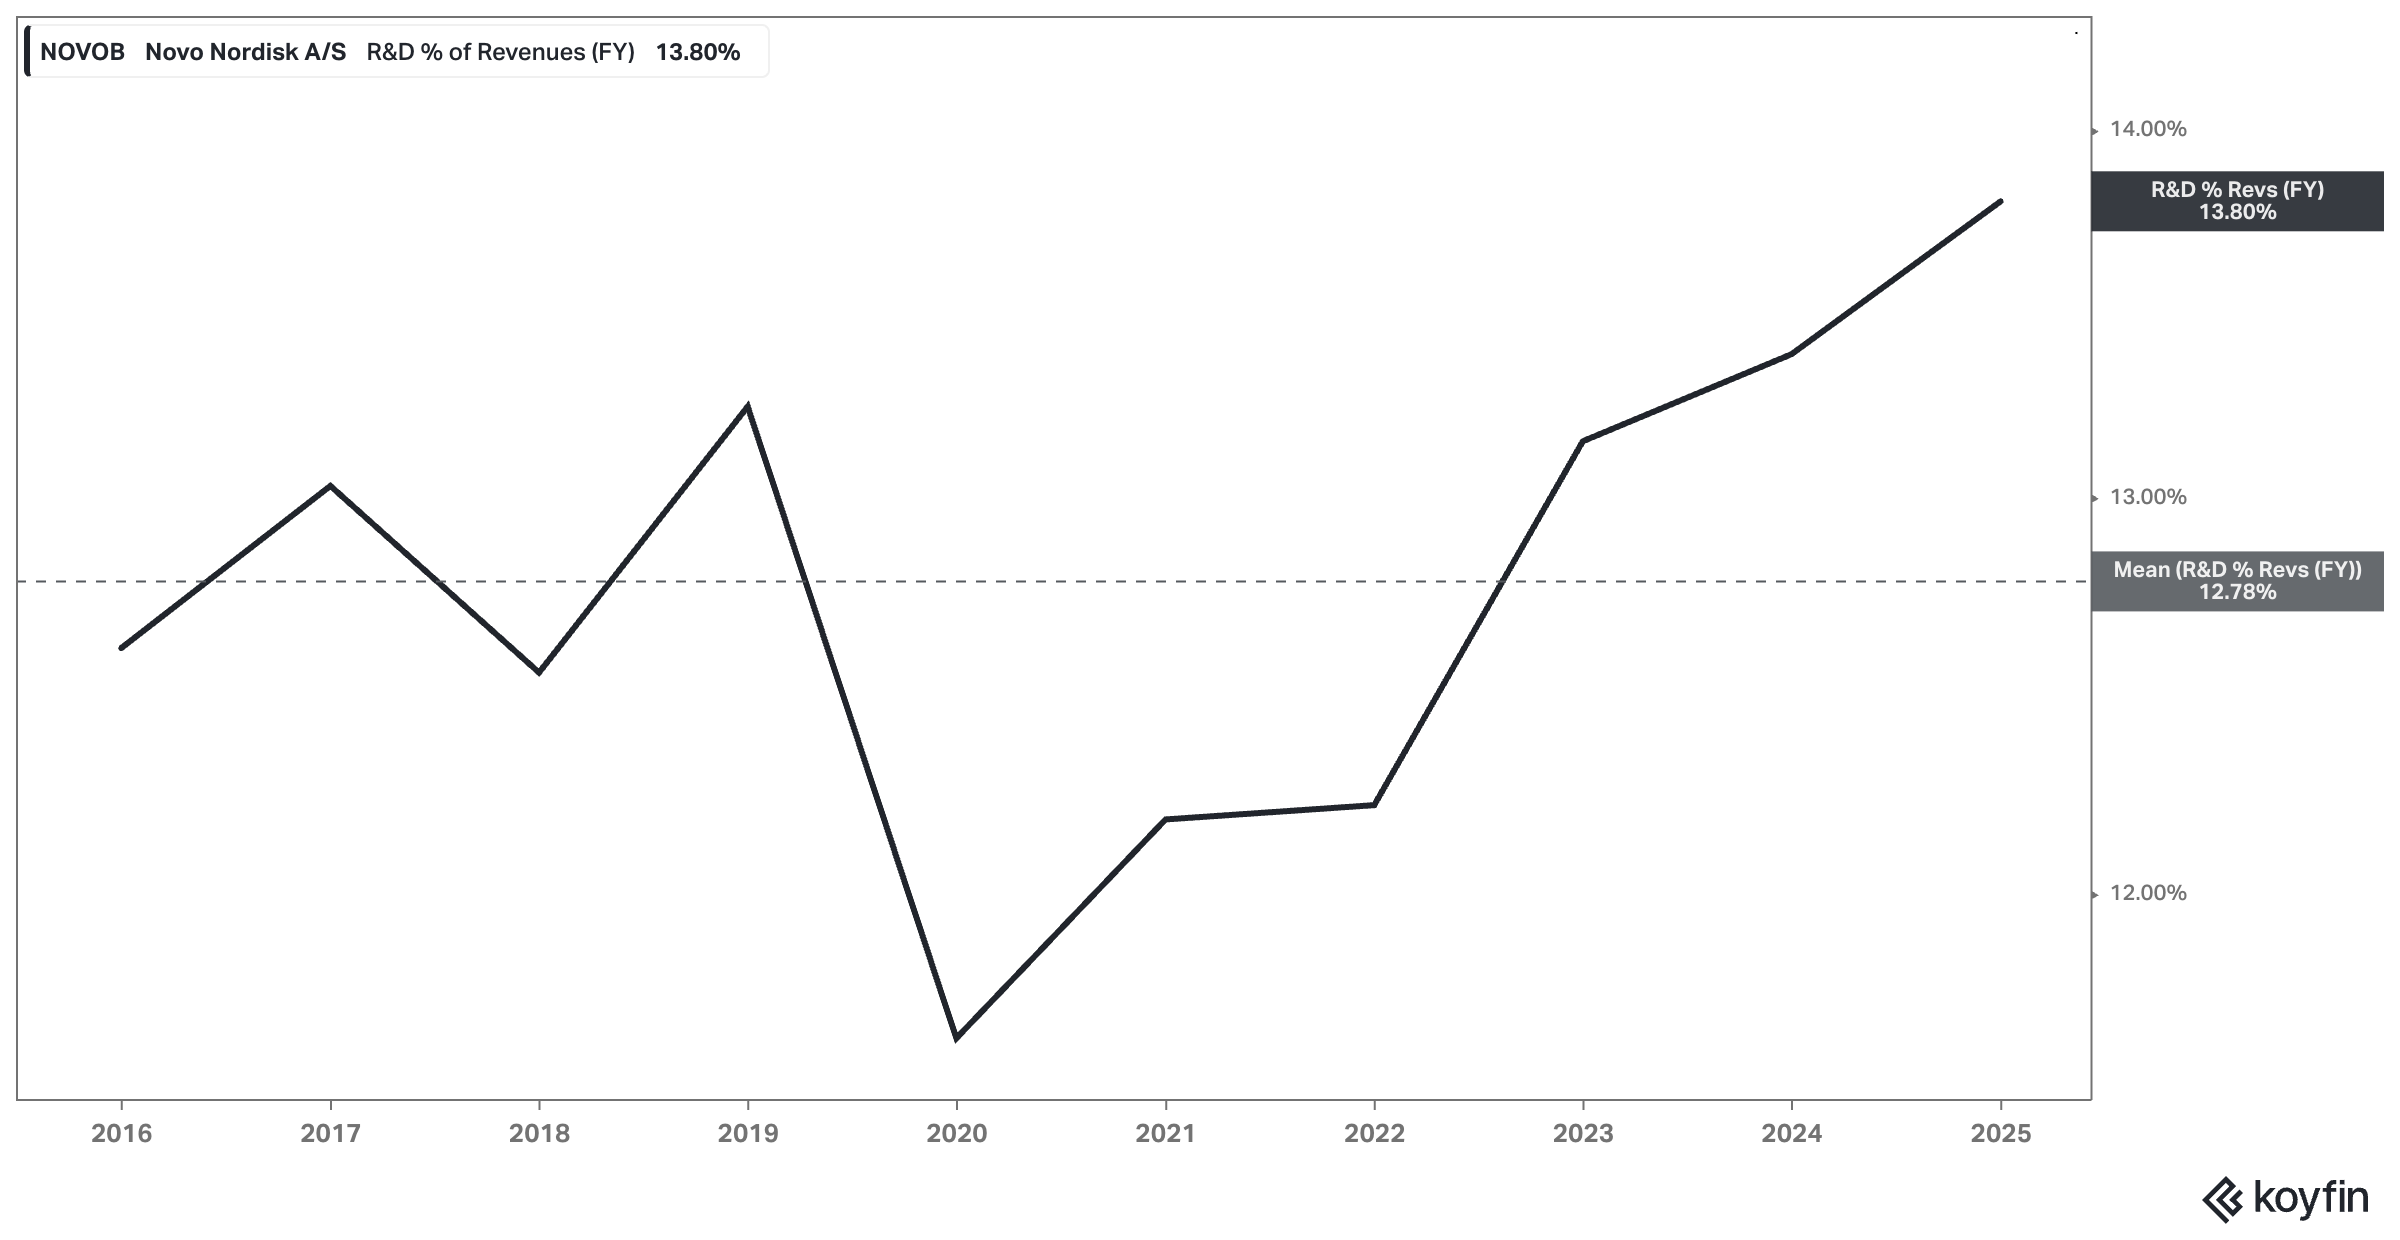
That’s a decently sized ramp (the 10Y mean % of revenue that is R&D related is around 13%) – but it reflects the strategic pivot the company is making. It’s doubling down on obesity, cardiometabolic disease, and other GLP-1-related indications. It’s also building out RNA platforms and exploring Alzheimer’s and NASH. These aren’t marginal tweaks. This is pipeline creation – the biotech equivalent of a multi-billion-dollar buildout.
And just like we do with CapEx, we need to split this investment into two buckets:
Maintenance R&D – the cost of defending the current product suite (e.g. biosimilar defenses, post-market trials, incremental reformulations)
Growth R&D – everything aimed at expanding the future revenue base (e.g. new indications, new molecules, new platforms)
My estimate? For Novo, 5% of revenue might be a good proxy for maintenance R&D – a level needed to protect the moat but not extend it. That means the rest – 8.2% in 2018, and 11.6% in 2024 – can be viewed as a growth investment and added back to FCF in the same spirit we add back growth CapEx.
The numbers above are not a rounding error. They represent a fundamental shift in how we interpret Novo’s cash flow.
From Expense to Investment
Now let’s pull back for a second.
What happens when you adjust reported FCF for the growth portion of R&D?
2018 SBC-adj. FCF: $5,304 million
→ Add back Growth R&D: +$1,414 million
→ R&D-adjusted FCF: $6,718 million2024 SBC-adj. FCF: $9,934 million
→ Add back Growth R&D: +$4,659 million
→ R&D-adjusted FCF: $14,593 million
But remember – we’ve already adjusted for growth CapEx too. When you combine both R&D and CapEx adjustments, you arrive at what I consider the most meaningful number in this whole exercise:
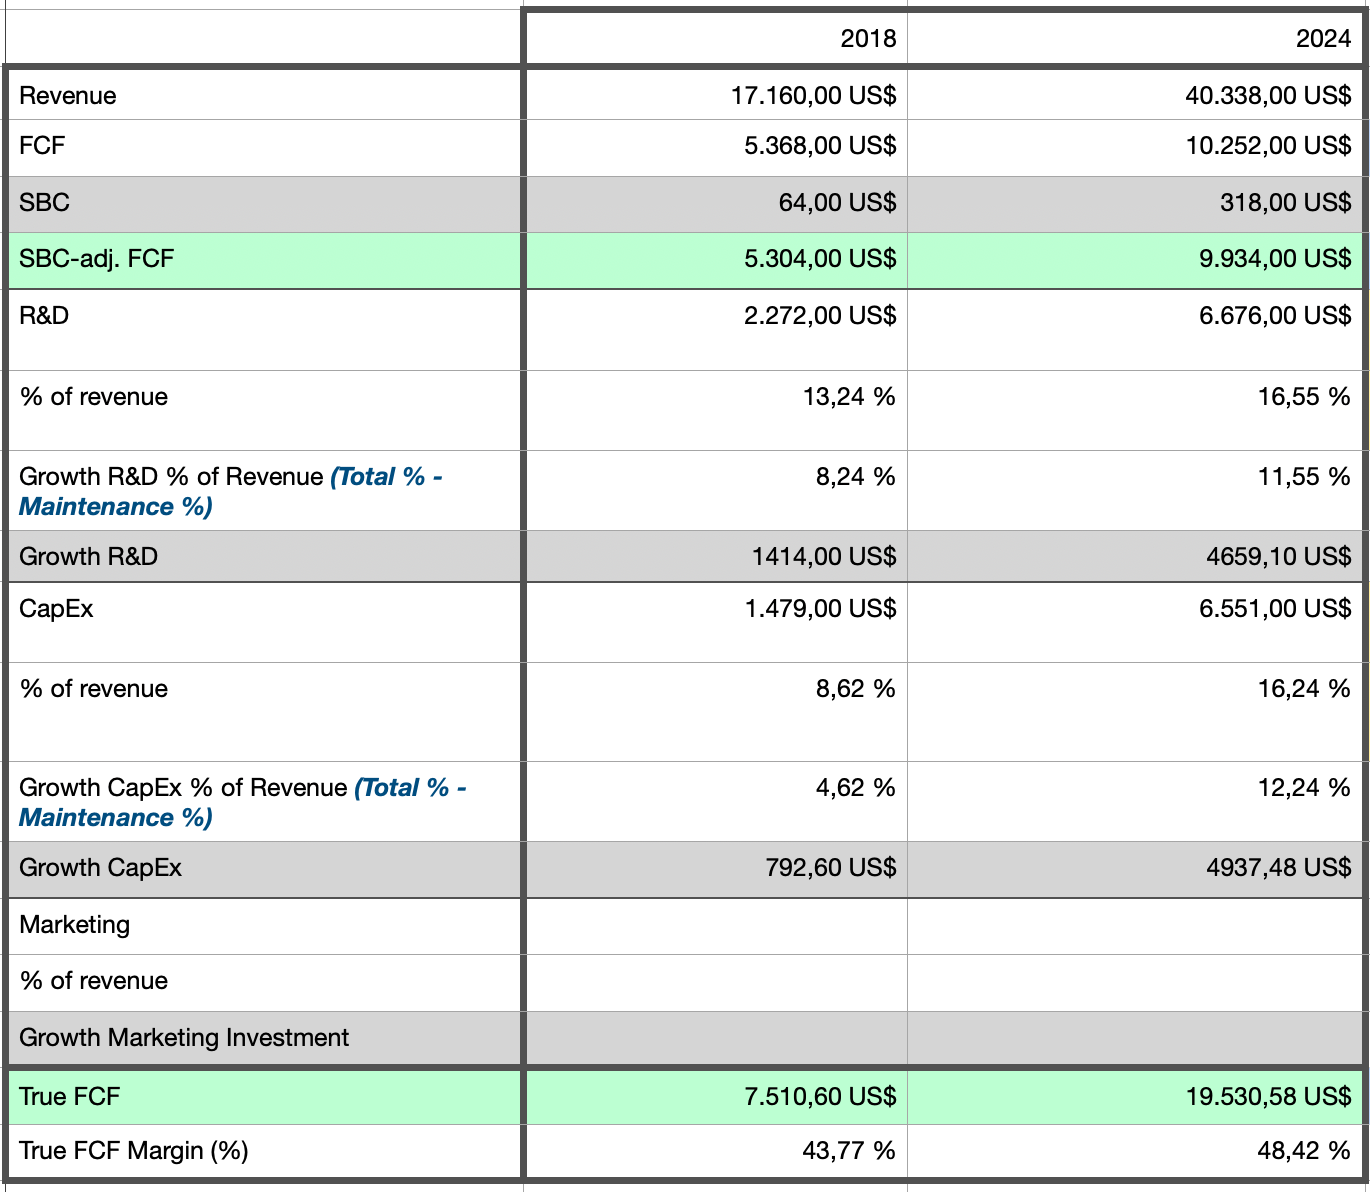
True FCF 2018: $7,510.60 million
True FCF 2024: $19,530.58 million
Incremental True FCF: $12,019.98 million
With that, we’re looking at a true FCF margin of nearly 48.4% in 2024 – up from 43.8% in 2018 and significantly exceeding the reported FCF margins. This is what the distributable engine looks like once you strip away the artificial weight of growth investment.
Treating R&D as CapEx is more than just a modeling quirk. It changes how you think about:
Valuation multiples (e.g. P/FCF)
Return on reinvested capital (we’ll get to this in the ROIIC follow-up)
Capital allocation strategy (how much runway is left for Novo to reinvest at high returns?)
And crucially, it highlights that GAAP losses aren’t always bad. In fact, Mauboussin’s own work shows that so-called “GAAP-losers” – companies reporting low or negative earnings due to expensed growth investments – outperform over the long run. Why? Because they’re building the future while others are milking the present.
Novo’s not a GAAP-loser, but the principle still applies. Its reported margins – impressive as they are – understate what’s really going on underneath. The growth investment is heavier than it looks. But so is the cash-generating engine.
Before we dive back in, a quick note…
Want to compound your knowledge – and your wealth? Compound with René is for investors who think in decades, not headlines. If you’ve found value here, subscribing is the best way to stay in the loop, sharpen your thinking, avoid costly mistakes, and build long-term success – and to show that this kind of long-term, no-hype investing content is valuable.
Thank you for your support!
A Brief Note on Marketing and Sales – Growth or Maintenance?
Now, before we pull it all together, there’s one more potential adjustment worth acknowledging: sales and marketing.
Just like R&D, sales and marketing can straddle the line between maintenance and growth. Customer acquisition campaigns, brand-building initiatives, market expansion efforts – these are very much growth-oriented intangible investments. And in many industries, especially pharma, marketing spend can carry a long tail of impact.
That said, I’ve chosen not to adjust for marketing in this exercise – and deliberately so. Novo Nordisk doesn’t break out its marketing spend from its broader SG&A line, nor does it distinguish between retention vs acquisition efforts. Without that granularity, any adjustment here would be too speculative; and I realize that I’m already making a good bit of adjustments in Novo Nordisk’s favor.
Hence, I want to err on the side of conservatism. The last thing I want is to overstate distributable cash by getting too aggressive with assumptions that aren’t backed by at least some company-level context or long-term average benchmarks, leading to potentially massive valuation errors.
So yes, there’s an argument to be made that part of Novo’s sales and marketing is a growth investment. But for now, I’m leaving it out – which means the “true FCF” figures we’re working with are likely still a touch understated. And I’m perfectly comfortable with that.
But I’m also very well aware that if my growth-vs-maintenance estimates are off, my “true FCF” figure might overstate the earnings power too!
Next, I’ll pull everything together and look at the full “true FCF” picture – how it’s changed over time, what that says about the business, and why this lens gives investors a far better framework for thinking about Novo Nordisk’s future.
Putting It All Together: The Economics of True FCF
So what do we get when we stop treating growth investments like sins and start reconstructing free cash flow in a way that mirrors economic reality?
A very different picture of Novo Nordisk’s cash-generating power.
Let’s recap the key building blocks of that reconstruction:
SBC is a real expense – so we deduct it from reported FCF.
Growth CapEx isn’t mandatory – so we add it back, only subtracting what’s truly needed to maintain the current operational base.
R&D is a form of CapEx – so we treat only a portion (5% of revenue) as maintenance, and the rest as a strategic, growth-oriented investment.
Once these adjustments are made, the difference is staggering. Here’s how the numbers shake out:
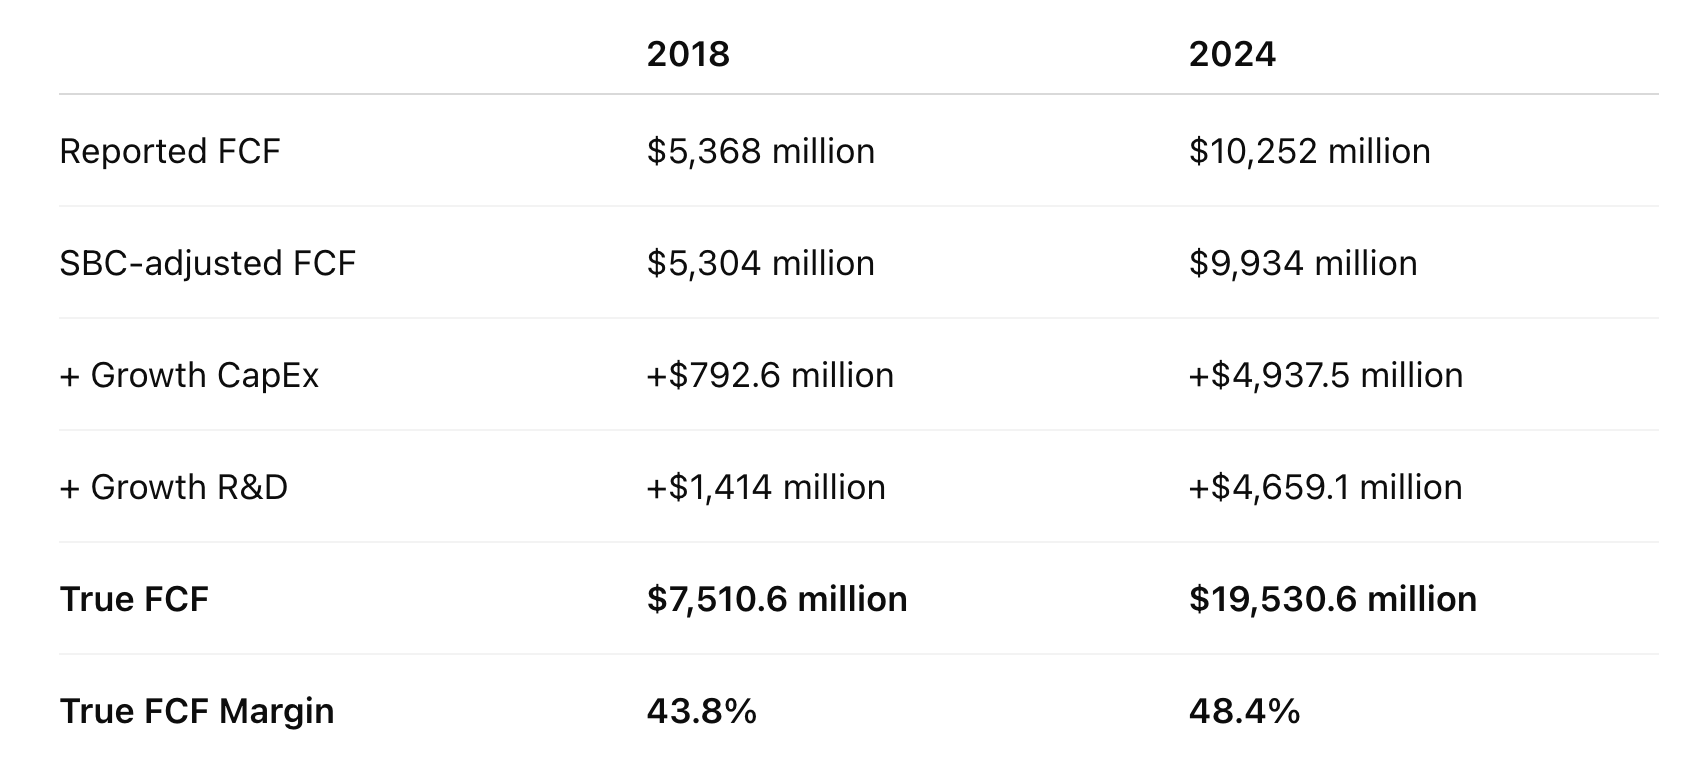
That’s a true FCF increase of over $12 billion in just six years – and a near 5-point expansion in free cash flow margins.
The implied message here is powerful: Novo’s core economics are getting stronger, even as the company leans into aggressive growth.
Based on Novo’s current share price and market cap, the stock trades on a P/true-FCF multiple of just 11.5x.
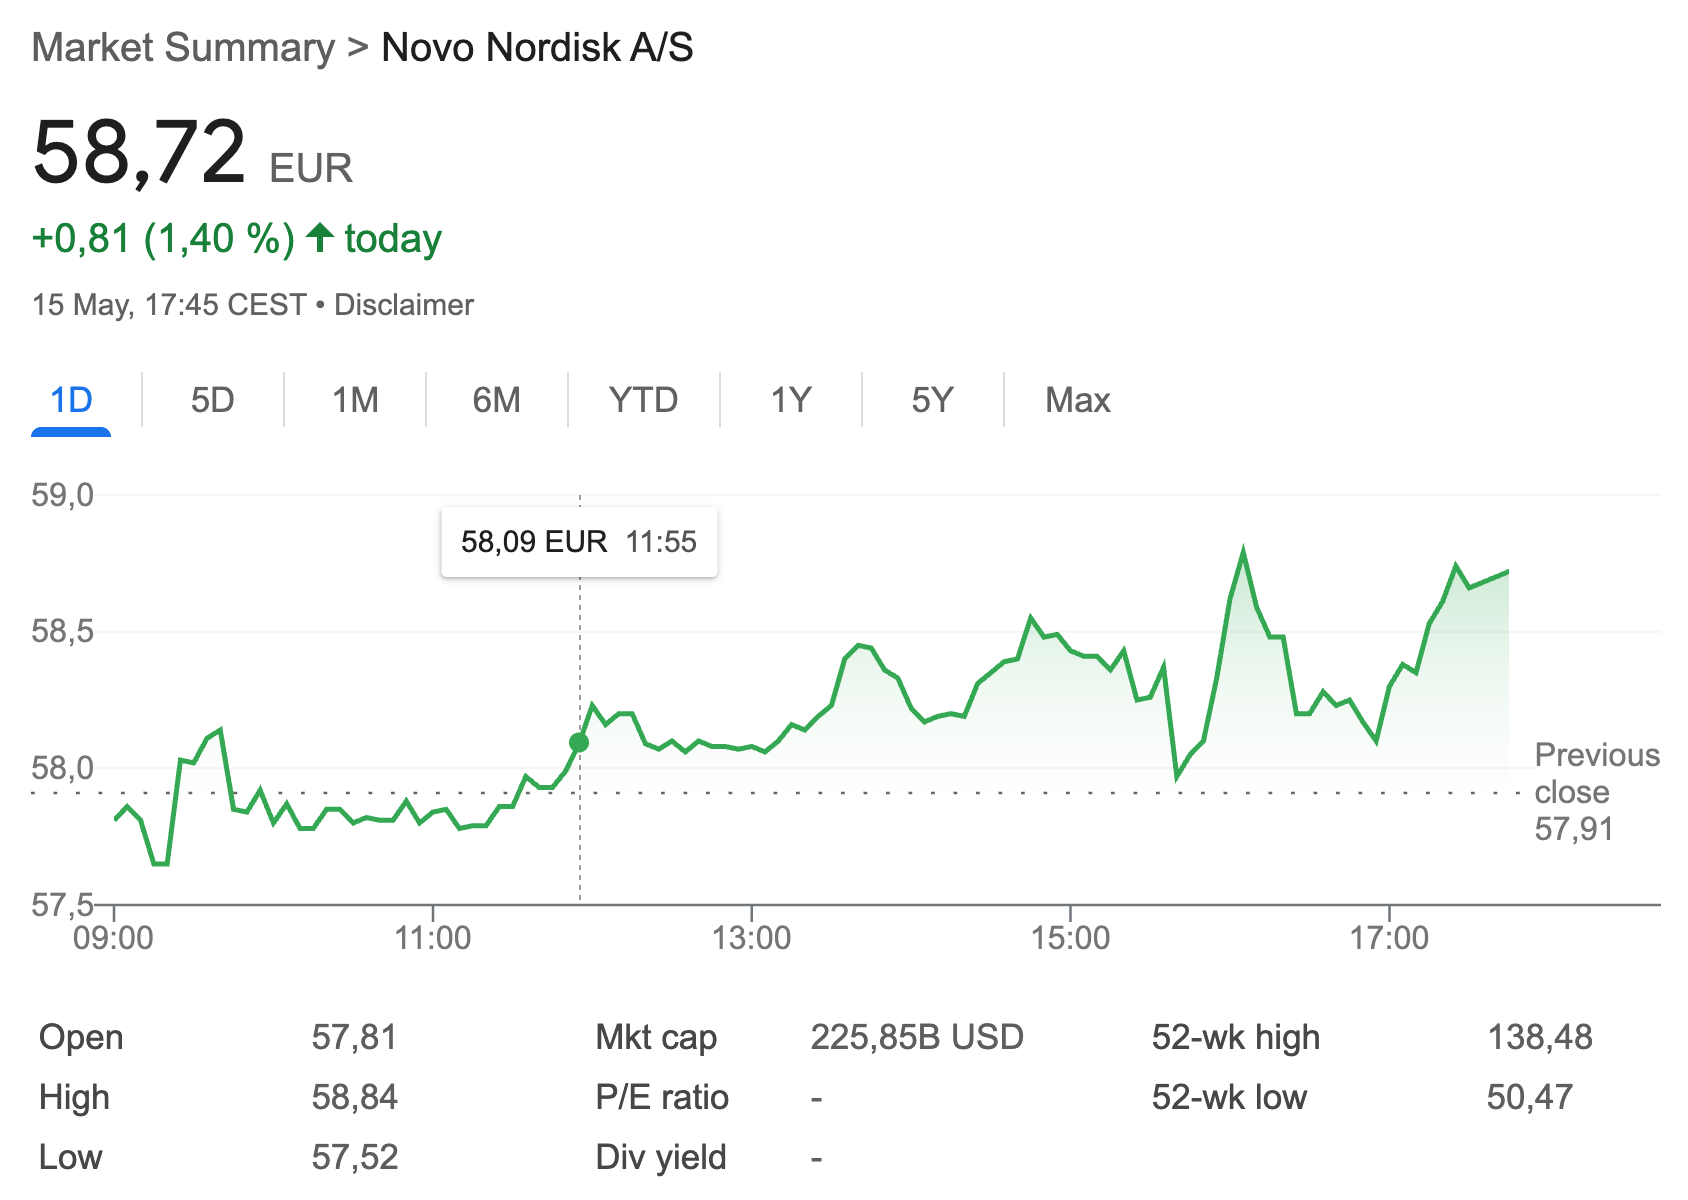
That’s remarkably cheap for a business with margins like these, a dominant market position, and clear secular tailwinds. But – and this is important – a word of caution is (once again) warranted here. While regular FCF may be too conservative for understanding economic value, my adjusted “true FCF” could still be overstating distributable cash if I’ve underestimated the maintenance portion of CapEx or R&D. These are judgment-based splits. And while I think my assumptions are reasonable, they are still assumptions. It’s always smarter to think in ranges, not single-point estimates. The approach I’ve outlined here represents one framework – not the only valid one. Sensitivity analysis, alternative scenarios, and more granular disclosures (if we ever get them) are all tools investors should use to refine this picture.
What Does This Tell Us About Novo Nordisk?
At a high level, it confirms what many long-term holders already suspect: this is a compounder masquerading as a fairly capital-intensive incumbent. Yes, it builds factories. Yes, it runs a vertically integrated supply chain. But the real driver of economic value is intangible – and mostly invisible in traditional accounting:
Proprietary molecules and platforms under development through R&D
Pipeline expansion into adjacent indications
Durable, brand-based pricing power
And potentially, network effects between delivery platforms and patients/physicians
This also helps to reframe Novo’s capital allocation strategy. From the outside, $6.5 billion in CapEx might look like a red flag – an “escalation” in capital intensity. But once you distinguish between maintenance and growth, the story flips. Novo isn’t becoming more bloated – it’s becoming more aggressive in its growth ambitions.
So what’s the key takeaway here?
If Novo Nordisk stopped growing tomorrow – froze its pipeline, halted its CapEx expansion, and simply maintained its current product suite – it could reasonably generate close to $19.5 billion in true FCF, with a near-50% margin. That’s an astonishing number, and I’m not sure how sustainable that is. But it speaks to the strength of the company’s competitive position (as of today).
My lack of conviction regarding the sustainability of the current margin profile is one of the reasons why I haven’t initiated a position yet, despite the seemingly cheap price.
Disclaimer: The analysis presented in this blog may be flawed and/or critical information may have been overlooked. The content provided should be considered an educational resource and should not be construed as individualized investment advice, nor as a recommendation to buy or sell specific securities. I may own some of the securities discussed. The stocks, funds, and assets discussed are examples only and may not be appropriate for your individual circumstances. It is the responsibility of the reader to do their own due diligence before investing in any index fund, ETF, asset, or stock mentioned or before making any sell decisions. Also double-check if the comments made are accurate. You should always consult with a financial advisor before purchasing a specific stock and making decisions regarding your portfolio.
But We're Not Done Yet!
This exercise has laid the foundation. We've stripped away noise, made growth investment assumptions explicit, and gotten to a clean, distribution-ready free cash flow figure.
But if we want to really understand what Novo’s doing with that cash – how effectively it’s reinvesting it – we need to go a step further. In my follow-up post (hopefully dropping relatively soon), I’ll look at ROIIC (Return on Incremental Invested Capital), based on this adjusted framework. That’s where we test whether Novo is truly earning high returns on its growth spend – or just spending for the sake of scale.
Because free cash flow alone doesn’t guarantee value creation. What matters is what a company does with it.
Take care!
I was just looking at this company, so this deep dive is very timely. I was thinking about things like the strange situation with "compounders", or whatever they are called, making legal knockoffs of the weight drugs. Will oral weight drugs happen and take off? Will Novo be the one to make them. This way of thinking about R&D and capex as growth engines and not just an expense is interesting. As a slight counter: as a company grows wealthy, it has more money to throw at new ideas. Is it more successful at picking the new ideas? Will the research pan out, just because more resources are going towards it. I would point towards Meta and the buckets it has thrown at virtual reality, which still seems to have as much practical application as crypto at this point. I don't know how to make a paragraph break in a comment. Back to pharmaceutical companies, the industry has a known issue of, we don't know how to figure out the next great products. Maybe AI augmented research will get us there. Suffice it to say, seeing Novo Nordisk as a significant percentage of its country's gdp is astounding. Your article was food for thought for this company and others. Awesome.
Regardless, growth capex or maintenance this would be included in a DCF so the value per share you will arrive at will be much lower than "hypothetical FCF". You can capitalise R&D, estimate useful life and then ammortise it, which will be a way better metric to uplift earnings (and FCF) but any cash investment into Capex or R&D needs to go through the cashflow statement.
For drugs there is no steady state FCF. You could try and model each drug's FCF and then value Novo on a SOTP basis. The steady state value that you would derive by assuming zero growth and using "maintenance R&D and Capex" would vastly overstate the value for a biotech. Usually drugs have a 20-year patent life + potential market exclusivity. Even to maintain a drug such as wegovy or ozempic would require R&D > assumed maintenance R&D.