

Dear Compounders,
Consider a striking market anomaly that routinely plays out across equity markets: established mega-cap corporations with stable operating businesses frequently see their stock prices swing by 100% or more over a twelve-to-eighteen-month window.
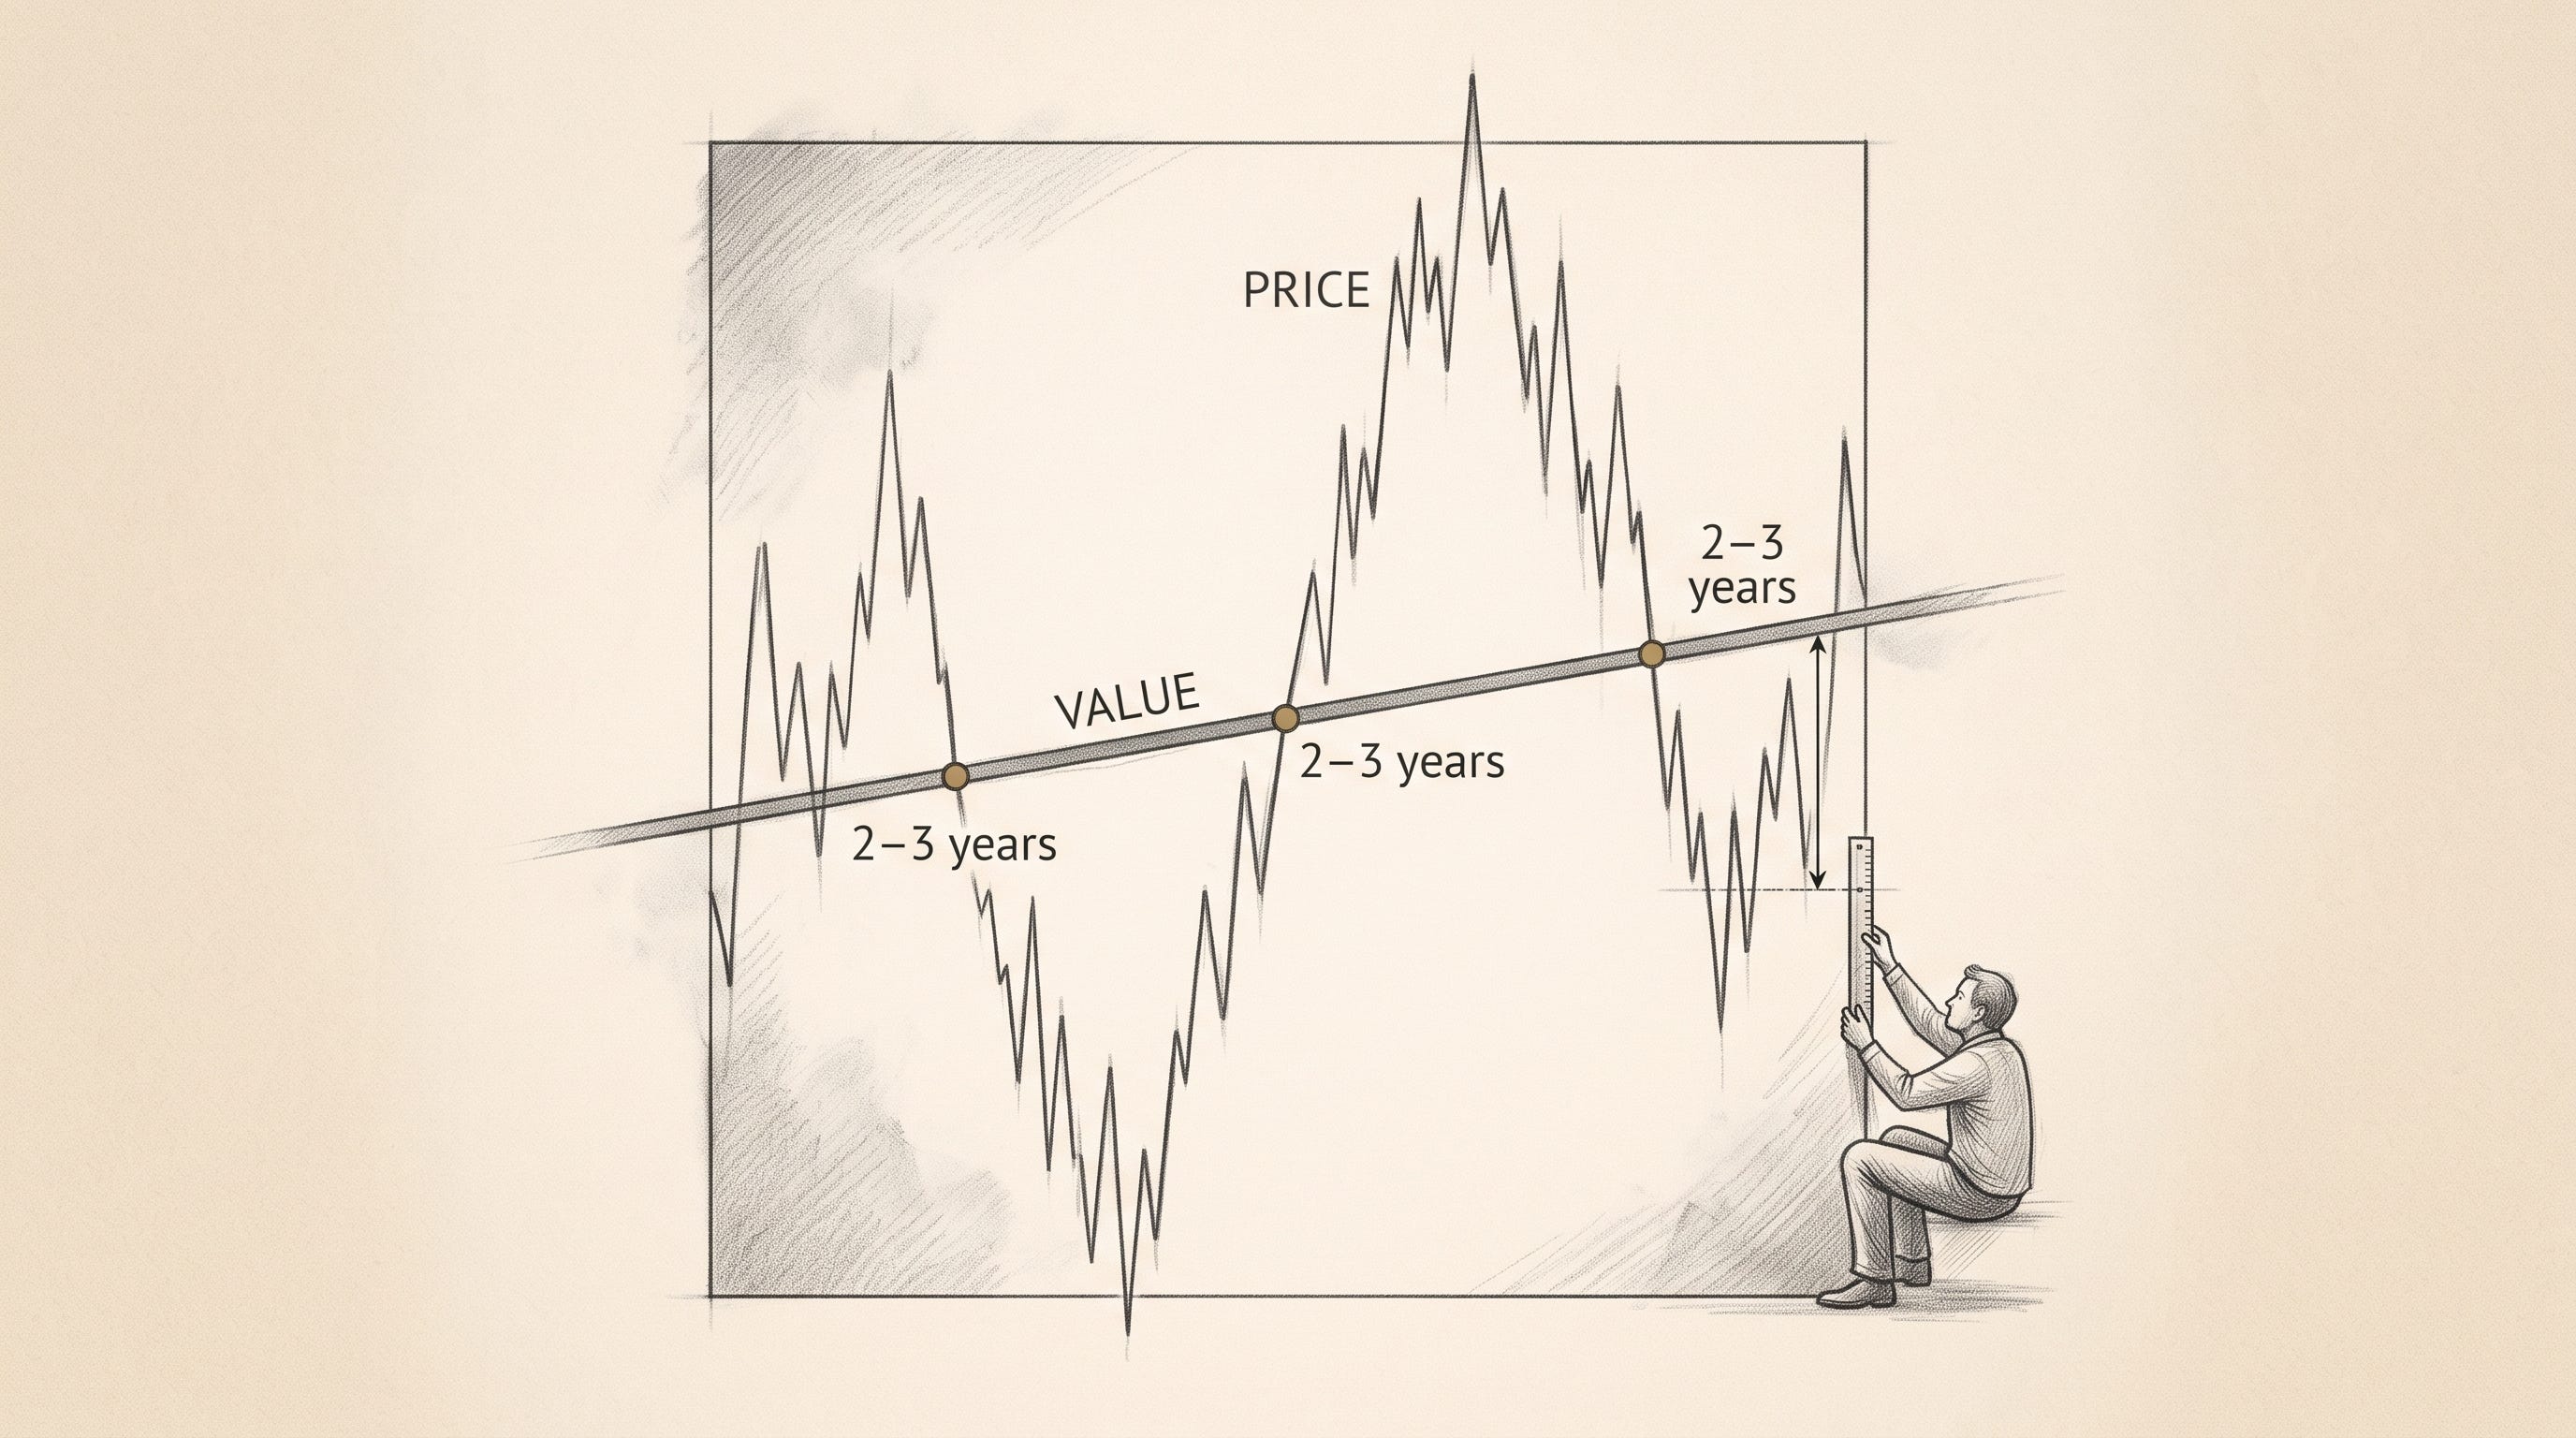
Fundamental enterprise value does not move that fast. Wal-Mart, Boeing, and Disney do not double or halve their intrinsic earning power in a single calendar year.
Yet institutional market participants continuously trade these equities at wildly divergent valuations.
That’s your opportunity.
I've been re-reading through Joel Greenblatt's class notes from his lectures (well, the notes on lessons #1-#7). I highly recommend reading them yourself if you haven’t already. Or if you have a limited amount of time, maybe my visual blueprint attached further below is a valuable alternative.
Anyway … Looking back at Joel Greenblatt’s legendary Columbia Business School lectures delivered two decades ago, the core friction in capital markets described above remains unchanged. Today, high-frequency algorithms and automated execution algorithms dominate trading venues, but human emotion still dictates asset allocation. Institutional money managers remain chained to benchmark tracking errors, quarterly career pressures, and macro forecasting noise. These structural rigidities create systemic mispricings. Short-term market prices diverge from intrinsic values, offering disciplined capital allocators an enduring edge.

“If you don’t want to ever miss a new “Visual Blueprint,” make sure you are subscribed and on the email list!”
My process for analyzing these class notes as a basis for today’s blueprint involved working through the first seven classes (#1-#7) of Greenblatt’s "Special Situation Investing" course taught at Columbia Business School, fifty-five pages of raw, unvarnished transcripts.

I dissected the exchanges between Joel Greenblatt, value fund manager Richard Pzena, and independent investor Bruce Newberg. My objective was to strip away historical market backdrop context and isolate the pure corporate finance mechanics. I focused on translating raw classroom dialogue into an actionable mental model framework, visualized as a blueprint.
Why Does Capital Structure Distort Traditional Valuation Ratios?
Topics covered include how conventional valuation metrics, which are still heavily relied on in 2026, like Price-to-Earnings (P/E) and Price-to-Sales (P/S) obscure economic reality because they ignore corporate capital structures and differential tax regimes. A company trading at a deceptively low P/E of 5x might carry significant debt liabilities, making its total enterprise acquisition cost far higher than an unlevered peer trading at 10x earnings.
To evaluate pre-tax operating yield accurately, institutional allocators must evaluate Pre-Tax Operating Profit (EBIT) relative to Enterprise Value (EV = Market Capitalization + Net Debt). Enterprise Value represents the true cost of acquiring the entire business outright. Comparing EBIT to EV establishes an apples-to-apples earnings yield across varying debt loads.
Measuring business quality requires an equally rigorous treatment of capital. Return on Invested Capital (ROIC) must be calculated as EBIT divided by Tangible Capital, defined specifically as Net Working Capital (NWC) plus Net Fixed Assets (NFA). Goodwill must be removed from the capital base entirely. Goodwill represents historical, sunk acquisition prices paid in the past, rather than the ongoing tangible capital required to run the operating business today.
Furthermore, cash flow analysis requires scrubbing raw EBITDA. Depreciation represents actual physical asset decay. Investors must isolate Maintenance Capital Expenditures (MCX) – the spending required strictly to preserve existing operational capabilities – from expansionary growth expenditures. True normalized operating cash flow equals EBITDA minus MCX. Comparing this normalized pre-tax yield against a conservative hurdle rate anchored by 10-year Treasury yields (utilizing a minimum 6% baseline floor) establishes an objective hurdle for capital deployment.
Can Corporate Profitability Escape the Laws of Competitive Gravity?
The second core framework centers on corporate mean reversion. When grouping equities by Return on Equity (ROE), high-profitability companies experience deteriorating returns over a five-year cycle as competitors enter lucrative sectors to capture excess profits. Conversely, low-profitability companies undergo capacity rationalization, cost restructurings, management changes, and industry consolidation that drive returns back up toward the 10% to 12% corporate average.
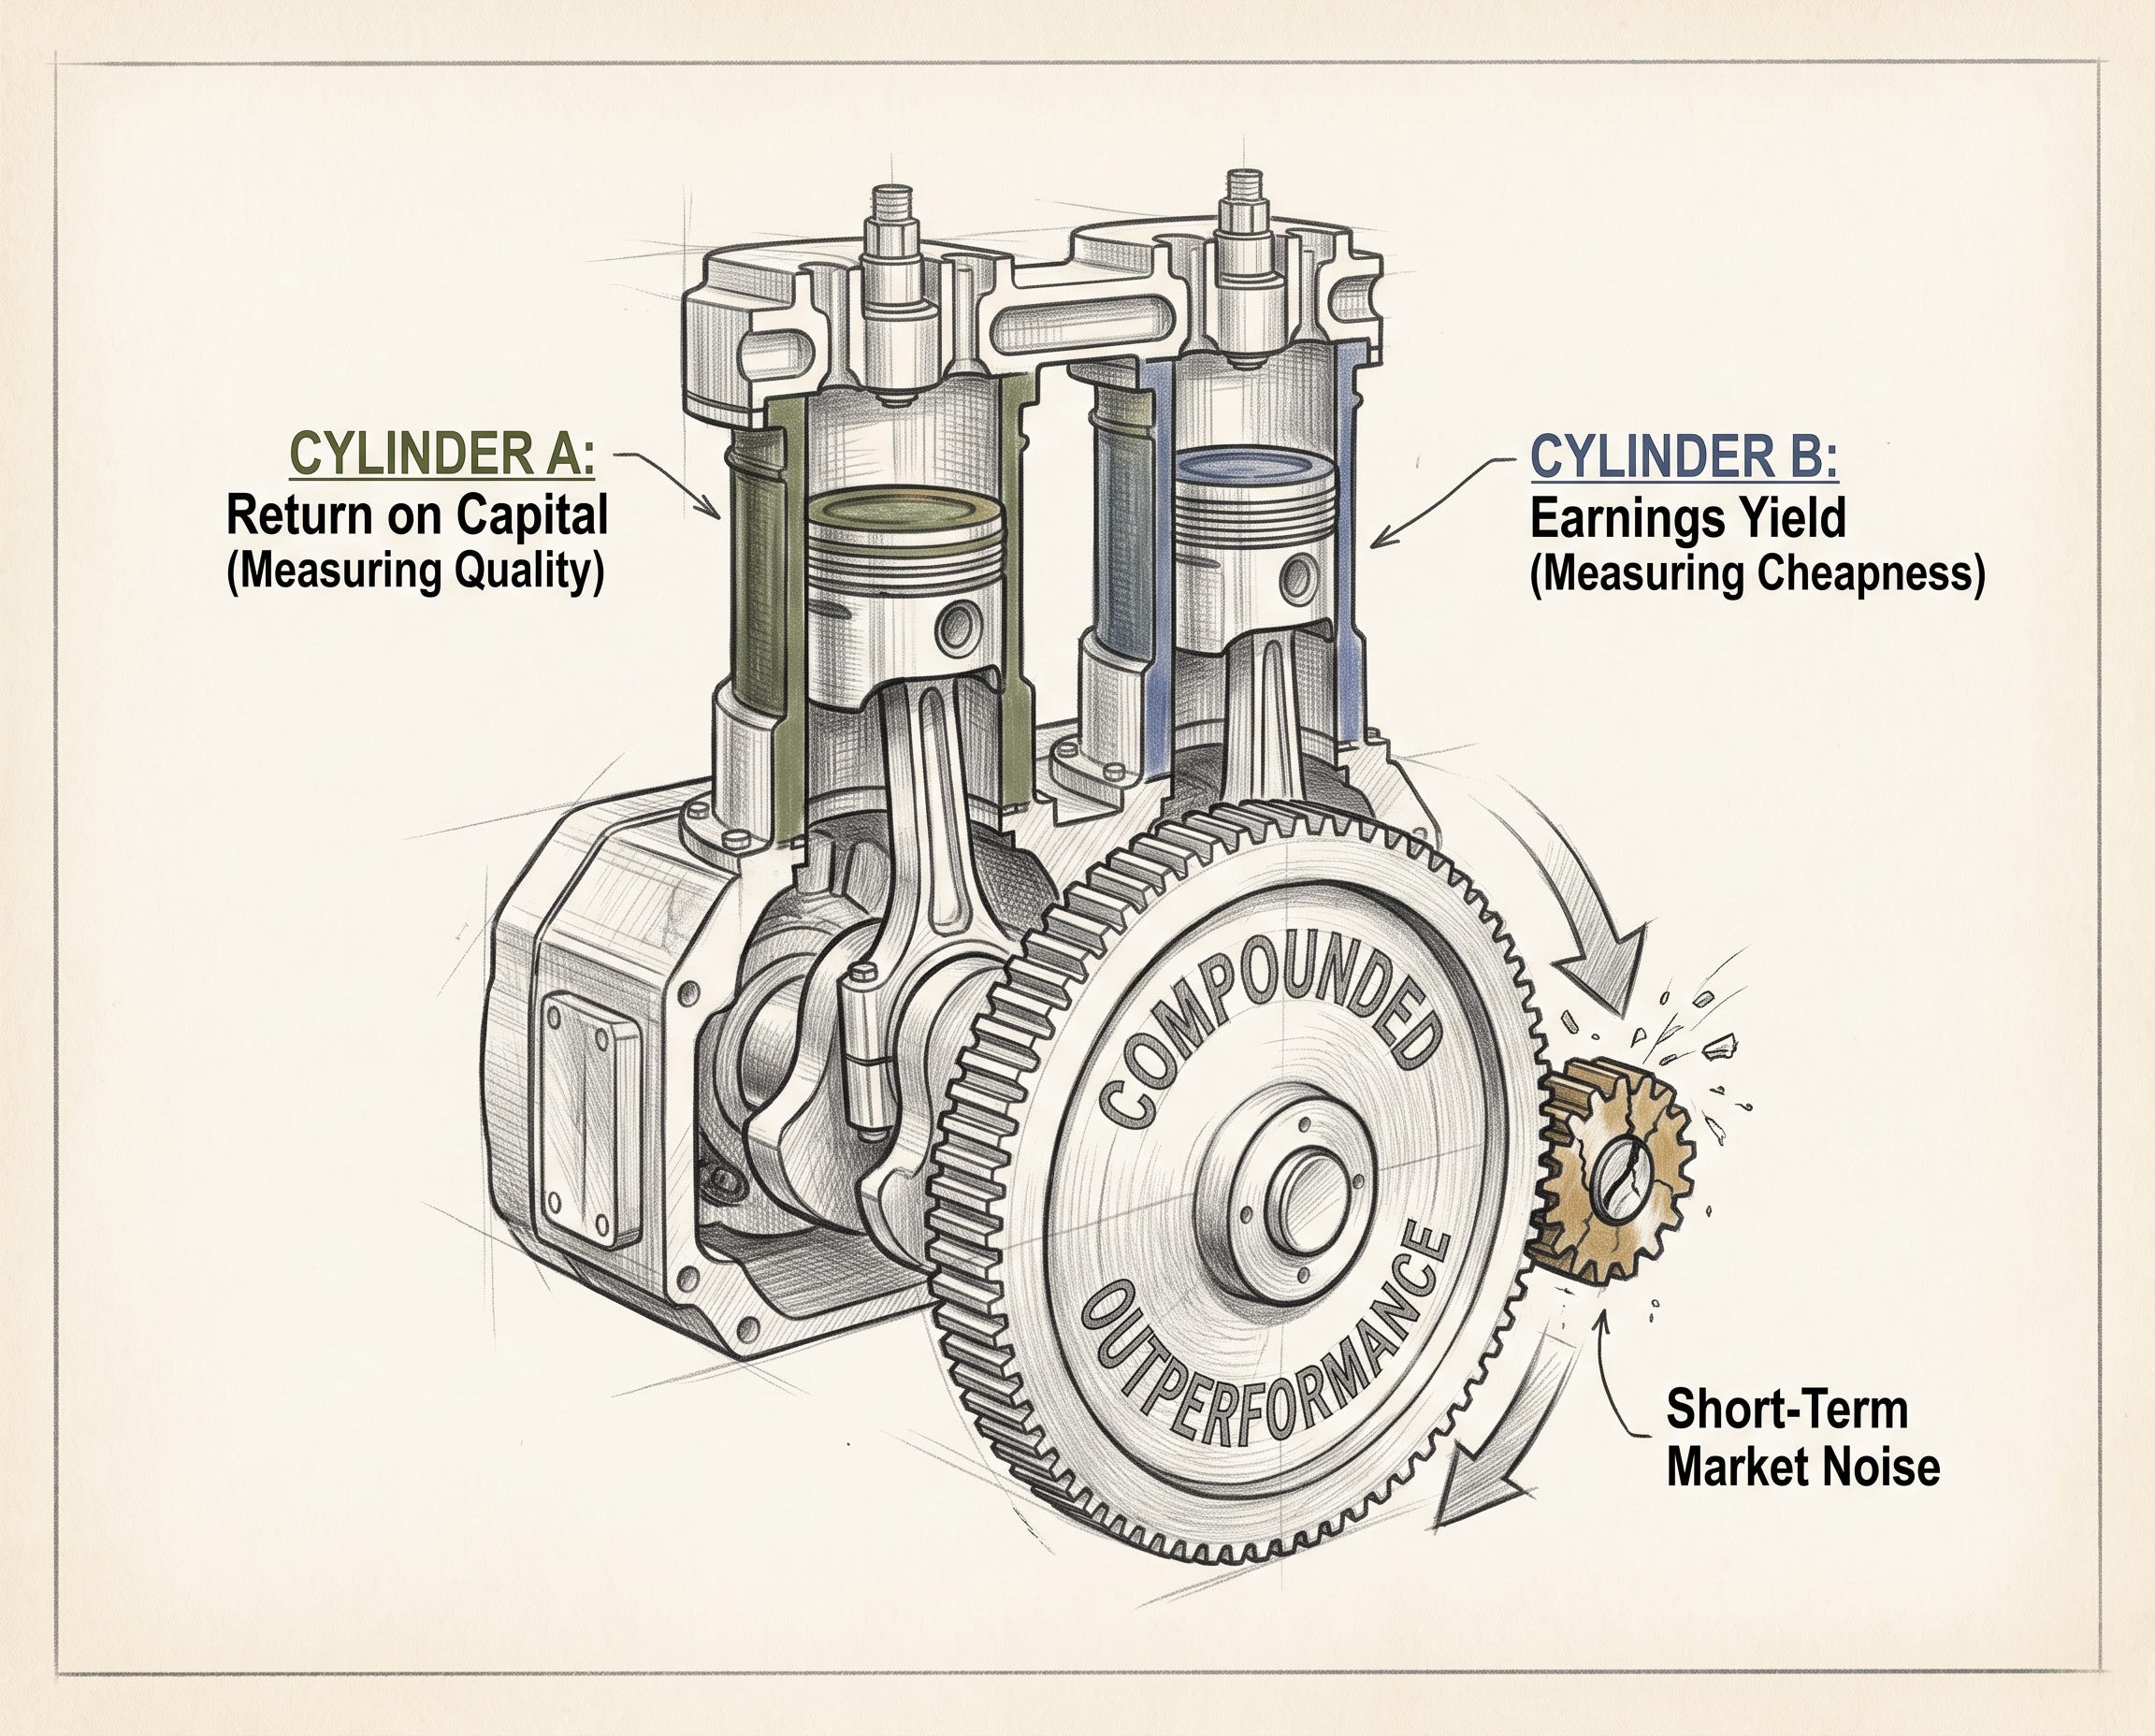
Market participants systematically fail to account for mean reversion. Analysts extrapolate existing operational trends infinitely into the future, overvaluing temporary market darlings and severely punishing distressed businesses. Value creation occurs when a business experiences operational deterioration and falls off its historical growth trajectory. The equity price collapses as market participants panic.
The critical skill lies in distinguishing between temporary operational setbacks and permanent capital erosion. When a fundamentally sound business with high tangible ROIC enters a temporary stabilization trough, the risk-reward ratio becomes asymmetrical. Investors do not need to time the exact bottom. Buying during business stabilization, while allowing a two-to-three-year window for corporate rationalization and market recognition, routinely yields exceptional returns.
How Do Non-Economic Sellers Create Asymmetric Bargains?
The most fertile hunting ground for asymmetric value exists in special situations where market participants face structural mandates to sell equities regardless of price. Corporate spin-offs, index removals, and tax-loss harvesting force institutional funds to liquidate positions for non-economic reasons. When an index fund dumps an equity position because the company was deleted from a benchmark, the selling pressure is purely mechanical. Price separates entirely from value.
Similarly, capital structure complexity creates mispriced optionality. When MIPS Technologies traded at $1.22 per share following an index deletion, the firm held $2.20 per share in net cash, placing the business at a negative Enterprise Value of negative $30 million to $40 million. Investors willing to analyze non-recourse debt structures, unbundle consolidated balance sheets, and evaluate asset coverage can structure positions where downside risk is strictly capped while operational upside remains open-ended.
Why Did I Translate These Lectures Into a Visual Blueprint Deck?
Raw corporate finance lectures and transcripts are dense, text-heavy, and difficult to digest quickly during active market hours. To execute these frameworks effectively in modern markets, visual clarity is paramount.
High-density visual architecture forces structured thinking, isolating core formulas, capital structure mechanics, and special situation decision trees into clear conceptual blueprints.
I converted these foundational lessons into a 6-part visual presentation deck. This visual deck breaks down Greenblatt’s formulas, capital structure adjustments, mean reversion curves, and special situation case studies into precise, easy-to-scan diagrams. It serves as a visual reference manual for institutional fundamental analysis.

Until next time, keep compounding.
If you do find value in the PDFs below, please share it with your investing peers. This keeps me motivated to keep creating these Blueprints.
Disclaimer: The analysis presented in this blog may be flawed and/or critical information may have been overlooked. The content provided should be considered an educational resource and should not be construed as individualized investment advice, nor as a recommendation to buy or sell specific securities. I may own some of the securities discussed. The stocks, funds, and assets discussed are examples only and may not be appropriate for your individual circumstances. It is the responsibility of the reader to do their own due diligence before investing in any index fund, ETF, asset, or stock mentioned or before making any sell decisions. Also double-check if the comments made are accurate. You should always consult with a financial advisor before purchasing a specific stock and making decisions regarding your portfolio.